Media and entertainment Market Analysis
•
0 likes•214 views

This study is done by Harkat Aval Venture Capital. A Market Analysis report on the growth of media & entertainment industry. In this report we also mention the growth share of online media.

Recommended
Recommended
More Related Content
What's hot
What's hot (20)
Similar to Media and entertainment Market Analysis
Similar to Media and entertainment Market Analysis (20)
Recently uploaded
Recently uploaded (20)
Media and entertainment Market Analysis
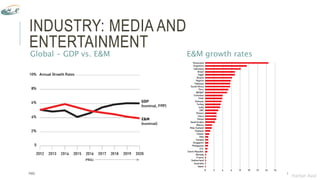
- 1. INDUSTRY: MEDIA AND ENTERTAINMENT Global - GDP vs. E&M E&M growth rates PWC 1 Harkat Aval
- 2. INDUSTRY: MEDIA AND ENTERTAINMENT Internet: Internet access, search, and online classified advertising Video entertainment: TV/video, TV advertising, and cinema Publishing: magazines, newspapers, business-to-business, and books Music: music and radio PWC 2 Compound Annual Growth Rates 2015 – 20 MENA E&M Spending Internet Video Games E&M Spending 2015 Us$ Millions9% 14% 4% Video Entertainment Music Publishing $10,180 7% 7% 0% Harkat Aval
- 3. Industry: Media and entertainment Segment: TV and Video Sector: Online: Electronic home video through TV subscription Electronic home video OTT and/or streaming revenue Offline: Physical home video sell Physical home video rental PWC 3 INDUSTRY: MEDIA AND ENTERTAINMENT Harkat Aval
- 4. AGGREGATE INVESTMENTS: VIDEO INTERNET SOFTWARE & SERVICES 0 10 20 30 40 50 60 - 500 1,000 1,500 2,000 2,500 2012Q2 2012Q3 2012Q4 2013Q1 2013Q2 2013Q3 2013Q4 2014Q1 2014Q2 2014Q3 2014Q4 2015Q1 2015Q2 2015Q3 2015Q4 2016Q1 2016Q2 2016Q3 2016Q4 2017Q1 Funding (Video) Million Dollar Number of Deals (Video) Summary $4.72bn 53.78% 171 -1.67% Funding in last year YoY Funding Growth Deals in last year YoY Deal Growth 41 $501.4M Q3'16 Q2'12 Avg Deals per Quarter Avg Funding per Quarter Biggest Quarter ($ Funding) Biggest Quarter (# of deals) 4 CB INSIGHTS Harkat Aval
- 5. AGGREGATE INVESTMENTS: VIDEO INTERNET SOFTWARE & SERVICES 0 2 4 6 8 10 12 14 16 18 20 2012Q2 2012Q3 2012Q4 2013Q1 2013Q2 2013Q3 2013Q4 2014Q1 2014Q2 2014Q3 2014Q4 2015Q1 2015Q2 2015Q3 2015Q4 2016Q1 2016Q2 2016Q3 2016Q4 2017Q1 M&A IPO 5 Summary 45 9.18% Q2'14 9 Exits in Last Year YoY Exit Growth Biggest Quarter for Exits Average Number of Exits Per Quarter CB INSIGHTS Harkat Aval
- 6. CVC INVESTMENTS: VIDEO INTERNET SOFTWARE & SERVICES 0 2 4 6 8 10 12 14 16 - 200 400 600 800 1,000 1,200 1,400 1,600 1,800 2,000 2012Q2 2012Q3 2012Q4 2013Q1 2013Q2 2013Q3 2013Q4 2014Q1 2014Q2 2014Q3 2014Q4 2015Q1 2015Q2 2015Q3 2015Q4 2016Q1 2016Q2 2016Q3 2016Q4 2017Q1 Funding (Video) Million Dollar Number of Deals (Video) 6 Summary $4.1bn 76.4% 50 13.97% Funding in last year YoY Funding Growth Deals in last year YoY Deal Growth 9 $391M Q3'16 Q1'17 Avg Deals per Quarter Avg Funding per Quarter Biggest Quarter ($ Funding) Biggest Quarter (# of deals) CB INSIGHTS Harkat Aval
- 7. M&A ACTIVITIES: DIGITAL MEDIA Publicly Traded Digital Media Firms Valuation Table (as of 12/30/16) Digital Media M&A Activity Quarterly Comparison 7 SOLGANICK & CO. & PETSKY PRUNIER Harkat Aval