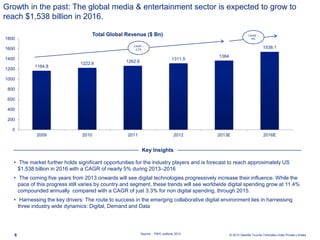
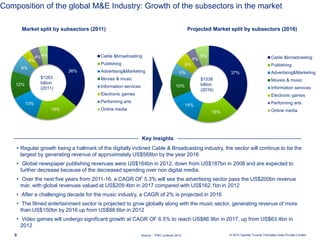
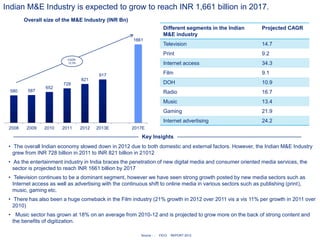
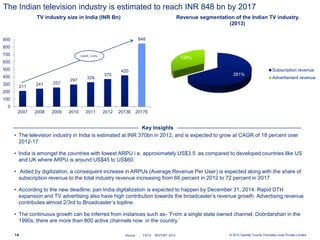
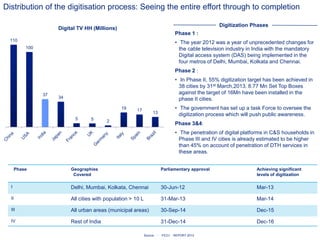
June, 2013
Global Media and
Entertainment Industry
© 2013 Deloitte Touche Tohmatsu India Private Limited2
Table of Contents
Executive Summary
Global market stature
Indian market stature
Indian Television industry
Indian Print Industry
Summary
Executive Summary
© 2013 Deloitte Touche Tohmatsu India Private Limited4
• The coming five years from 2013 onwards will see digital technologies progressively increase their influence in the global
media and entertainment industry .
• Although the pace of this process varies in different countries and segments, the overall global market is estimated at
US$ 1364 billion and is expected to grow at a CAGR of 5% over 2013-16 to reach approximately US $1,538 billion by
2016.
• The television cable and broadcasting sector is predicted to continue to be the largest in the year 2016 as well by
generating a revenue of approximately US$568bn.
• The Indian M&E industry grew from INR 728 billion in 2011 to INR 821 billion in 2012, registering an overall growth of 12.6
percent.
• The M&E industry is estimated to achieve a growth rate of 11.8 percent in 2013 to touch INR 917 billion. The sector is
projected to grow at a healthy CAGR of 15.2 percent to reach INR 1661 billion by 2017
Global stature and Indian market stature
Executive summary
© 2013 Deloitte Touche Tohmatsu India Private Limited5
• The TV industry is one of the largest segments that forms the Media and Entertainment Industry in India which continues
to transform and expand every year.
• India boasts of being the third largest television market in the world.
• The television industry in India is estimated at INR 370 billion in 2012, and is expected to grow at a CAGR of 18 percent
over 2012-17, to reach INR 848 billion in 2017.
• The key players dominating the Indian television industry comprise of Doordarshan, Star TV, ZEE TV and Sony TV.
• TV Industry Value Chain consists of three main players- content creators, broadcasters and distributors.
• Hindi GEC dominates the viewership share in India with a 30% share in 2012 and in the advertisement sector, the
dominant share is enjoyed by Food & Beverages with a 14% share.
• Digitization in recent years, with the implementation of the mandatory Digital access system (DAS), is expected to remain
a significant growth driver for the cable TV industry
• Key trends affecting the Indian Television sector include the expected development of digital TV, mobile TV and IPTV
services and the entry of new providers in the country.
Indian Television industry
Executive summary
© 2013 Deloitte Touche Tohmatsu India Private Limited6
• The Print industry in India is the world's second largest with over 90 million copies in circulation daily after China with 130
million copies in circulation daily.
• After slow growth in 2012 because of challenges due to the sudden onset of changes due to digitisation and online media,
the industry is projected to gradually gain momentum and will be worth INR 340 Bn by 2017 registering CAGR of 8.7%.
• Print continued to be the largest beneficiary, accounting for 46 percent of the advertising pie at INR 150 billion.
• Key Players in the Indian print industry are subdivided into two categories where Dainik Jagran dominates the newspaper
sector and Vanitha dominates the magazine market as of 2012.
• Several print media houses have moved to online channels, which are slow to adapt and monetise their content
effectively but is still a challenging factor for the offline print industry in India.
Indian Print Industry
Executive summary
Global market overview
© 2013 Deloitte Touche Tohmatsu India Private Limited8 Source : PWC outllook 2013
Growth in the past: The global media & entertainment sector is expected to grow to
reach $1,538 billion in 2016.
1164.8
1222.6 1262.6
1311.5
1364
1538.1
0
200
400
600
800
1000
1200
1400
1600
1800
2009 2010 2011 2012 2013E 2016E
Total Global Revenue ($ Bn) CAGR --
5%
CAGR –
4.3%
• The market further holds significant opportunities for the industry players and is forecast to reach approximately US
$1,538 billion in 2016 with a CAGR of nearly 5% during 2013–2016
• The coming five years from 2013 onwards will see digital technologies progressively increase their influence. While the
pace of this progress still varies by country and segment, these trends will see worldwide digital spending grow at 11.4%
compounded annually compared with a CAGR of just 3.3% for non digital spending, through 2015.
• Harnessing the key drivers: The route to success in the emerging collaborative digital environment lies in harnessing
three industry wide dynamics: Digital, Demand and Data
Key Insights
© 2013 Deloitte Touche Tohmatsu India Private Limited9
Composition of the global M&E Industry: Growth of the subsectors in the market
• Regular growth being a hallmark of the digitally inclined Cable & Broadcasting industry, the sector will continue to be the
largest by generating revenue of approximately US$568bn by the year 2016
• Global newspaper publishing revenues were US$164bn in 2012, down from US$187bn in 2008 and are expected to
further decrease because of the decreased spending over non digital media.
• Over the next five years from 2011-16, a CAGR OF 5.3% will see the advertising sector pass the US$200bn revenue
mar, with global revenues valued at US$209.4bn in 2017 compared with US$162.1bn in 2012
• After a challenging decade for the music industry, a CAGR of 2% is projected in 2016
• The filmed entertainment sector is projected to grow globally along with the music sector, generating revenue of more
than US$150bn by 2016 up from US$88.6bn in 2012
• Video games will undergo significant growth at CAGR OF 6.5% to reach US$86.9bn in 2017, up from US$63.4bn in
2012
Source : PWC outllook 2013
Market split by subsectors (2011)
36%
19%
13%
12%
8%
4%
4%4% Cable &broadcasting
Publishing
Advertising&Marketing
Movies & music
Information services
Electronic games
Performing arts
Online media
$1263
billion
(2011)
37%
18%
14%
10%
5%
6%
4%
6% Cable &broadcasting
Publishing
Advertising&Marketing
Movies & music
Information services
Electronic games
Performing arts
Online media
$1538
billion
(2016)
Projected Market split by subsectors (2016)
Key Insights
Indian market overview
© 2013 Deloitte Touche Tohmatsu India Private Limited11
Source : IMF, EIU
Scale(2010) CAGR(2006-2011)
No. Country
GDP
(billion$)
Population
(million)
GDP($)
per head
GDP Population
GDP
per head
1 Singapore 259 5.14 50,566
12.3%/
4.0%
3.1%/
0.8%
8.9%/
3.2%
2 Brunei 16 0.41 40,302
7.3%/
2.3%
1.8%/
1.6%
5.4%/
0.7%
3 Malaysia 278 28.55 9,759
12.2%/
7.4%
1.3%/
1.2%
10.8%/
6.1%
4 Thailand 345 69.52 4,972
10.8%/
8.6%
0.7%/
0.5%
10.1%/
8.1%
5 Indonesia 846 235.00 3,601
18.4%/
11.5%
1.1%/
0.9%
17.0%/
10.4%
6 Philippines 224 95.71 2,348
13.0%/
7.0%
2.0%/
1.8%
10.8%/
5.1%
7 India 1,909 1,210.19 1,578
15.0%/
8.3%
1.6%/
1.4%
13.3%/
6.8%
8 Vietnam 123 87.76 1,409
15.2%/
9.8%
0.9%/
0.8%
14.2%/
9.0%
9 Laos 8 6.29 1,263
19.0%/
10.1%
1.5%/
1.3%
17.3%/
8.7%
10 Cambodia 12 14.33 894
12.0/
10.3%
1.1%/
1.2%
10.7%/
9.0%
11 Myanmar 51 48.39 1,072
29.0%/
6.9%
0.7%/
0.8%
28.1%/
6.0%
Economic scale growth: With an average economic growth rate of ~8.5% over the last 5
years, India is one of the fastest growing Asian economies. This gives it further more
scope to attain the projected growth rates in the M&E industry as well.
580 587
652
728
821
917
1661
2008 2009 2010 2011 2012 2013E 2017E
Overall size of the M&E Industry (INR Bn)
CAGR-
12.3%
• The overall Indian economy slowed down in 2012 due to both domestic and external factors. However, the Indian M&E Industry
grew from INR 728 billion in 2011 to INR 821 billion in 21012
• As the entertainment industry in India braces the penetration of new digital media and consumer oriented media services, the
sector is projected to reach INR 1661 billion by 2017
• Television continues to be a dominant segment, however we have seen strong growth posted by new media sectors such as
Internet access as well as advertising with the continuous shift to online media in various sectors such as publishing (print),
music, gaming etc.
• There has also been a huge comeback in the Film industry (21% growth in 2012 over 2011 vis a vis 11% per growth in 2011 over
2010)
• Music sector has grown at 18% on an average from 2010-12 and is projected to grow more on the back of strong content and
the benefits of digitization.
Source : : FICCI REPORT 2013
Indian M&E Industry is expected to grow to reach INR 1,661 billion in 2017.
Different segments in the Indian
M&E industry
Projected CAGR
Television 14.7
Print 9.2
Internet access 34.3
Film 9.1
DOH 10.9
Radio 16.7
Music 13.4
Gaming 21.9
Internet advertising 24.2
Key Insights
Indian Television Industry
© 2013 Deloitte Touche Tohmatsu India Private Limited14
• The television industry in India is estimated at INR 370bn in 2012, and is expected to grow at CAGR of 18 percent over
2012-17
• India is amongst the countries with lowest ARPU i.e. approximately US$3.5 as compared to developed countries like US
and UK where ARPU is around US$45 to US$60.
• Aided by digitization, a consequent increase in ARPUs (Average Revenue Per User) is expected along with the share of
subscription revenue to the total industry revenue increasing from 66 percent in 2012 to 72 percent in 2017
• According to the new deadline, pan India digitalization is expected to happen by December 31, 2014. Rapid DTH
expansion and TV advertising also have high contribution towards the broadcaster’s revenue growth. Advertising revenue
contributes almost 2/3rd to Broadcaster’s topline.
• The continuous growth can be inferred from instances such as- ‘From a single state owned channel, Doordarshan in the
1990s, there are more than 800 active channels now in the country.’
211
241 257
297
329
370
420
848
0
100
200
300
400
500
600
700
800
900
2007 2008 2009 2010 2011 2012 2013E 2017E
TV industry size in India (INR Bn)
CAGR- 14.9%
281%
139%
Revenue segmentation of the Indian TV industry
(2013)
Subscription revenue
Advertisment revenue
Source : : FICCI REPORT 2013
The Indian television industry is estimated to reach INR 848 bn by 2017
Key Insights
© 2013 Deloitte Touche Tohmatsu India Private Limited15
TRP Overall responses Recent Initiatives & Future Plans
Doordarshan N/A
Further, in a reflection of
India’s growing diaspora,
Indian channels have
also been aggressively
increasing their presence
across international
markets.
• Fully digital DD network in all the three areas viz. satellite
transmission, program production and terrestrial transmission.
• Provision of HDTV telecasts to viewers.
• Strengthening of DTH service.
• Strengthening of TV coverage in strategic border areas of J &K,
NE States & other border areas.
STAR TV
(Satellite
Television
Asia Network)
• 2.3
• Channels like Star Plus are available in 70 countries.
• Star plus was declared Entertainment of the year at Consumer
Awards 2011.
ZEE
Television
• 1.49
• Channels from Zee TV are available in 169 countries.
• ZEEL launched it’s second Arabic channel, Zee Alwan in 2012
and industry discussions suggest that the response has been
positive.
• ZEEL has been syndicating Indian dramas dubbed in
Mandarin to Chinese television channels since 2006 and became
the first Indian channel to receive landing rights in China in 2012.
Sony
Television
• 0.89
• Strategic investment and foundation-building for new business
creation and strengthening core electronics businesses.
• High value added products development.
• Accelerate execution of updated strategies in the three core
businesses (Mobile, Imaging and gaming)
Key Players in the Indian TV industry
Other players operating in India – United Television, CNN, ATN, BBC World, Discovery Channel.
Source : : FICCI REPORT 2013
© 2013 Deloitte Touche Tohmatsu India Private Limited16
Within the TV Industry value chain, Content creators produce the TV programming which
is aggregated by broadcasters and aired to end customer by the distributors
Content production Broadcasting Distribution
Independent repackaging of the
content that is to be provided to the
broadcaster.
For instance:
• Launch of new niche channels
• Cable digitization
•UTV
•Balaji
•Sri Adhikari Brothers Television
Network Ltd.
•Creative Eye Limited
•Increased number of channels are
driving growth and content
production costs.
• Challenge to invest in and
upgrade the content quality
• Improvement of negotiation
through consolidated entities
(MediaPro, One Alliance, India Cast
etc.) and a measurement tool for
impact on audience.
• High carriage fee to distributors
•Star Plus
•NDTV
•Sony
•Colors
•Zee TV
Distribution of content through
audio & video signals to transmit
programs to an audience.
For instance:
• Redirecting carriage savings &
rationalizing carriage costs.
• Almost 75% of the revenue is
garnered by LCO due to domination
of non- addressable analogue
subscriptions.
•Digicable
•Hathway
•DEN
•Tata Sky
•Big TV
•Bharti Airtel
Making the content available to the
audience using various techniques.
For instance:
• Verification of customer bases by
MSO’s.
Role in the
value chain
Challenges
Key players
Source : : Deloitte Analysis, FICCI REPORT 2013
14
12
7
5
5
4
4
3
3
3
Advertising sector on TV (% share in 2012)
Food &beverages
Personal care/ hygiene
Services
Personal accessories
Hair care
Auto
Personal healthcare
0.14
0.23
0.88
30.01
3.18
11.93
20.18
2.78
3.65
6.47
3.09
1.08
16.4
Genre viewership in India (% share in 2012)
English entertainment
English news
Englush Movies
Hindi GEC
Hindi News
Hindi Movies
Regional GEC
Regional News
Regional Movies
Kids
Music
Infotainment
Others
Key Insights
• Hindi and regional General Entertainment Channels (GECs) continued to account for over 50 percent of the total viewership. GECs
are the key drivers of television viewership, accounting for 65-75 percent of Hindi and regional markets
• Hindi GEC and Hindi movie genres consolidated their position with a viewership share of 30.0% and 11.9% in 2012, compared to
26.5% and 10.6% respectively in 2011
• In areas that were digitized, increased audience fragmentation was witnessed as viewing patterns of some niche channels have
seen a positive movement when comparing their pre-digitization and post-digitization share of viewership. For instance, Food Food,
Zee Khana Khazana, Shagun TV and the upcoming EPIC Indian history based channel.
• Advertisement sector is expected to grow at a similar rate in 2013. The outlook for the Indian television advertising industry remains
positive with CAGR OF 14% over 2012-17
• The food and beverages have the benefit of owning the maximum share in the advertising sector and the Top advertisers on TV
are Hindustan Lever Ltd and Reckitt Benchiser Ltd with 8& and 3% share respectively
Source : : FICCI REPORT 2013
As of 2012, Hindi GEC has the highest viewership in India followed by regional GEC
110
100
37
34
5 5 2
19 17
13
Digital TV HH (Millions)
Phase 1 :
• The year 2012 was a year of unprecedented changes for
the cable television industry in India with the mandatory
Digital access system (DAS) being implemented in the
four metros of Delhi, Mumbai, Kolkata and Chennai.
Phase 2 :
• In Phase II, 55% digitization target has been achieved in
38 cities by 31st March,2013. 8.77 Mn Set Top Boxes
against the target of 16Mn have been installed in the
phase II cities.
• The government has set up a task Force to oversee the
digitization process which will push public awareness.
Phase 3&4:
• The penetration of digital platforms in C&S households in
Phase III and IV cities is already estimated to be higher
than 45% on account of penetration of DTH services in
these areas.
Phase Geographies
Covered
Parliamentary approval Achieving significant
levels of digitization
I Delhi, Mumbai, Kolkata, Chennai 30-Jun-12 Mar-13
II All cities with population > 10 L 31-Mar-13 Mar-14
III All urban areas (municipal areas) 30-Sep-14 Dec-15
IV Rest of India 31-Dec-14 Dec-16
Source : : FICCI REPORT 2013
Distribution of the digitisation process: Seeing the entire effort through to completion
Digitization Phases
Indian Print Industry
59
45 46
62
49 51
79
83 85
English Hindi Vernacualr
2012
2013P
2017P
Advertising mix (INR bn)
4..8%
10..8%
8.7%
Key Insights
• The Indian print industry continues to be a promising
long term growth story.
• However, in 2013 the growth of the industry is expected
to be subdued and from mid 2014 onwards, it will
gradually gain momentum and will be worth INR 340 Bn
by 2017 registering CAGR of 8.7%.
• After challenging times in the year 2012, the Indian print
industry has adopted a pragmatic approach with most
print players now focusing on consolidating their position
in core markets and penetrating them further through the
launch of new editions rather than entering newer
territories.
• While the market for English dailies continues to be
tough, the regional and vernacular markets continue to
defy gravity and grow on the back of rising literacy and
low print media penetration as well as the continued tide
of advertisers wanting to spend in these markets.
• The print industry continues to derive most (94%) of its
revenues from the newspaper category whereas the
magazine segment continues to decline in share.
• Advertising is a prime contributor (67%) to the total
revenue earned by the print sector.
• In the long run, it would be prudent for the industry to
increase circulation/ subscription revenue as much as
possible.
Source : : FICCI REPORT 2013
88 86 90 109
62 68 75
114
63 69
76
116
2011 2012 2013p 2017p
Vernacular
Hindi
English
Print media market (INR bn)
The Indian print industry is expected to be worth INR 340 bn by 2017
Advertising and circulation revenue share
67%
33%
In 2012-13(P) (%)
Advertising Circulation
73%
27%
In 2017 (P) (%)
Advertising Circulation
Categories 2011 2012 Change
over 2011
Auto 9.8 11.4
Education 10.6 10.6
FMCG 8.9 10.3
Real estate & home
improvement
8.4 8.6
Clothing/ Fashion/
Jewellery
6.5 7.1
Retail 5.6 5.8
BFSI 6.7 5.7
HH durables 5.7 4.9
Travel & Tourism 2.8 2.3
Corporate 2.8 2.2
Media 1.5 1.4
Alcoholic beverages 0.2 0.1
Others 25.7 25.3
Top categories on print ( by volume )
Source : : FICCI REPORT 2013
In the print industry, the advertisement revenue continues to dominate and grow more in
contrast with the growth in the subscription revenue
 For the first time in the last 5 years, the education category is not
the highest spender in the print medium
 While the education sector has maintained it’s share on print
advertising at 10.6%, the Auto sector has increased it’s
contribution to 11.4% in 2012 as compared to 9.8% in 2011
 The next two years will be critical, because of expansion of
demand for online print media, with the advertising growth to be
largely driven by increases in election spend, advertising driven
by the launch of new products, categories expanding due to
product and brand launches, launch of new edition, publications
catering to niche market
Publications Language AIR (in ‘000)
Dainik Jagran Hindi 16474
Dainik Bhaskar Hindi 14491
Hindustan Hindi 12242
Malayala
Manorama Malayalam
9752
Amar Ujala Hindi 8536
The Times of India English 7653
Daily Thanthi Tamil 7417
Lokmat Marathi 7409
Rajasthan Patrika Hindi 6818
Mathrubhumi Malayalam 6415
Magazine Language Q3 2012
Vanitha Malayalam 2271
Pratiyogita
Darpan
Hindi 1894
SamanyaGyan
Darpan
Hindi 1733
India Today English 1526
Saras Sahil Hindi 1351
Meri Saheli Hindi 1205
Karmakshetra Hindi 1183
Malayala
Manorama
Malayalam 1053
General
Knowledge
Today
English 1047
Cricket Samrat Hindi 1044
Key Players in the Indian print industry are subdivided into two categories (Newspaper
dailies and Magazines)
Source : : FICCI REPORT 2013
Average Readership (AIR) of top 10 dailies
Key Growth Drivers
Recognizing the potential of rural India, i9 media
launched ‘Rural Marketing’ magazine with a focus on
highlighting the finer points of the rural bases, which
go unnoticed by mainstream India.
Regionalisaton or the tapping the potential growth of
Hindi and Vernacular markets.
Rising literacy, growth in disposable income, brand
consciousness and strong commercial development
in tier II and tier III cities.
The resurgence in advertising, growth in subscription
revenues, thrust on digitization, and emerging
avenues for content monetization
To compete with the imported newsprint, domestic
newsprint manufacturing companies are not able to
increase prices leading to tremendous financial
pressure and no incentive for any manufacturer to
add to existing capacity.
Availability of talent remains a challenge for the print
industry. There are very few quality oriented
journalism schools in India and very few students
choose this career as a first preference.
India’s literate population base of 895 Mn provides a
huge target audience to print companies. However
on an average 44% of the Indian population does not
read any publication.
Challenges
Monetisation of online media (print) channels to
optimize performance in the long run and harness
bigger revenues.
Recognizing the key growth drivers and challenges in the Indian print Industry
Source : : FICCI REPORT 2013
Recognizing the potential of rural India, i9 media
launched ‘Rural Marketing’ magazine with a focus on
highlighting the finer points of the rural bases, which
go unnoticed by mainstream India.
Global comparisons on the basis of online newspaper reading behaviour
66.9
39.1
43.2
33
43.5
35.4
Users that ever visit a site (%)
USA
Brazil
Germany
Russia
France
India
17.1
8.5
11.7
7.4
11.6
9.9
Users that visit a paper site
daily (%)
USA
Brazil
Germany
Russia
France
India
1.1
0.6
1.9
0.5
1.6
2.1
% of pages viewed per user
USA
Brazil
Germany
Russia
France
India
• In marked contrast to the global trends, the Indian print industry is growing with steady increase in both advertising and
circulation revenues
• Although, the internet broadband penetration has been increasing at an enormous pace, current penetration levels are
too low to pose a significant threat to the offline print industry
• Online reading behaviour indicates that only 35.4 % of the Indian who ever use the internet, visit newspaper websites
and only 9.9% of daily web users turn to their newspaper website daily. This is substantially low when compared to
countries such as USA and France
• Although, several print media houses have moved to online channels, they are usually slow to adapt or monetise their
content effectively
• For instance, HT Media’s digital segment witnessed an 18 percent increase in revenues from its digital segment to INR
138 million from INR 117 million in Q3FY13 as compared to Q3FY12. HT Mobile registered a 40 percent growth over
Q3 FY12
• Due to technological advancements and growing user needs, content today is highly interactive, easily distributable to
its users at low cost and is real time. However, monetising digitised content online is another industry challenge
Source : : FICCI REPORT 2013
Key Insights

Final Media & Entertainment Industry_2506

  • 1.
    June, 2013 Global Mediaand Entertainment Industry
  • 2.
    © 2013 DeloitteTouche Tohmatsu India Private Limited2 Table of Contents Executive Summary Global market stature Indian market stature Indian Television industry Indian Print Industry Summary
  • 3.
  • 4.
    © 2013 DeloitteTouche Tohmatsu India Private Limited4 • The coming five years from 2013 onwards will see digital technologies progressively increase their influence in the global media and entertainment industry . • Although the pace of this process varies in different countries and segments, the overall global market is estimated at US$ 1364 billion and is expected to grow at a CAGR of 5% over 2013-16 to reach approximately US $1,538 billion by 2016. • The television cable and broadcasting sector is predicted to continue to be the largest in the year 2016 as well by generating a revenue of approximately US$568bn. • The Indian M&E industry grew from INR 728 billion in 2011 to INR 821 billion in 2012, registering an overall growth of 12.6 percent. • The M&E industry is estimated to achieve a growth rate of 11.8 percent in 2013 to touch INR 917 billion. The sector is projected to grow at a healthy CAGR of 15.2 percent to reach INR 1661 billion by 2017 Global stature and Indian market stature Executive summary
  • 5.
    © 2013 DeloitteTouche Tohmatsu India Private Limited5 • The TV industry is one of the largest segments that forms the Media and Entertainment Industry in India which continues to transform and expand every year. • India boasts of being the third largest television market in the world. • The television industry in India is estimated at INR 370 billion in 2012, and is expected to grow at a CAGR of 18 percent over 2012-17, to reach INR 848 billion in 2017. • The key players dominating the Indian television industry comprise of Doordarshan, Star TV, ZEE TV and Sony TV. • TV Industry Value Chain consists of three main players- content creators, broadcasters and distributors. • Hindi GEC dominates the viewership share in India with a 30% share in 2012 and in the advertisement sector, the dominant share is enjoyed by Food & Beverages with a 14% share. • Digitization in recent years, with the implementation of the mandatory Digital access system (DAS), is expected to remain a significant growth driver for the cable TV industry • Key trends affecting the Indian Television sector include the expected development of digital TV, mobile TV and IPTV services and the entry of new providers in the country. Indian Television industry Executive summary
  • 6.
    © 2013 DeloitteTouche Tohmatsu India Private Limited6 • The Print industry in India is the world's second largest with over 90 million copies in circulation daily after China with 130 million copies in circulation daily. • After slow growth in 2012 because of challenges due to the sudden onset of changes due to digitisation and online media, the industry is projected to gradually gain momentum and will be worth INR 340 Bn by 2017 registering CAGR of 8.7%. • Print continued to be the largest beneficiary, accounting for 46 percent of the advertising pie at INR 150 billion. • Key Players in the Indian print industry are subdivided into two categories where Dainik Jagran dominates the newspaper sector and Vanitha dominates the magazine market as of 2012. • Several print media houses have moved to online channels, which are slow to adapt and monetise their content effectively but is still a challenging factor for the offline print industry in India. Indian Print Industry Executive summary
  • 7.
  • 8.
    © 2013 DeloitteTouche Tohmatsu India Private Limited8 Source : PWC outllook 2013 Growth in the past: The global media & entertainment sector is expected to grow to reach $1,538 billion in 2016. 1164.8 1222.6 1262.6 1311.5 1364 1538.1 0 200 400 600 800 1000 1200 1400 1600 1800 2009 2010 2011 2012 2013E 2016E Total Global Revenue ($ Bn) CAGR -- 5% CAGR – 4.3% • The market further holds significant opportunities for the industry players and is forecast to reach approximately US $1,538 billion in 2016 with a CAGR of nearly 5% during 2013–2016 • The coming five years from 2013 onwards will see digital technologies progressively increase their influence. While the pace of this progress still varies by country and segment, these trends will see worldwide digital spending grow at 11.4% compounded annually compared with a CAGR of just 3.3% for non digital spending, through 2015. • Harnessing the key drivers: The route to success in the emerging collaborative digital environment lies in harnessing three industry wide dynamics: Digital, Demand and Data Key Insights
  • 9.
    © 2013 DeloitteTouche Tohmatsu India Private Limited9 Composition of the global M&E Industry: Growth of the subsectors in the market • Regular growth being a hallmark of the digitally inclined Cable & Broadcasting industry, the sector will continue to be the largest by generating revenue of approximately US$568bn by the year 2016 • Global newspaper publishing revenues were US$164bn in 2012, down from US$187bn in 2008 and are expected to further decrease because of the decreased spending over non digital media. • Over the next five years from 2011-16, a CAGR OF 5.3% will see the advertising sector pass the US$200bn revenue mar, with global revenues valued at US$209.4bn in 2017 compared with US$162.1bn in 2012 • After a challenging decade for the music industry, a CAGR of 2% is projected in 2016 • The filmed entertainment sector is projected to grow globally along with the music sector, generating revenue of more than US$150bn by 2016 up from US$88.6bn in 2012 • Video games will undergo significant growth at CAGR OF 6.5% to reach US$86.9bn in 2017, up from US$63.4bn in 2012 Source : PWC outllook 2013 Market split by subsectors (2011) 36% 19% 13% 12% 8% 4% 4%4% Cable &broadcasting Publishing Advertising&Marketing Movies & music Information services Electronic games Performing arts Online media $1263 billion (2011) 37% 18% 14% 10% 5% 6% 4% 6% Cable &broadcasting Publishing Advertising&Marketing Movies & music Information services Electronic games Performing arts Online media $1538 billion (2016) Projected Market split by subsectors (2016) Key Insights
  • 10.
  • 11.
    © 2013 DeloitteTouche Tohmatsu India Private Limited11 Source : IMF, EIU Scale(2010) CAGR(2006-2011) No. Country GDP (billion$) Population (million) GDP($) per head GDP Population GDP per head 1 Singapore 259 5.14 50,566 12.3%/ 4.0% 3.1%/ 0.8% 8.9%/ 3.2% 2 Brunei 16 0.41 40,302 7.3%/ 2.3% 1.8%/ 1.6% 5.4%/ 0.7% 3 Malaysia 278 28.55 9,759 12.2%/ 7.4% 1.3%/ 1.2% 10.8%/ 6.1% 4 Thailand 345 69.52 4,972 10.8%/ 8.6% 0.7%/ 0.5% 10.1%/ 8.1% 5 Indonesia 846 235.00 3,601 18.4%/ 11.5% 1.1%/ 0.9% 17.0%/ 10.4% 6 Philippines 224 95.71 2,348 13.0%/ 7.0% 2.0%/ 1.8% 10.8%/ 5.1% 7 India 1,909 1,210.19 1,578 15.0%/ 8.3% 1.6%/ 1.4% 13.3%/ 6.8% 8 Vietnam 123 87.76 1,409 15.2%/ 9.8% 0.9%/ 0.8% 14.2%/ 9.0% 9 Laos 8 6.29 1,263 19.0%/ 10.1% 1.5%/ 1.3% 17.3%/ 8.7% 10 Cambodia 12 14.33 894 12.0/ 10.3% 1.1%/ 1.2% 10.7%/ 9.0% 11 Myanmar 51 48.39 1,072 29.0%/ 6.9% 0.7%/ 0.8% 28.1%/ 6.0% Economic scale growth: With an average economic growth rate of ~8.5% over the last 5 years, India is one of the fastest growing Asian economies. This gives it further more scope to attain the projected growth rates in the M&E industry as well.
  • 12.
    580 587 652 728 821 917 1661 2008 20092010 2011 2012 2013E 2017E Overall size of the M&E Industry (INR Bn) CAGR- 12.3% • The overall Indian economy slowed down in 2012 due to both domestic and external factors. However, the Indian M&E Industry grew from INR 728 billion in 2011 to INR 821 billion in 21012 • As the entertainment industry in India braces the penetration of new digital media and consumer oriented media services, the sector is projected to reach INR 1661 billion by 2017 • Television continues to be a dominant segment, however we have seen strong growth posted by new media sectors such as Internet access as well as advertising with the continuous shift to online media in various sectors such as publishing (print), music, gaming etc. • There has also been a huge comeback in the Film industry (21% growth in 2012 over 2011 vis a vis 11% per growth in 2011 over 2010) • Music sector has grown at 18% on an average from 2010-12 and is projected to grow more on the back of strong content and the benefits of digitization. Source : : FICCI REPORT 2013 Indian M&E Industry is expected to grow to reach INR 1,661 billion in 2017. Different segments in the Indian M&E industry Projected CAGR Television 14.7 Print 9.2 Internet access 34.3 Film 9.1 DOH 10.9 Radio 16.7 Music 13.4 Gaming 21.9 Internet advertising 24.2 Key Insights
  • 13.
  • 14.
    © 2013 DeloitteTouche Tohmatsu India Private Limited14 • The television industry in India is estimated at INR 370bn in 2012, and is expected to grow at CAGR of 18 percent over 2012-17 • India is amongst the countries with lowest ARPU i.e. approximately US$3.5 as compared to developed countries like US and UK where ARPU is around US$45 to US$60. • Aided by digitization, a consequent increase in ARPUs (Average Revenue Per User) is expected along with the share of subscription revenue to the total industry revenue increasing from 66 percent in 2012 to 72 percent in 2017 • According to the new deadline, pan India digitalization is expected to happen by December 31, 2014. Rapid DTH expansion and TV advertising also have high contribution towards the broadcaster’s revenue growth. Advertising revenue contributes almost 2/3rd to Broadcaster’s topline. • The continuous growth can be inferred from instances such as- ‘From a single state owned channel, Doordarshan in the 1990s, there are more than 800 active channels now in the country.’ 211 241 257 297 329 370 420 848 0 100 200 300 400 500 600 700 800 900 2007 2008 2009 2010 2011 2012 2013E 2017E TV industry size in India (INR Bn) CAGR- 14.9% 281% 139% Revenue segmentation of the Indian TV industry (2013) Subscription revenue Advertisment revenue Source : : FICCI REPORT 2013 The Indian television industry is estimated to reach INR 848 bn by 2017 Key Insights
  • 15.
    © 2013 DeloitteTouche Tohmatsu India Private Limited15 TRP Overall responses Recent Initiatives & Future Plans Doordarshan N/A Further, in a reflection of India’s growing diaspora, Indian channels have also been aggressively increasing their presence across international markets. • Fully digital DD network in all the three areas viz. satellite transmission, program production and terrestrial transmission. • Provision of HDTV telecasts to viewers. • Strengthening of DTH service. • Strengthening of TV coverage in strategic border areas of J &K, NE States & other border areas. STAR TV (Satellite Television Asia Network) • 2.3 • Channels like Star Plus are available in 70 countries. • Star plus was declared Entertainment of the year at Consumer Awards 2011. ZEE Television • 1.49 • Channels from Zee TV are available in 169 countries. • ZEEL launched it’s second Arabic channel, Zee Alwan in 2012 and industry discussions suggest that the response has been positive. • ZEEL has been syndicating Indian dramas dubbed in Mandarin to Chinese television channels since 2006 and became the first Indian channel to receive landing rights in China in 2012. Sony Television • 0.89 • Strategic investment and foundation-building for new business creation and strengthening core electronics businesses. • High value added products development. • Accelerate execution of updated strategies in the three core businesses (Mobile, Imaging and gaming) Key Players in the Indian TV industry Other players operating in India – United Television, CNN, ATN, BBC World, Discovery Channel. Source : : FICCI REPORT 2013
  • 16.
    © 2013 DeloitteTouche Tohmatsu India Private Limited16 Within the TV Industry value chain, Content creators produce the TV programming which is aggregated by broadcasters and aired to end customer by the distributors Content production Broadcasting Distribution Independent repackaging of the content that is to be provided to the broadcaster. For instance: • Launch of new niche channels • Cable digitization •UTV •Balaji •Sri Adhikari Brothers Television Network Ltd. •Creative Eye Limited •Increased number of channels are driving growth and content production costs. • Challenge to invest in and upgrade the content quality • Improvement of negotiation through consolidated entities (MediaPro, One Alliance, India Cast etc.) and a measurement tool for impact on audience. • High carriage fee to distributors •Star Plus •NDTV •Sony •Colors •Zee TV Distribution of content through audio & video signals to transmit programs to an audience. For instance: • Redirecting carriage savings & rationalizing carriage costs. • Almost 75% of the revenue is garnered by LCO due to domination of non- addressable analogue subscriptions. •Digicable •Hathway •DEN •Tata Sky •Big TV •Bharti Airtel Making the content available to the audience using various techniques. For instance: • Verification of customer bases by MSO’s. Role in the value chain Challenges Key players Source : : Deloitte Analysis, FICCI REPORT 2013
  • 17.
    14 12 7 5 5 4 4 3 3 3 Advertising sector onTV (% share in 2012) Food &beverages Personal care/ hygiene Services Personal accessories Hair care Auto Personal healthcare 0.14 0.23 0.88 30.01 3.18 11.93 20.18 2.78 3.65 6.47 3.09 1.08 16.4 Genre viewership in India (% share in 2012) English entertainment English news Englush Movies Hindi GEC Hindi News Hindi Movies Regional GEC Regional News Regional Movies Kids Music Infotainment Others Key Insights • Hindi and regional General Entertainment Channels (GECs) continued to account for over 50 percent of the total viewership. GECs are the key drivers of television viewership, accounting for 65-75 percent of Hindi and regional markets • Hindi GEC and Hindi movie genres consolidated their position with a viewership share of 30.0% and 11.9% in 2012, compared to 26.5% and 10.6% respectively in 2011 • In areas that were digitized, increased audience fragmentation was witnessed as viewing patterns of some niche channels have seen a positive movement when comparing their pre-digitization and post-digitization share of viewership. For instance, Food Food, Zee Khana Khazana, Shagun TV and the upcoming EPIC Indian history based channel. • Advertisement sector is expected to grow at a similar rate in 2013. The outlook for the Indian television advertising industry remains positive with CAGR OF 14% over 2012-17 • The food and beverages have the benefit of owning the maximum share in the advertising sector and the Top advertisers on TV are Hindustan Lever Ltd and Reckitt Benchiser Ltd with 8& and 3% share respectively Source : : FICCI REPORT 2013 As of 2012, Hindi GEC has the highest viewership in India followed by regional GEC
  • 18.
    110 100 37 34 5 5 2 1917 13 Digital TV HH (Millions) Phase 1 : • The year 2012 was a year of unprecedented changes for the cable television industry in India with the mandatory Digital access system (DAS) being implemented in the four metros of Delhi, Mumbai, Kolkata and Chennai. Phase 2 : • In Phase II, 55% digitization target has been achieved in 38 cities by 31st March,2013. 8.77 Mn Set Top Boxes against the target of 16Mn have been installed in the phase II cities. • The government has set up a task Force to oversee the digitization process which will push public awareness. Phase 3&4: • The penetration of digital platforms in C&S households in Phase III and IV cities is already estimated to be higher than 45% on account of penetration of DTH services in these areas. Phase Geographies Covered Parliamentary approval Achieving significant levels of digitization I Delhi, Mumbai, Kolkata, Chennai 30-Jun-12 Mar-13 II All cities with population > 10 L 31-Mar-13 Mar-14 III All urban areas (municipal areas) 30-Sep-14 Dec-15 IV Rest of India 31-Dec-14 Dec-16 Source : : FICCI REPORT 2013 Distribution of the digitisation process: Seeing the entire effort through to completion Digitization Phases
  • 19.
  • 20.
    59 45 46 62 49 51 79 8385 English Hindi Vernacualr 2012 2013P 2017P Advertising mix (INR bn) 4..8% 10..8% 8.7% Key Insights • The Indian print industry continues to be a promising long term growth story. • However, in 2013 the growth of the industry is expected to be subdued and from mid 2014 onwards, it will gradually gain momentum and will be worth INR 340 Bn by 2017 registering CAGR of 8.7%. • After challenging times in the year 2012, the Indian print industry has adopted a pragmatic approach with most print players now focusing on consolidating their position in core markets and penetrating them further through the launch of new editions rather than entering newer territories. • While the market for English dailies continues to be tough, the regional and vernacular markets continue to defy gravity and grow on the back of rising literacy and low print media penetration as well as the continued tide of advertisers wanting to spend in these markets. • The print industry continues to derive most (94%) of its revenues from the newspaper category whereas the magazine segment continues to decline in share. • Advertising is a prime contributor (67%) to the total revenue earned by the print sector. • In the long run, it would be prudent for the industry to increase circulation/ subscription revenue as much as possible. Source : : FICCI REPORT 2013 88 86 90 109 62 68 75 114 63 69 76 116 2011 2012 2013p 2017p Vernacular Hindi English Print media market (INR bn) The Indian print industry is expected to be worth INR 340 bn by 2017
  • 21.
    Advertising and circulationrevenue share 67% 33% In 2012-13(P) (%) Advertising Circulation 73% 27% In 2017 (P) (%) Advertising Circulation Categories 2011 2012 Change over 2011 Auto 9.8 11.4 Education 10.6 10.6 FMCG 8.9 10.3 Real estate & home improvement 8.4 8.6 Clothing/ Fashion/ Jewellery 6.5 7.1 Retail 5.6 5.8 BFSI 6.7 5.7 HH durables 5.7 4.9 Travel & Tourism 2.8 2.3 Corporate 2.8 2.2 Media 1.5 1.4 Alcoholic beverages 0.2 0.1 Others 25.7 25.3 Top categories on print ( by volume ) Source : : FICCI REPORT 2013 In the print industry, the advertisement revenue continues to dominate and grow more in contrast with the growth in the subscription revenue  For the first time in the last 5 years, the education category is not the highest spender in the print medium  While the education sector has maintained it’s share on print advertising at 10.6%, the Auto sector has increased it’s contribution to 11.4% in 2012 as compared to 9.8% in 2011  The next two years will be critical, because of expansion of demand for online print media, with the advertising growth to be largely driven by increases in election spend, advertising driven by the launch of new products, categories expanding due to product and brand launches, launch of new edition, publications catering to niche market
  • 22.
    Publications Language AIR(in ‘000) Dainik Jagran Hindi 16474 Dainik Bhaskar Hindi 14491 Hindustan Hindi 12242 Malayala Manorama Malayalam 9752 Amar Ujala Hindi 8536 The Times of India English 7653 Daily Thanthi Tamil 7417 Lokmat Marathi 7409 Rajasthan Patrika Hindi 6818 Mathrubhumi Malayalam 6415 Magazine Language Q3 2012 Vanitha Malayalam 2271 Pratiyogita Darpan Hindi 1894 SamanyaGyan Darpan Hindi 1733 India Today English 1526 Saras Sahil Hindi 1351 Meri Saheli Hindi 1205 Karmakshetra Hindi 1183 Malayala Manorama Malayalam 1053 General Knowledge Today English 1047 Cricket Samrat Hindi 1044 Key Players in the Indian print industry are subdivided into two categories (Newspaper dailies and Magazines) Source : : FICCI REPORT 2013 Average Readership (AIR) of top 10 dailies
  • 23.
    Key Growth Drivers Recognizingthe potential of rural India, i9 media launched ‘Rural Marketing’ magazine with a focus on highlighting the finer points of the rural bases, which go unnoticed by mainstream India. Regionalisaton or the tapping the potential growth of Hindi and Vernacular markets. Rising literacy, growth in disposable income, brand consciousness and strong commercial development in tier II and tier III cities. The resurgence in advertising, growth in subscription revenues, thrust on digitization, and emerging avenues for content monetization To compete with the imported newsprint, domestic newsprint manufacturing companies are not able to increase prices leading to tremendous financial pressure and no incentive for any manufacturer to add to existing capacity. Availability of talent remains a challenge for the print industry. There are very few quality oriented journalism schools in India and very few students choose this career as a first preference. India’s literate population base of 895 Mn provides a huge target audience to print companies. However on an average 44% of the Indian population does not read any publication. Challenges Monetisation of online media (print) channels to optimize performance in the long run and harness bigger revenues. Recognizing the key growth drivers and challenges in the Indian print Industry Source : : FICCI REPORT 2013 Recognizing the potential of rural India, i9 media launched ‘Rural Marketing’ magazine with a focus on highlighting the finer points of the rural bases, which go unnoticed by mainstream India.
  • 24.
    Global comparisons onthe basis of online newspaper reading behaviour 66.9 39.1 43.2 33 43.5 35.4 Users that ever visit a site (%) USA Brazil Germany Russia France India 17.1 8.5 11.7 7.4 11.6 9.9 Users that visit a paper site daily (%) USA Brazil Germany Russia France India 1.1 0.6 1.9 0.5 1.6 2.1 % of pages viewed per user USA Brazil Germany Russia France India • In marked contrast to the global trends, the Indian print industry is growing with steady increase in both advertising and circulation revenues • Although, the internet broadband penetration has been increasing at an enormous pace, current penetration levels are too low to pose a significant threat to the offline print industry • Online reading behaviour indicates that only 35.4 % of the Indian who ever use the internet, visit newspaper websites and only 9.9% of daily web users turn to their newspaper website daily. This is substantially low when compared to countries such as USA and France • Although, several print media houses have moved to online channels, they are usually slow to adapt or monetise their content effectively • For instance, HT Media’s digital segment witnessed an 18 percent increase in revenues from its digital segment to INR 138 million from INR 117 million in Q3FY13 as compared to Q3FY12. HT Mobile registered a 40 percent growth over Q3 FY12 • Due to technological advancements and growing user needs, content today is highly interactive, easily distributable to its users at low cost and is real time. However, monetising digitised content online is another industry challenge Source : : FICCI REPORT 2013 Key Insights