Downloaded 119 times
![REFERENCES
[1] Dolores R. Wallace, D. Richard Kuhn, “Failure Modes In Medical Device Software:An
Analysis Of 15 Years Of Recall Data” , 2001
[2] S.Shirasaka, Y.Sakai, Y.Nishi, “Feature Analysis of Estimated Causes of Failures in Medical
Device Software and Proposal of Effective Measures” , ISSRE 2011,
[3] ISO 14971:2007 Medical devices - Application of risk management to medical devices
[4] ISO 26262-1:2011 Road vehicles - Functional safety - Part 1: Vocabulary
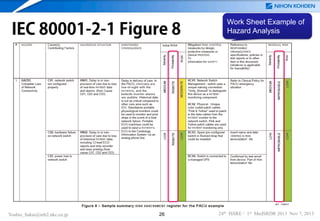
[5] IEC/TR 80001-2-1 Application of risk management for IT-networks incorporating medical
devices – Part 2-1: Step-by-step risk management of medical IT-networks – practical
applications and examples
[6] IEC 62304:2006 Medical device software - Software life cycle processes
[7] “Katerina Goseva-Popstojanova, Ahmed Hassan, Ajith Guedem, Walid Abdelmoez, Diaa Eldin
M. Nassar, Hany Ammar, Ali Mili, “Architectural-Level Risk Analysis Using UML”, IEEE
TRANSACTIONS ON SOFTWARE ENGINEERING, VOL. 29 NO. 10 OCTOBER 2003
[8] Sherif M. Yacoub, Hany H. Ammar, “A Methodology for Architecture-Level Reliability Risk
Analysis”, IEEE TRANSACTIONS ON SOFTWARE ENGINEERING VOL. 28 NO. 6 JUNE
2002
Yoshio_Sakai@mb2.nkc.co.jp
23
24th ISSRE / 1st MedSRDR 2013 Nov 7, 2013](https://image.slidesharecdn.com/medsrdr2013ftaforsoftwarepresentaionv58a-131110013747-phpapp01/85/An-Extended-Notation-of-FTA-for-Risk-Assessment-of-Software-intensive-Medical-Devices-23-320.jpg)
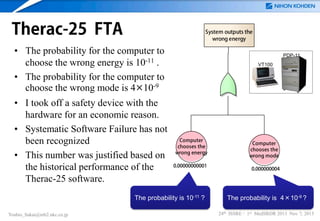
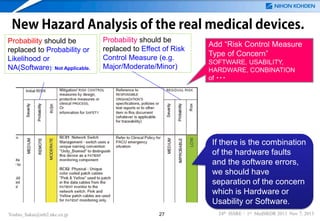
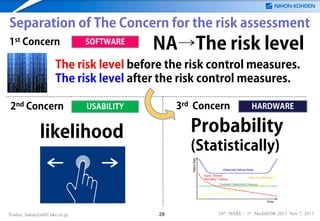
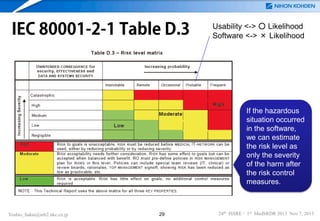
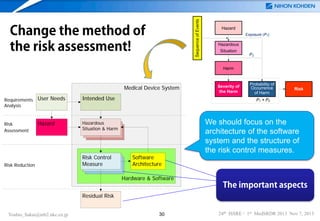
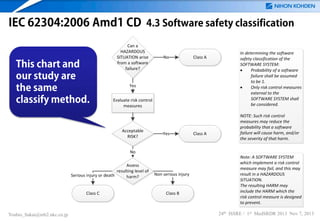
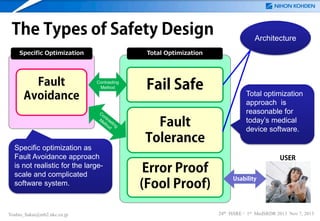
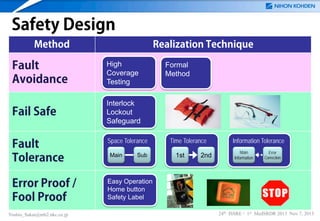
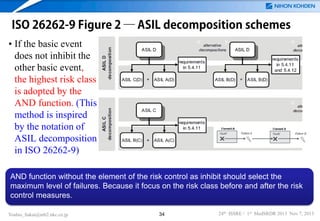

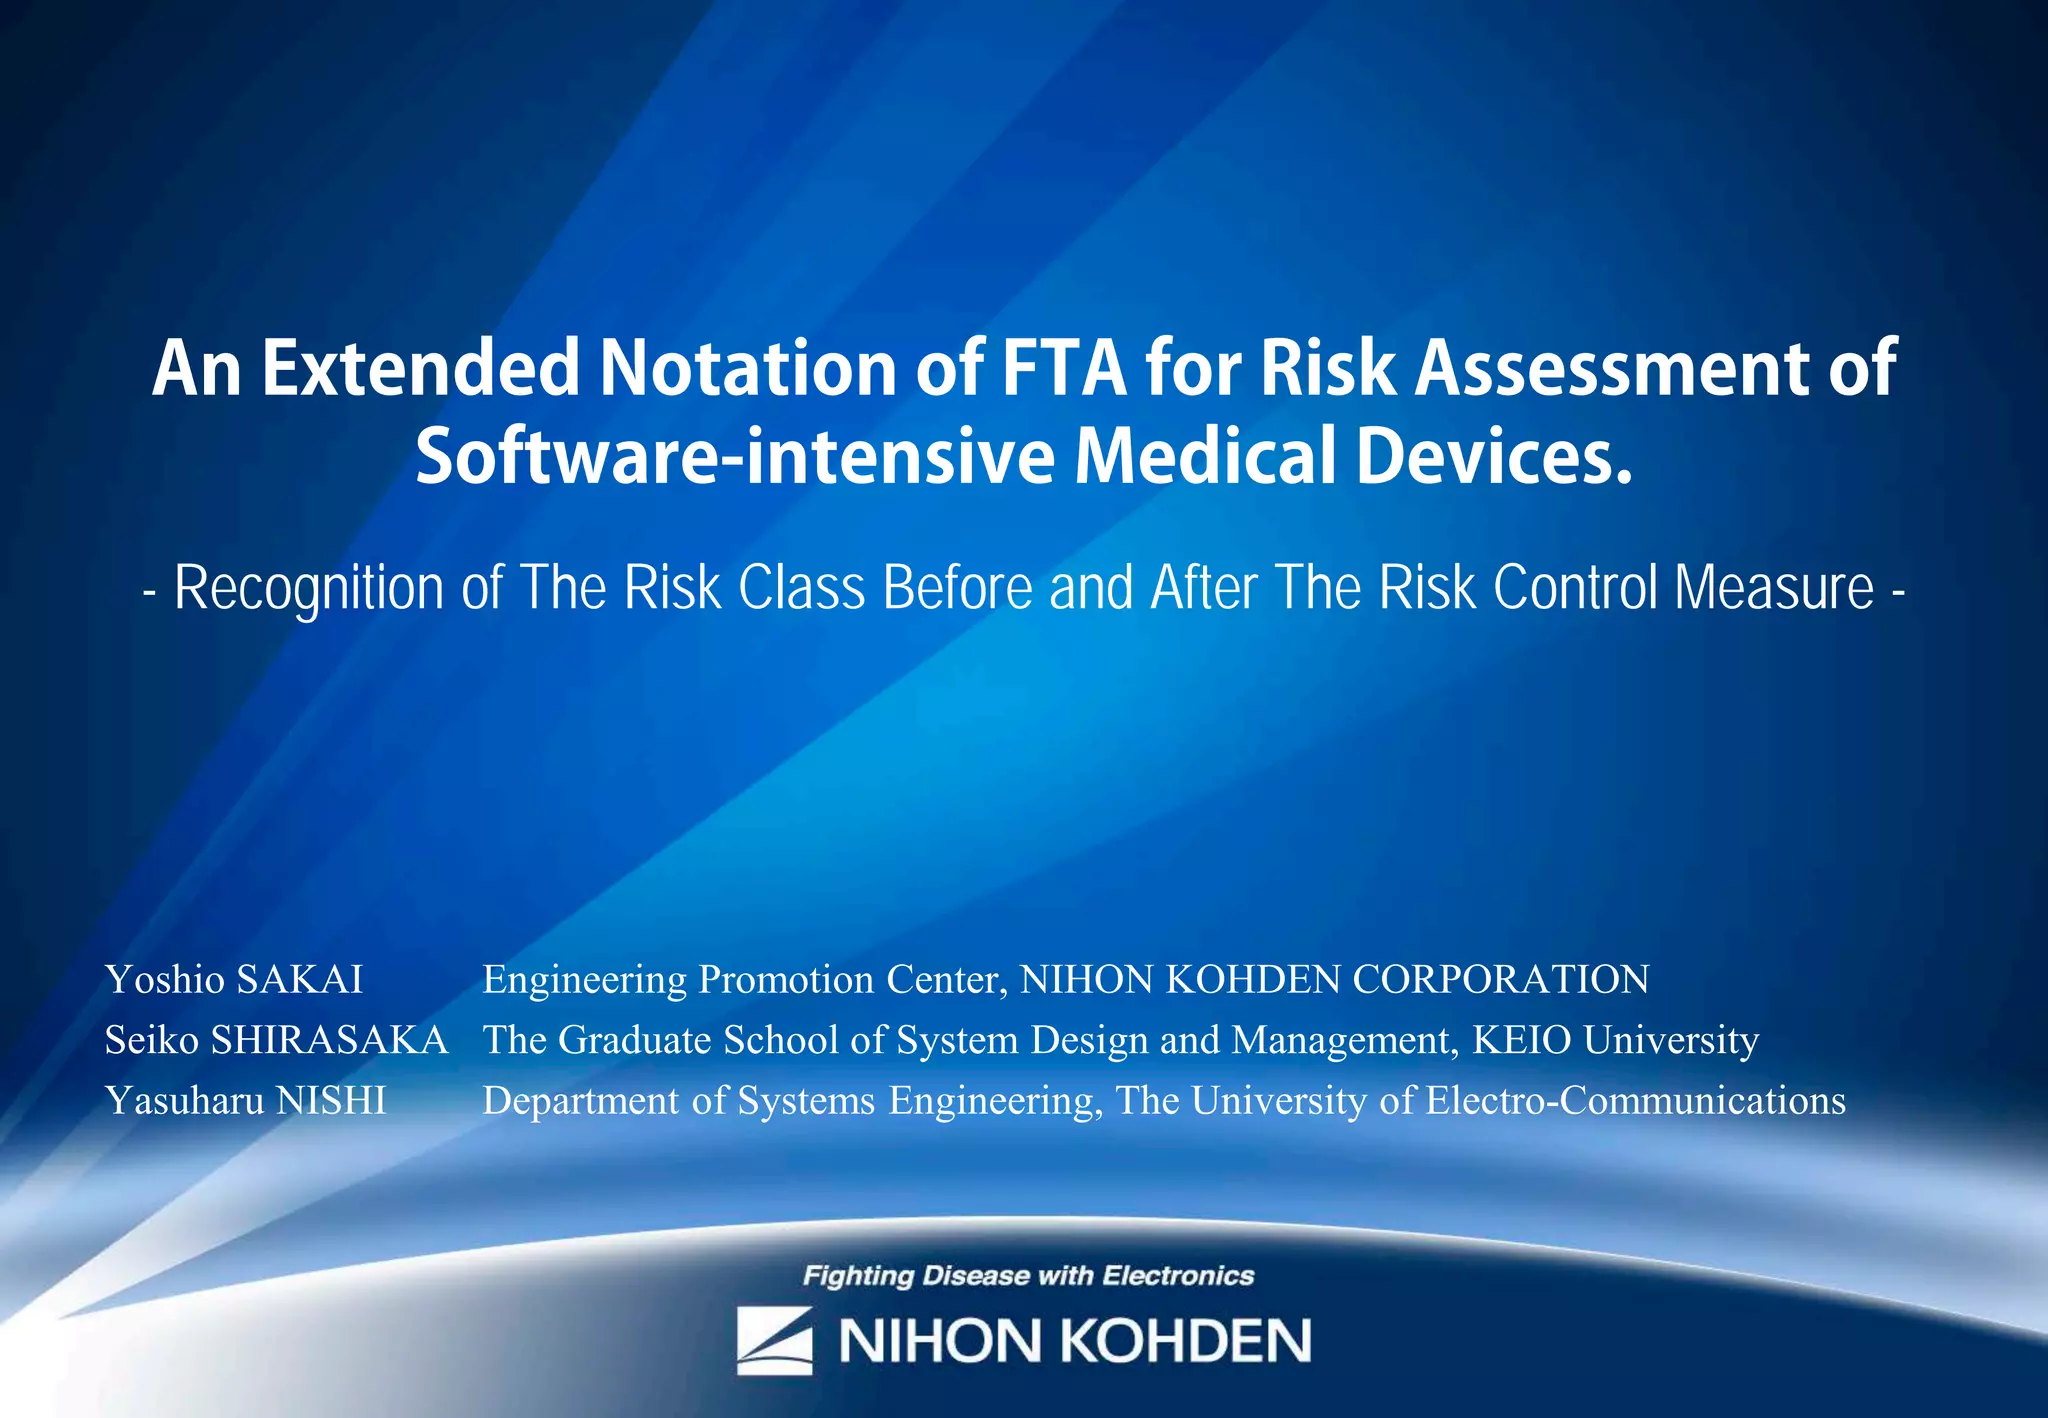
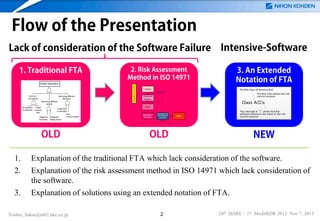
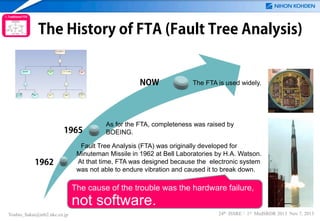
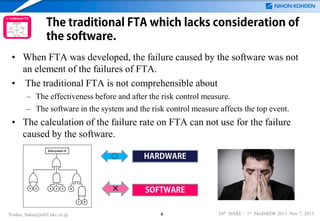
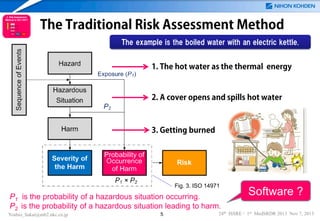
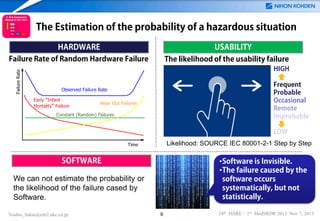
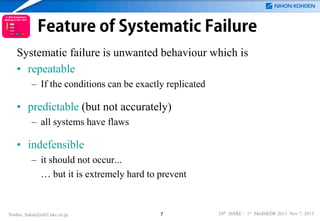
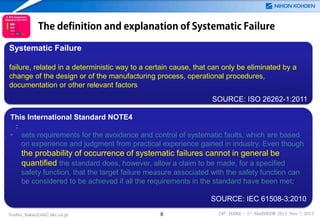
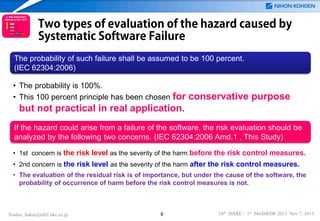
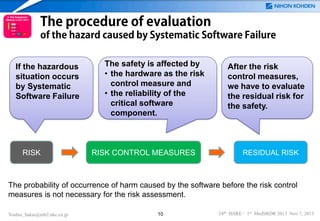
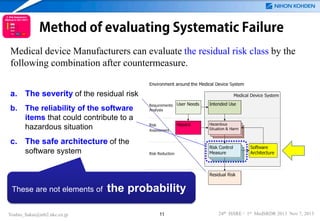
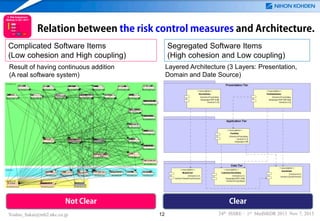
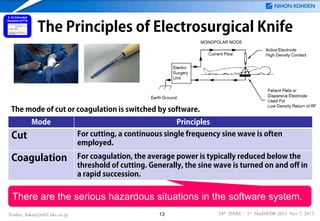
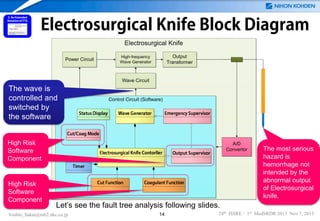
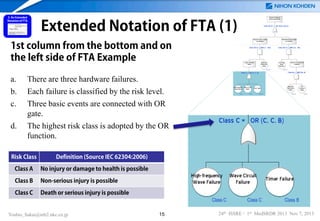
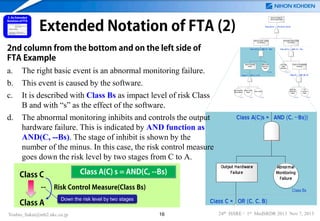
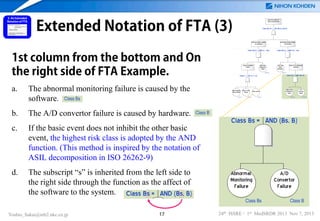
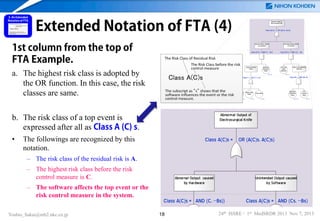
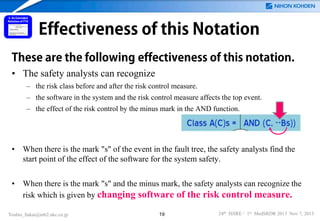
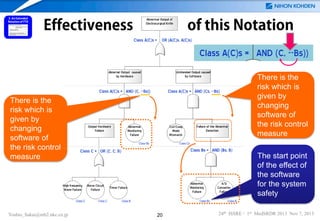
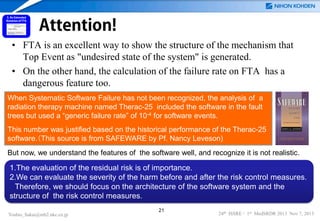
The document discusses an extended notation of Fault Tree Analysis (FTA) for assessing risks in software-intensive medical devices, particularly highlighting the inadequacies of traditional FTA methods that overlook software-related failures. It emphasizes the significance of evaluating the effectiveness of risk control measures and understanding systematic failures that may arise from software. The presentation concludes by advocating for this advanced notation in the development of medical devices to enhance safety assessments.