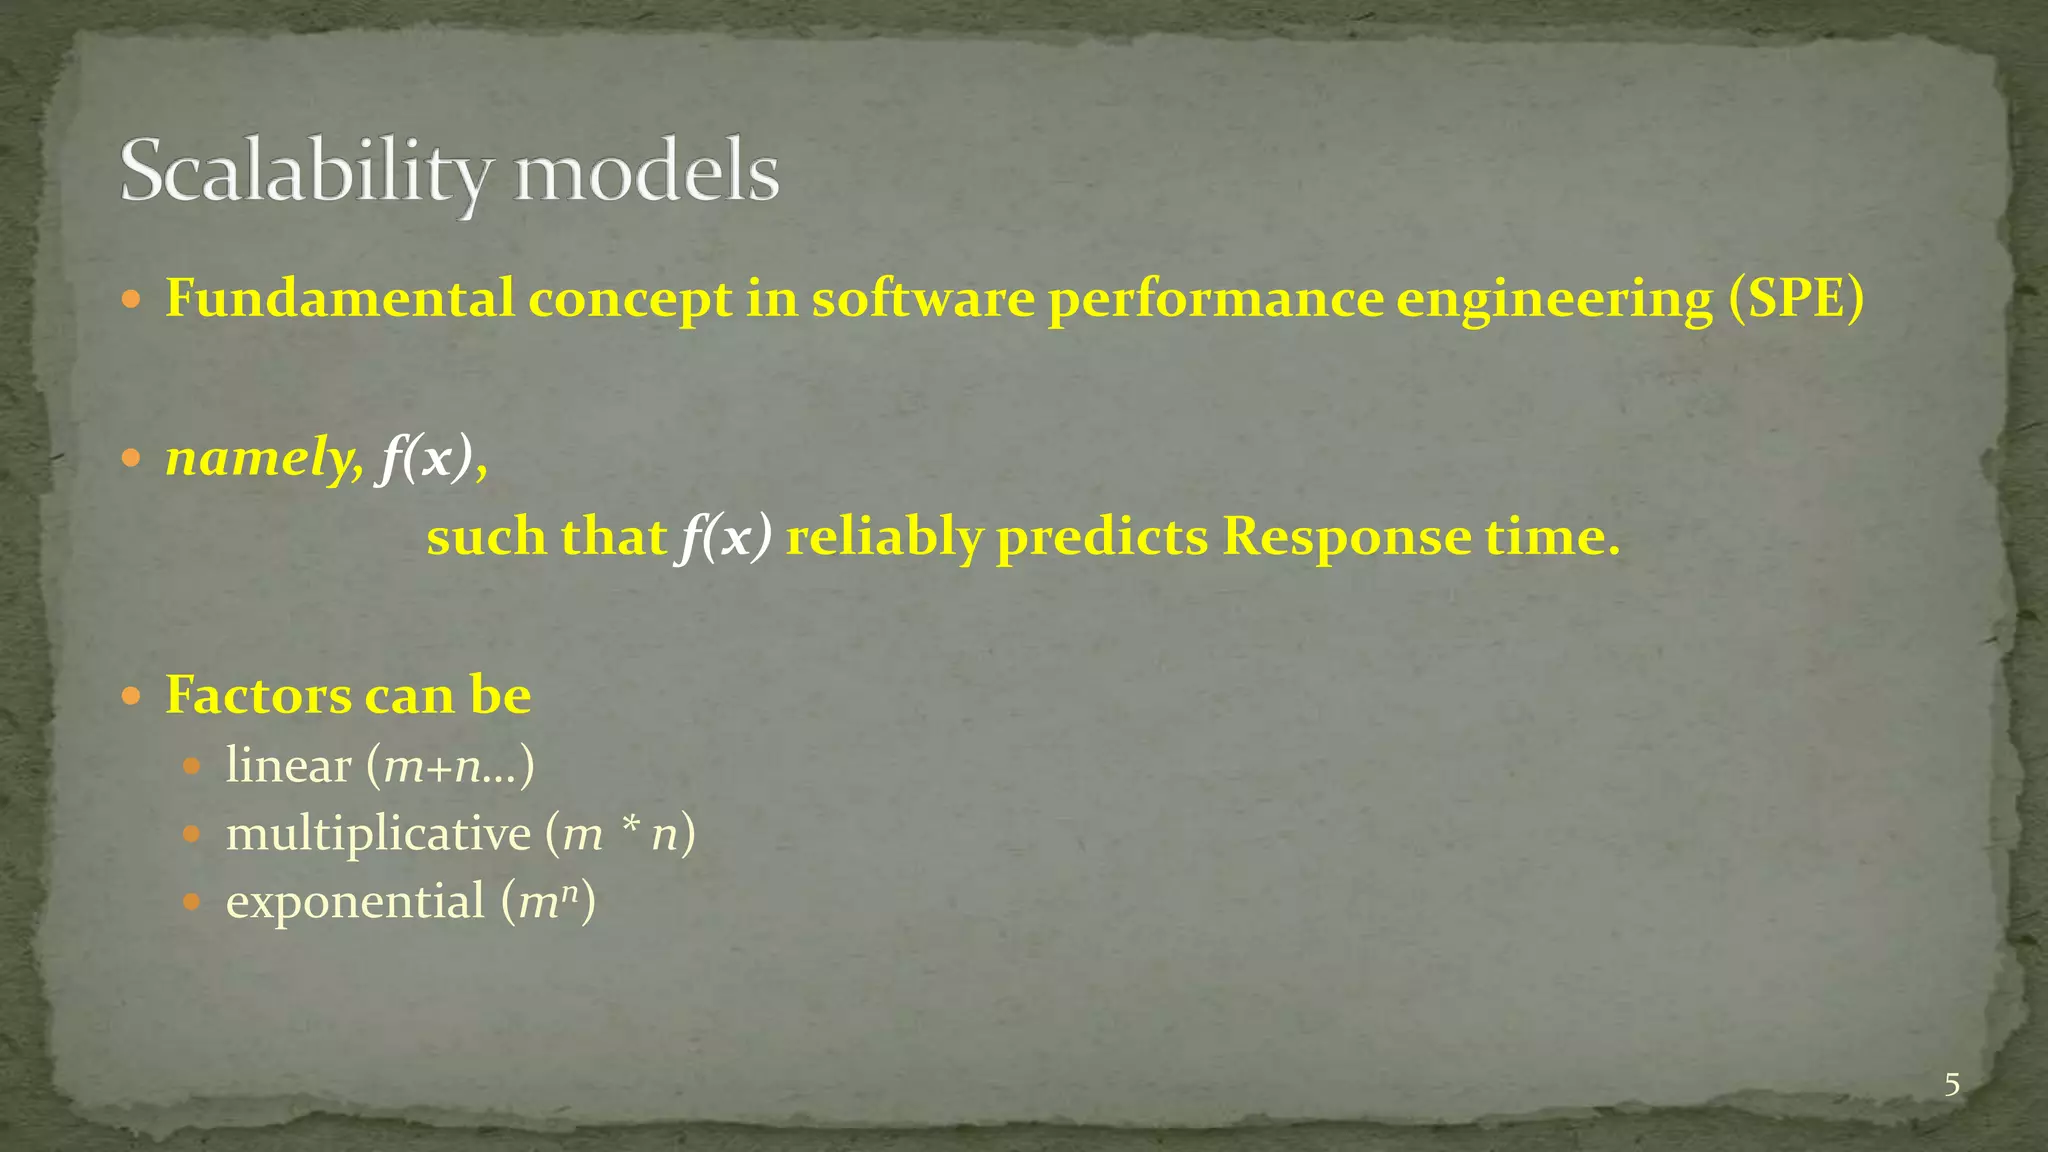
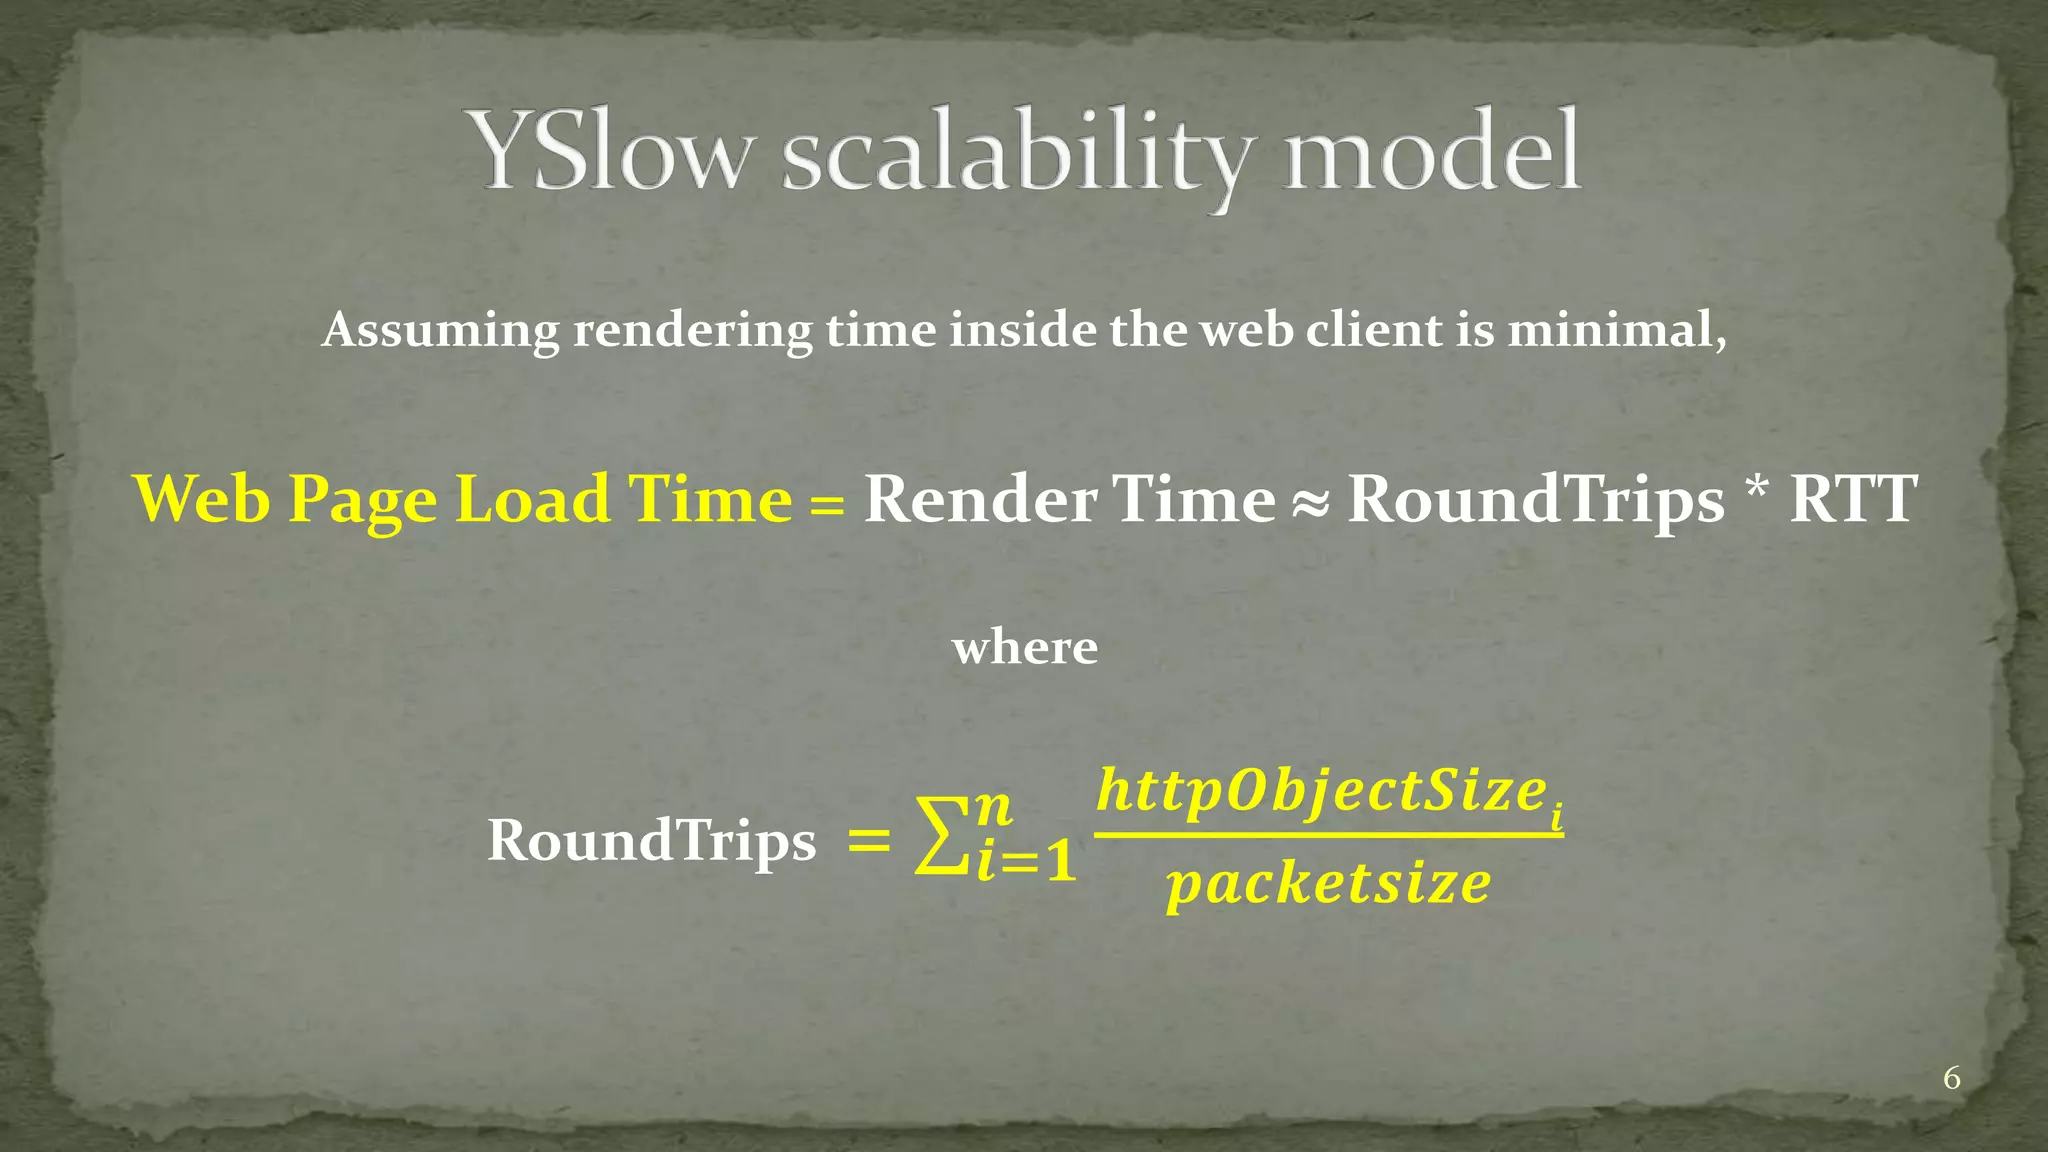
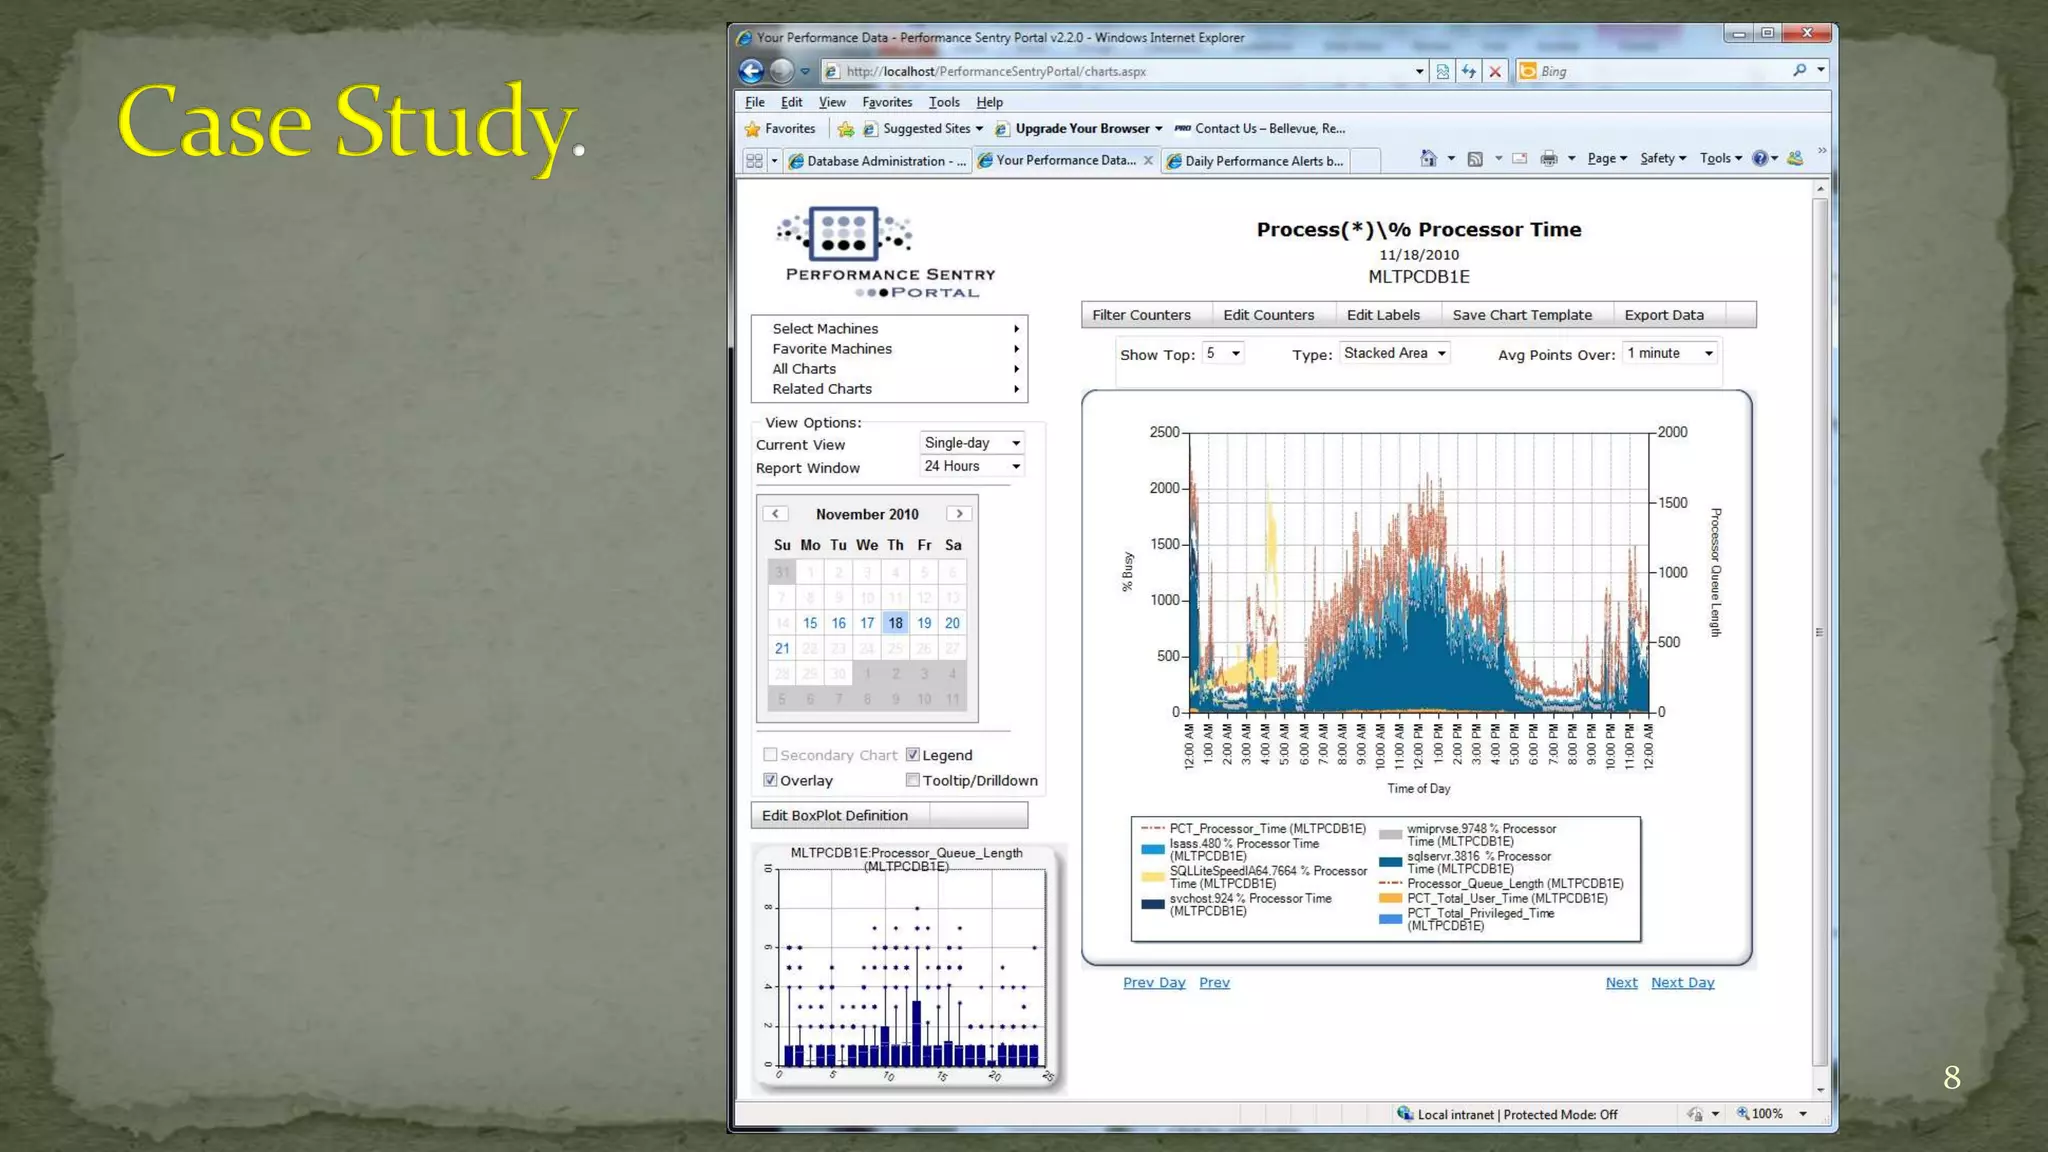
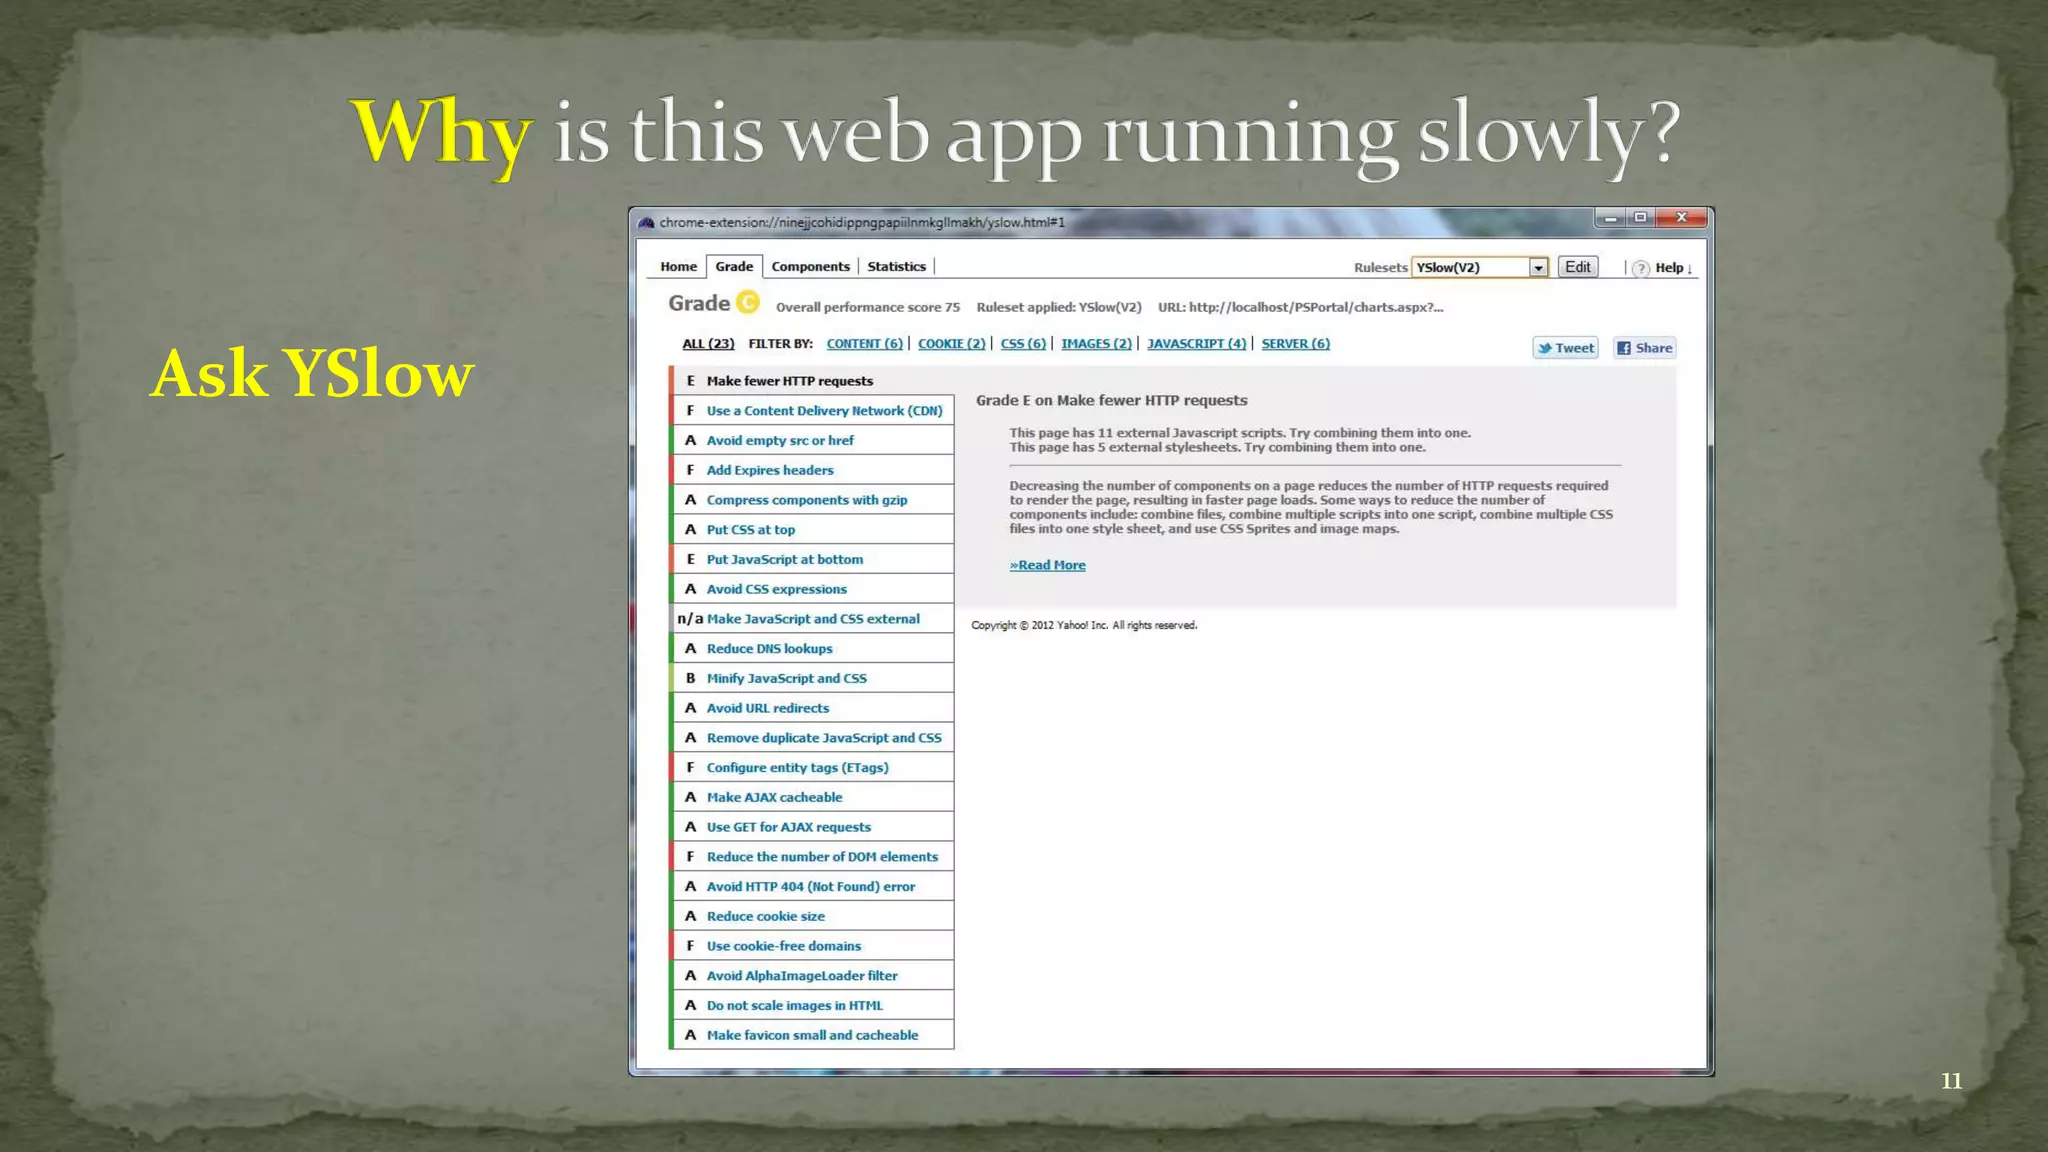
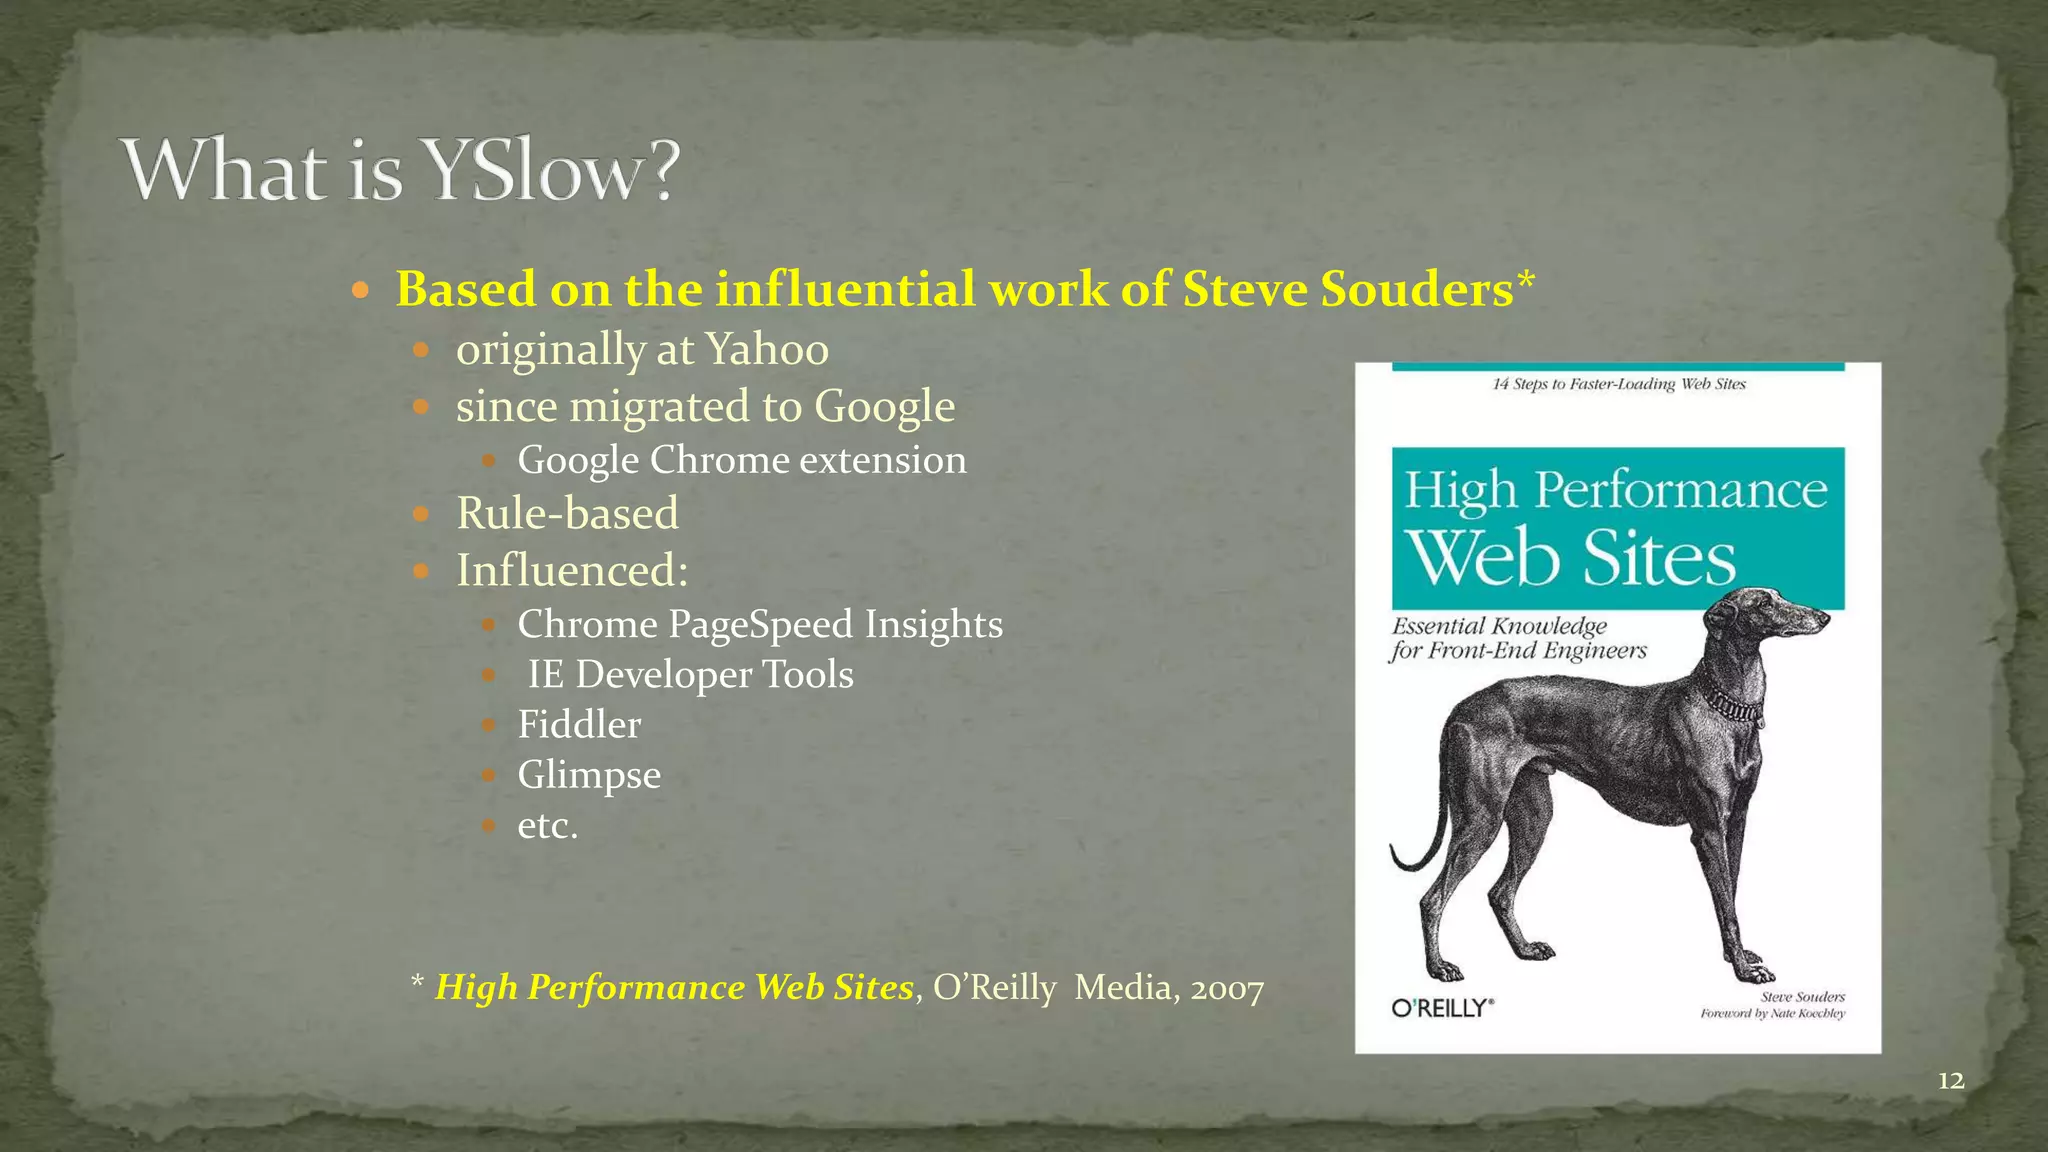
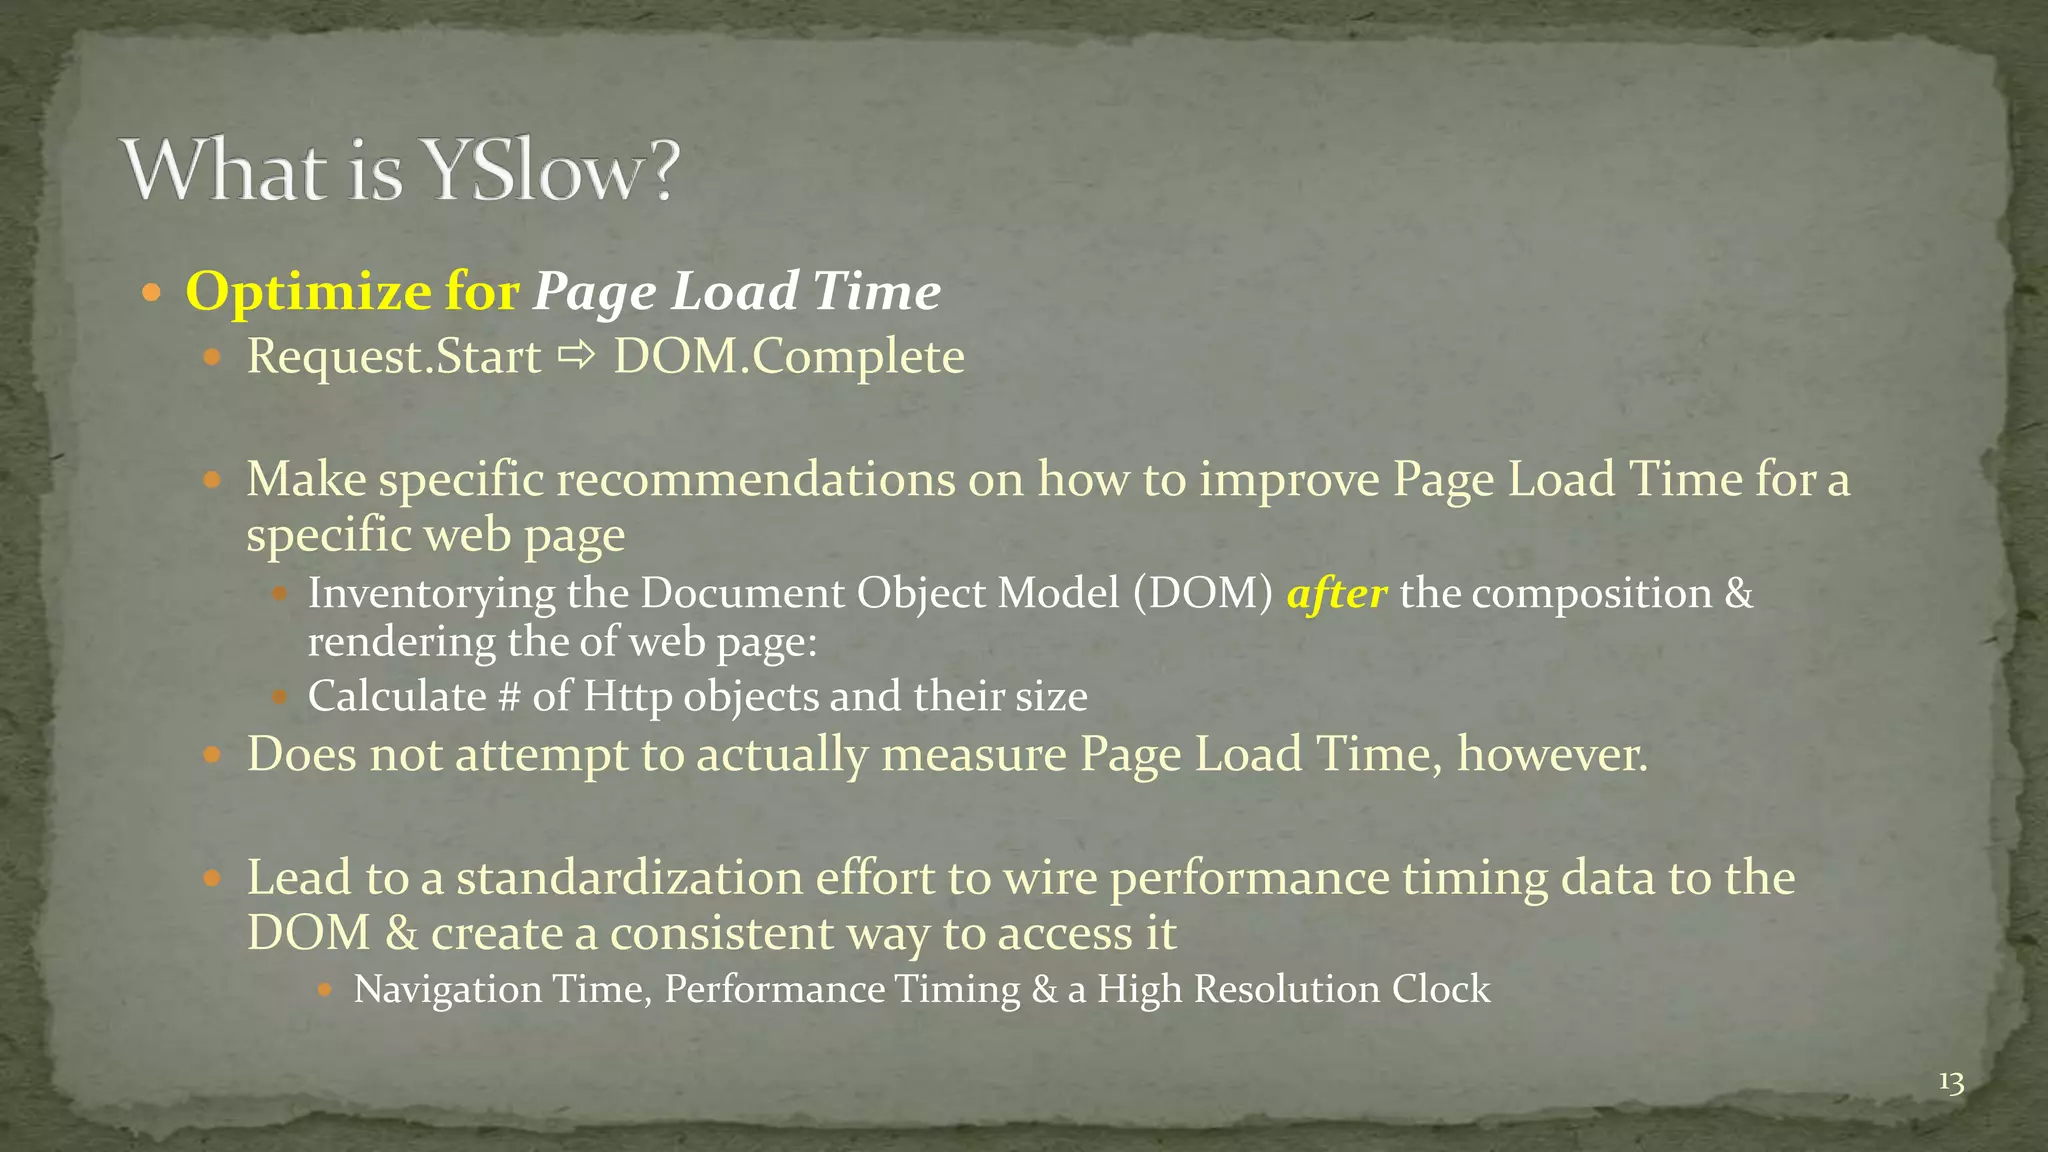
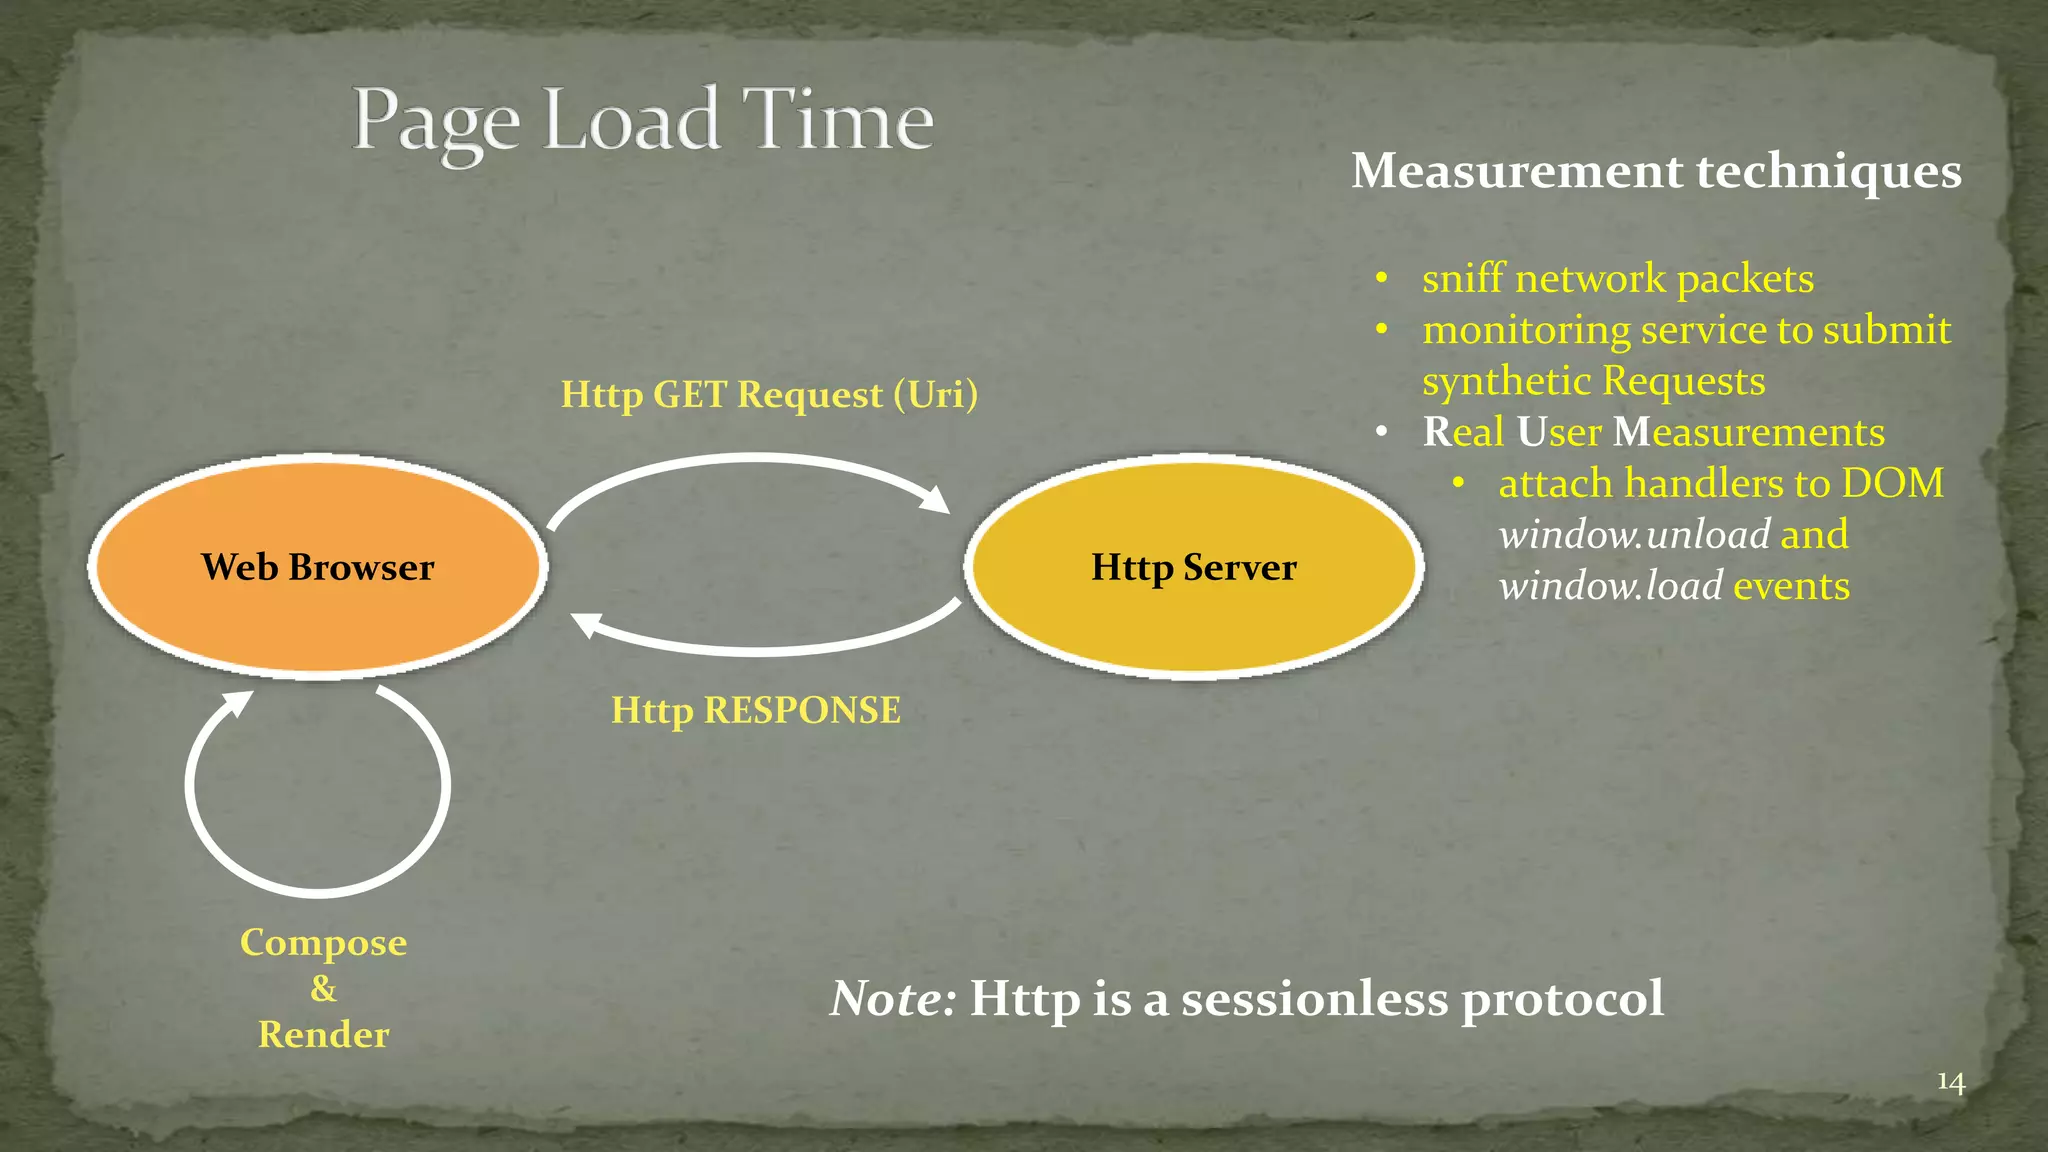
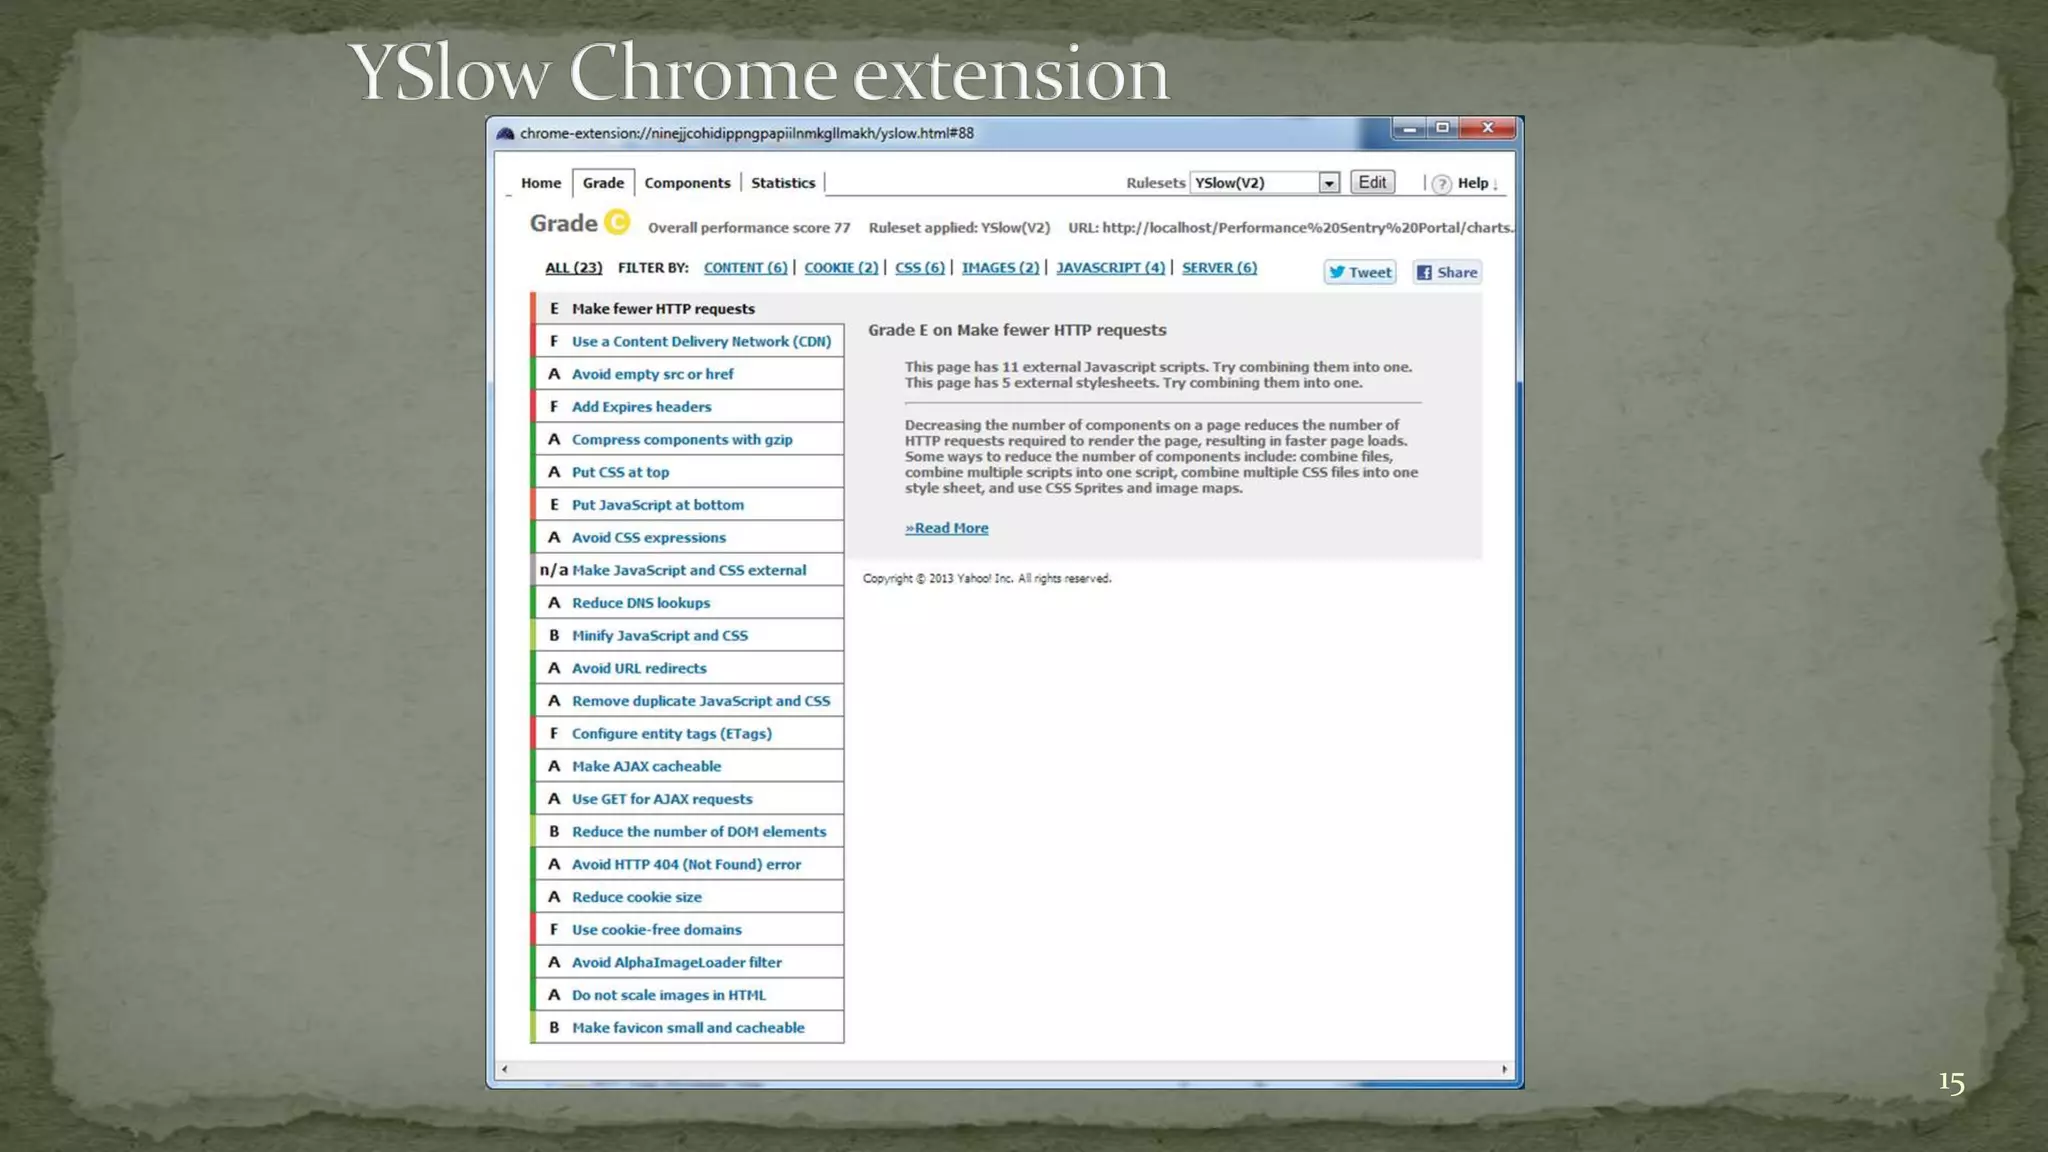
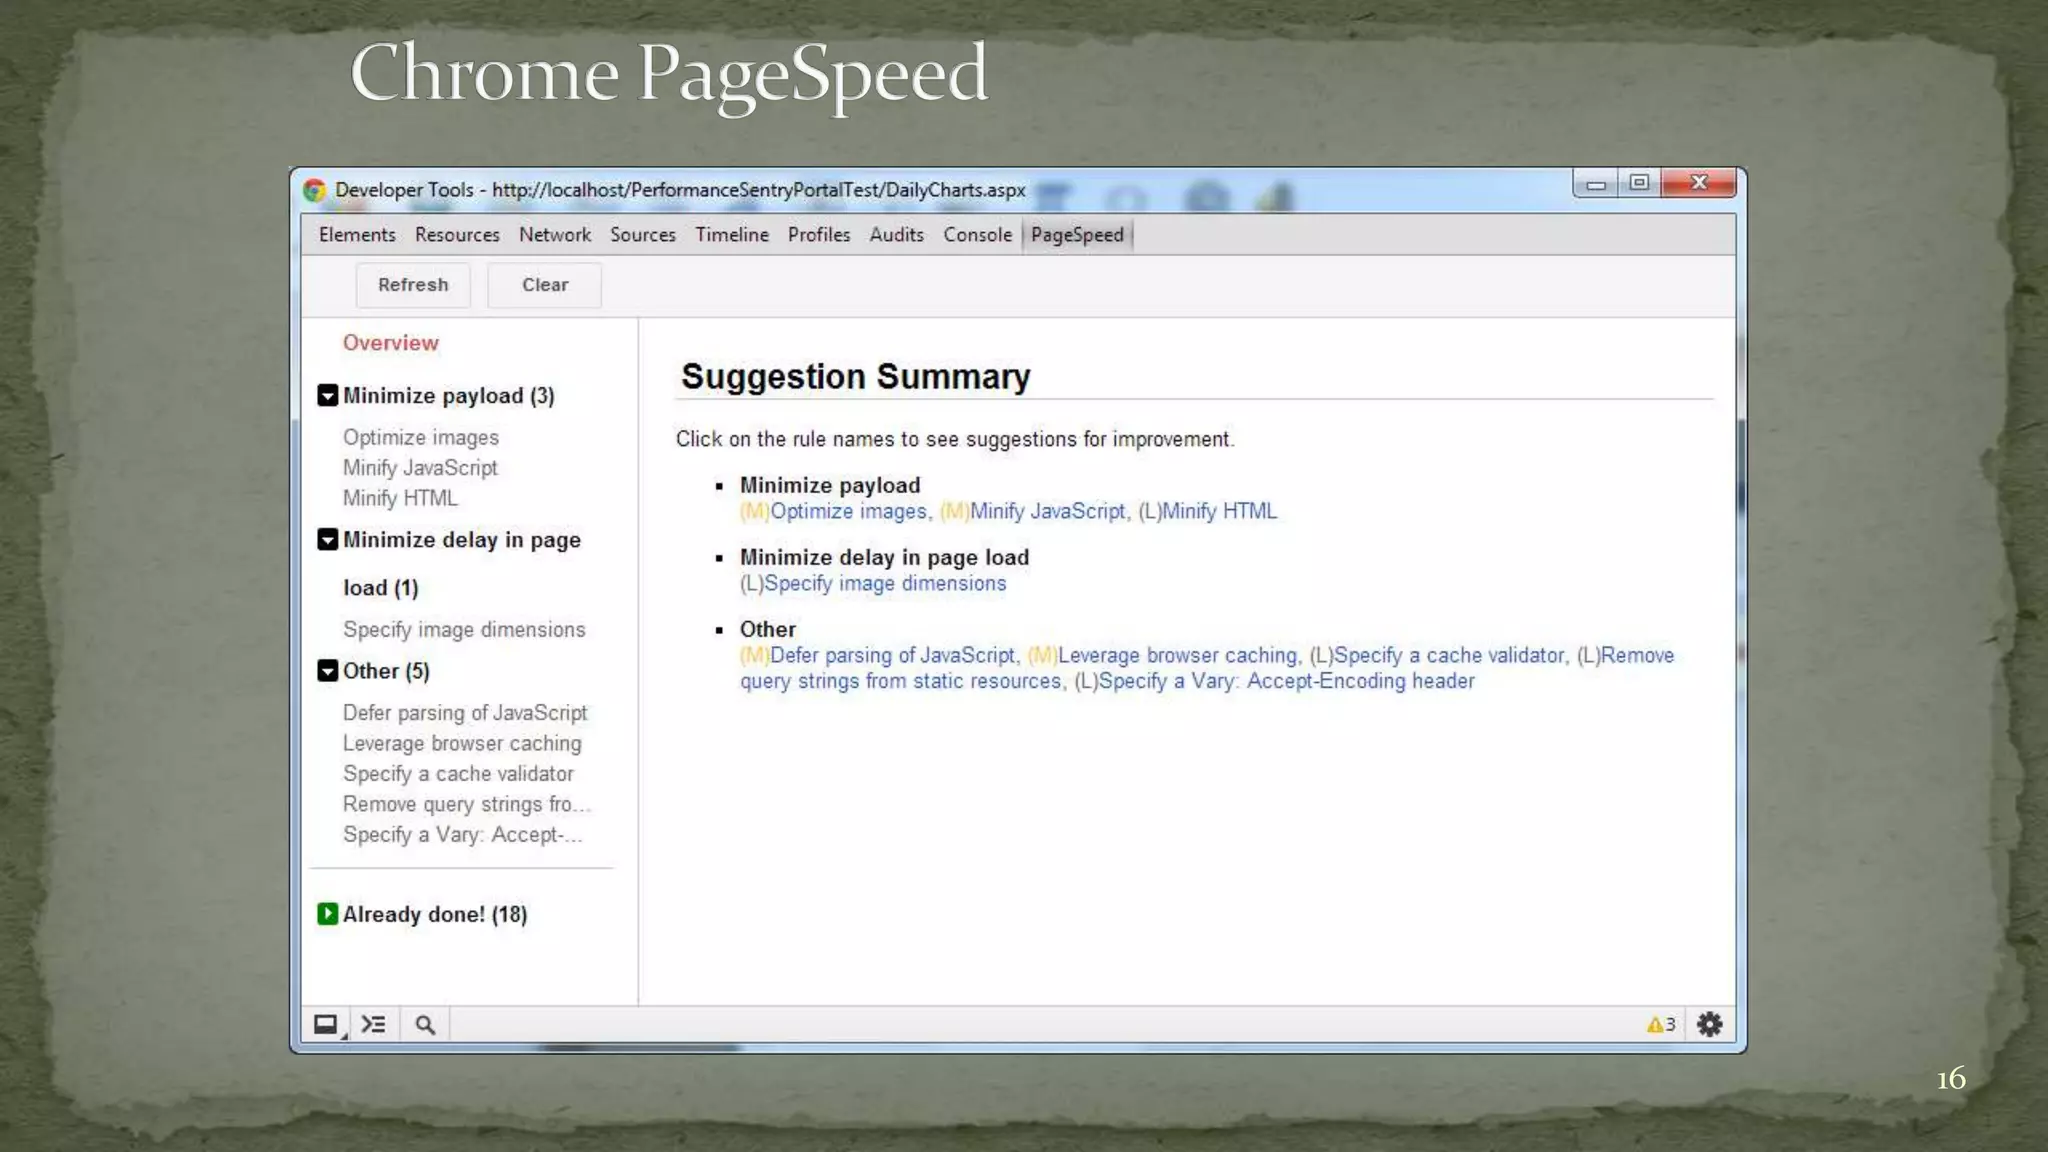
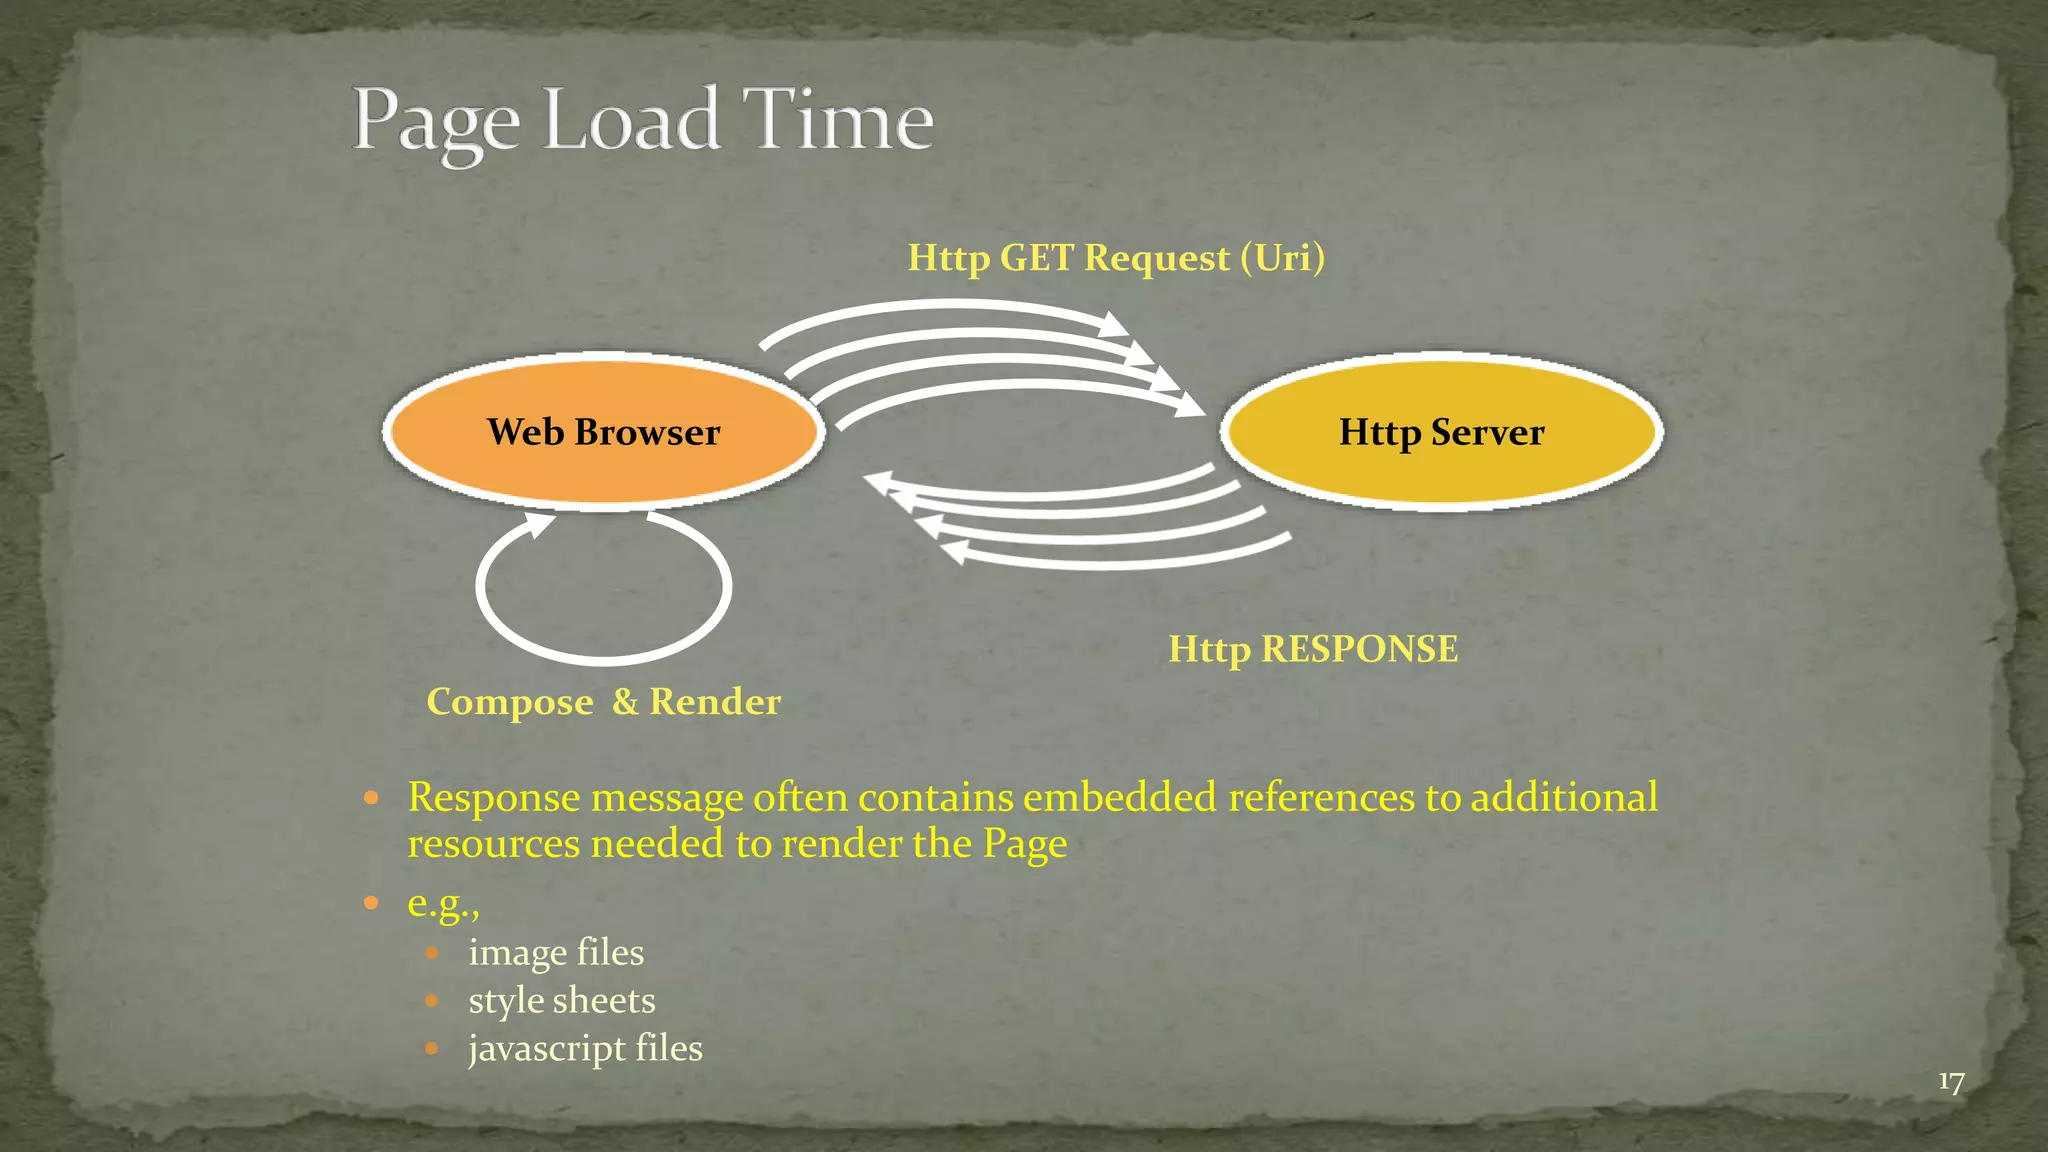
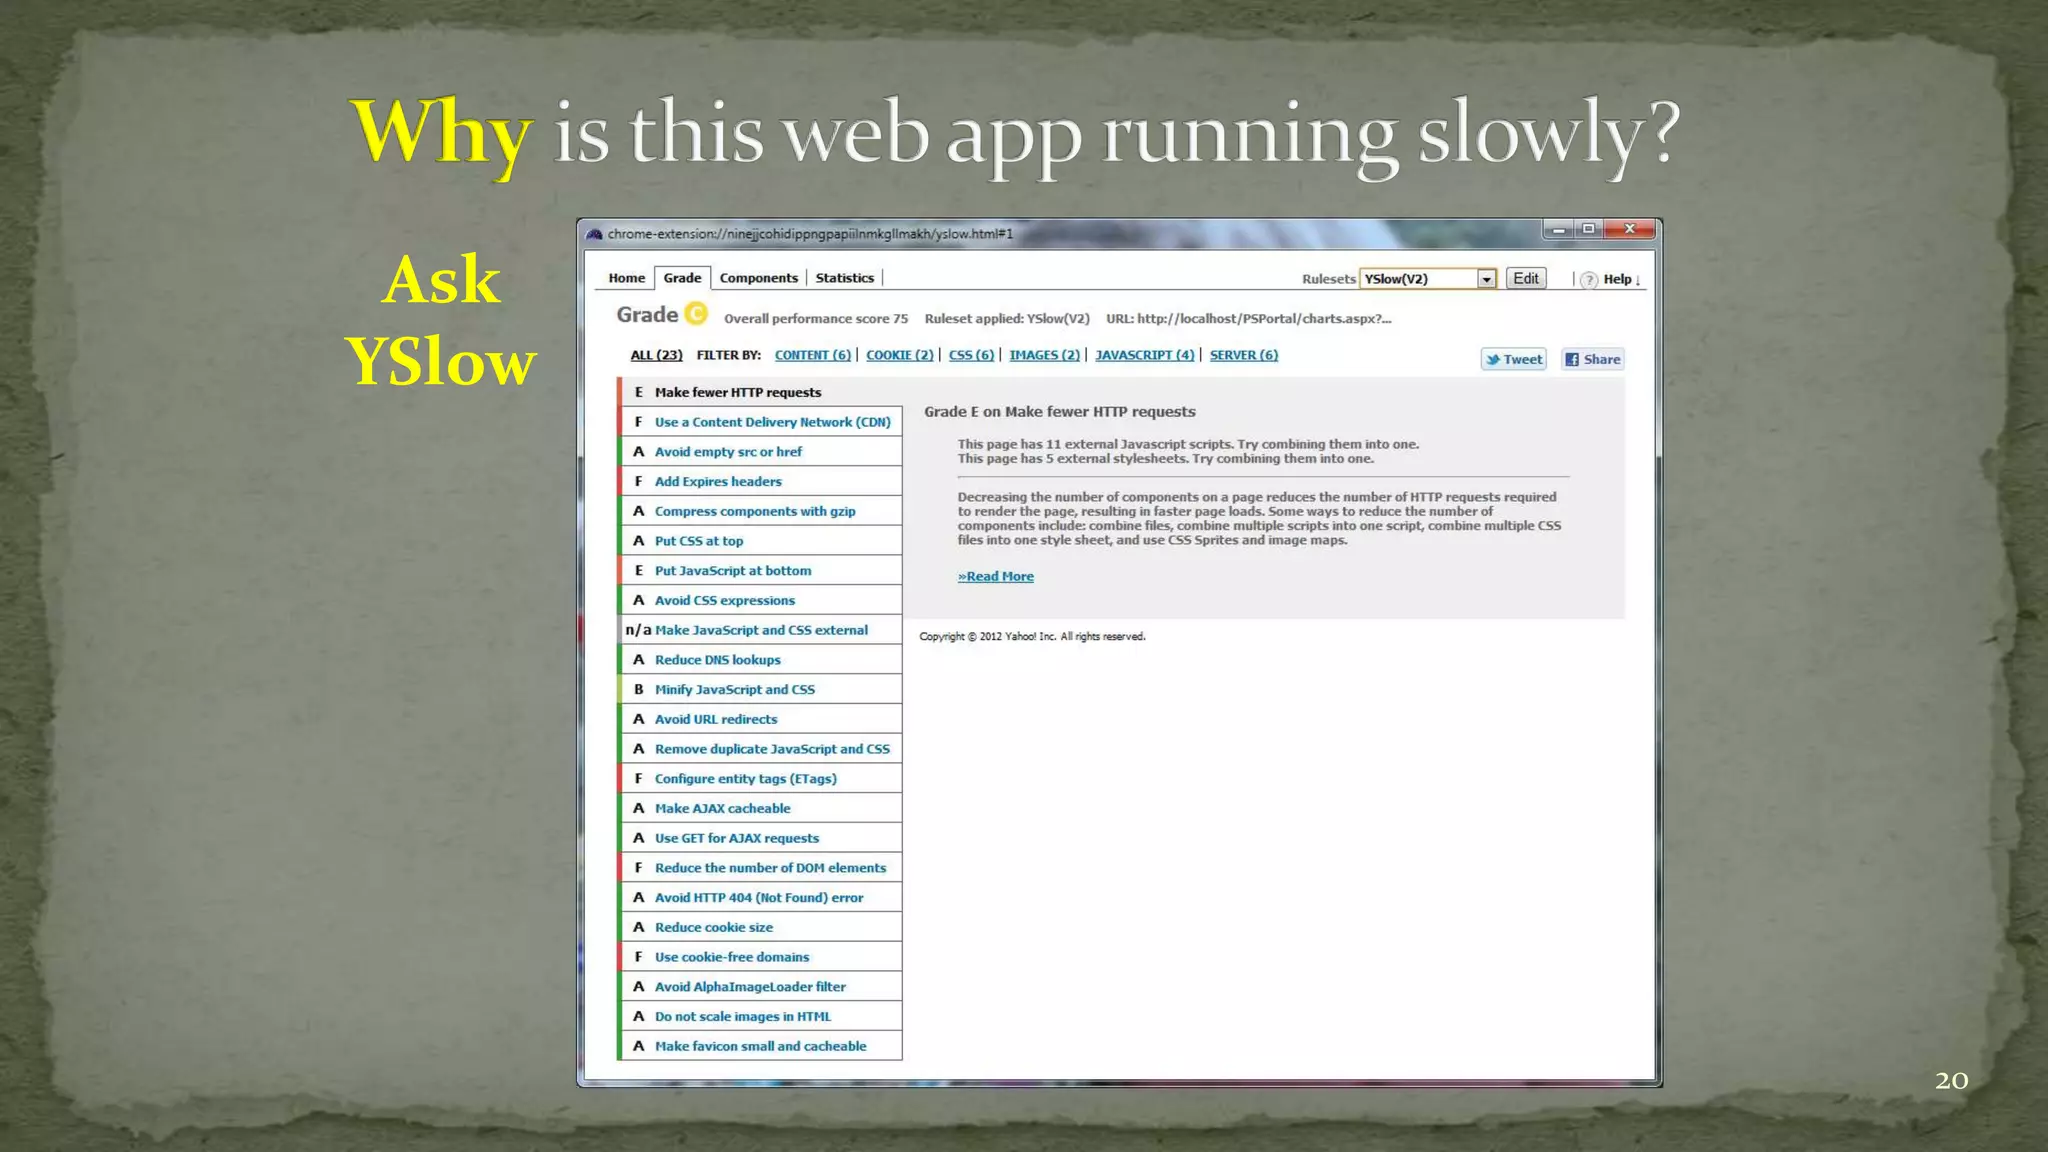
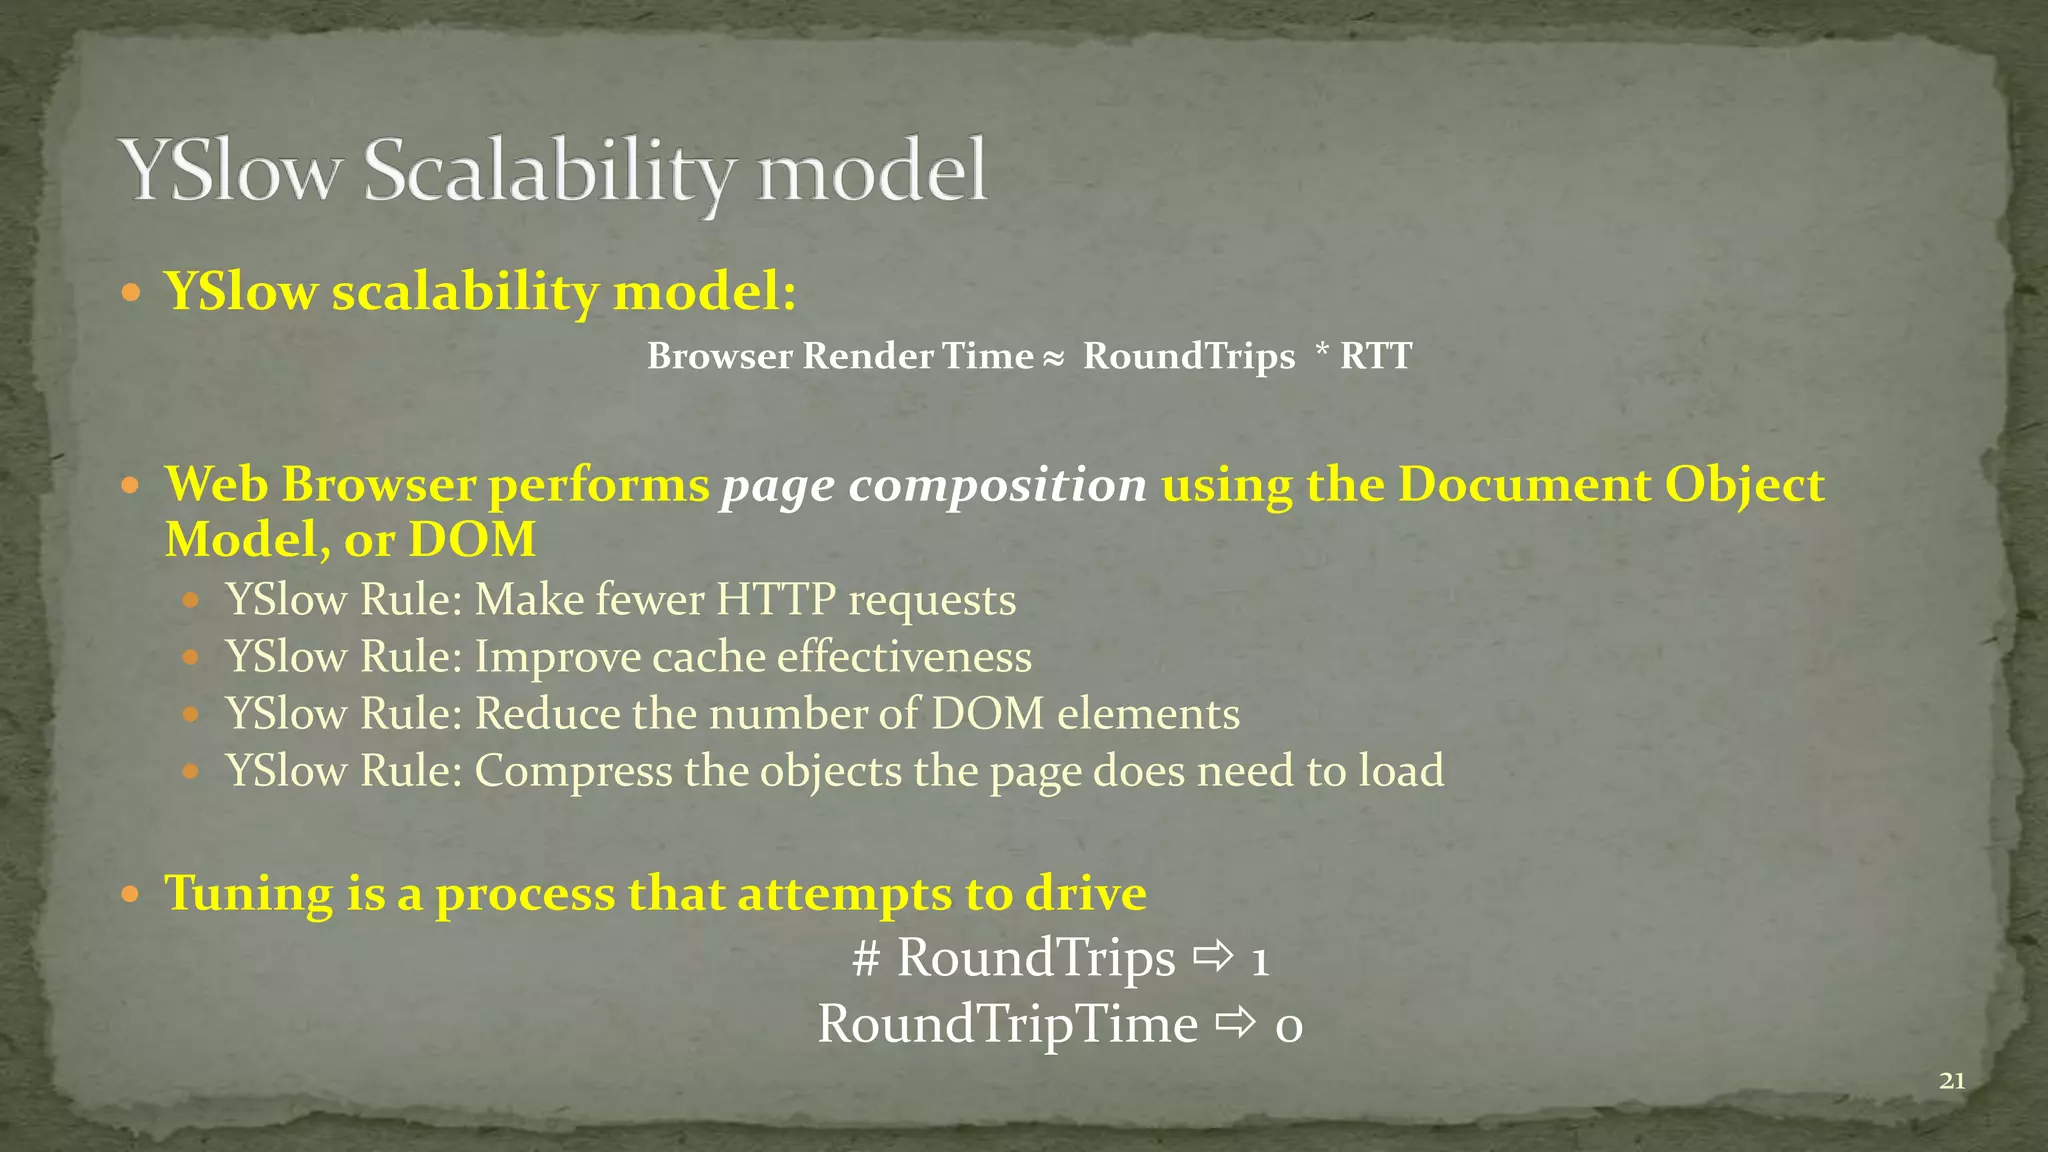
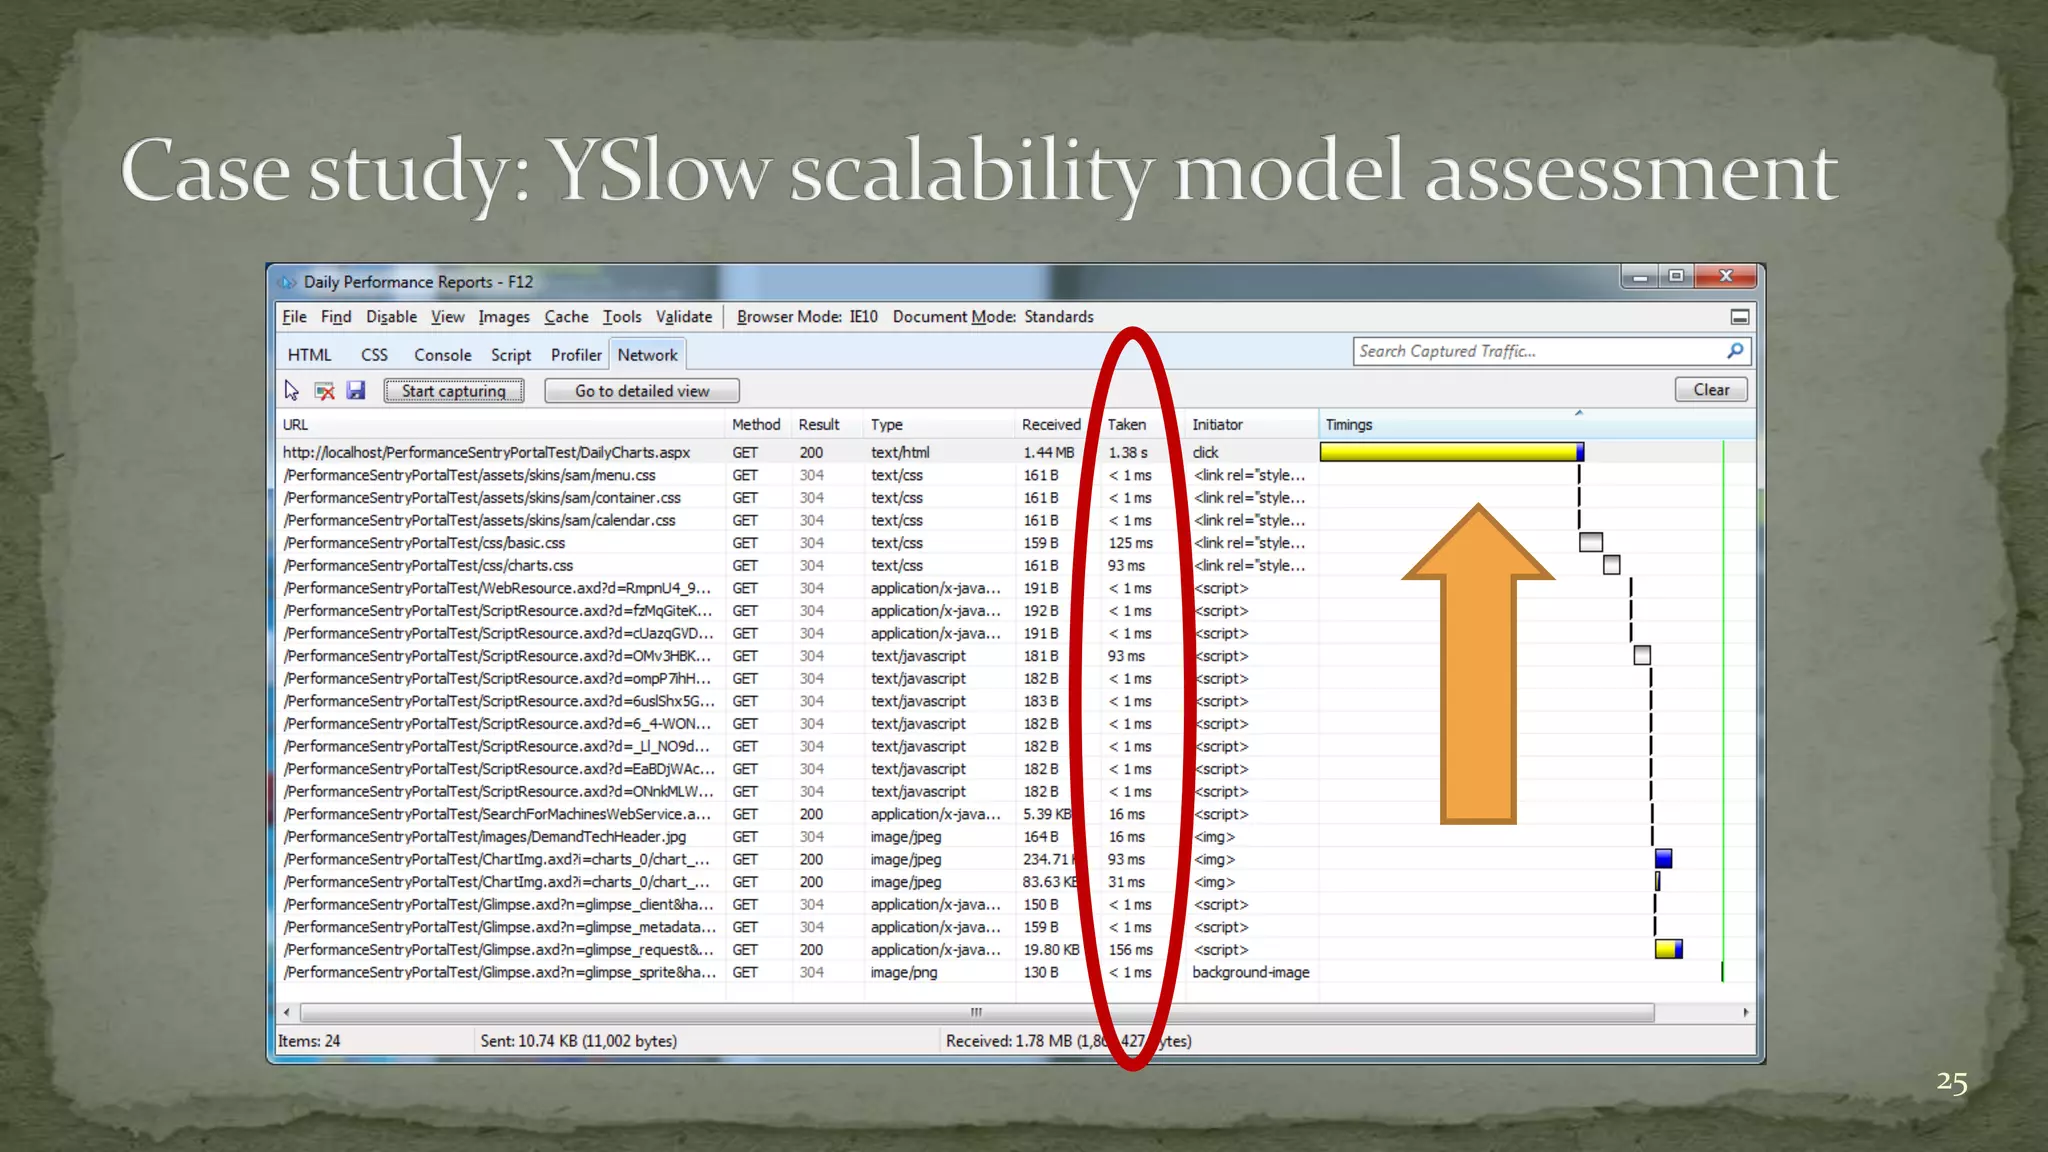
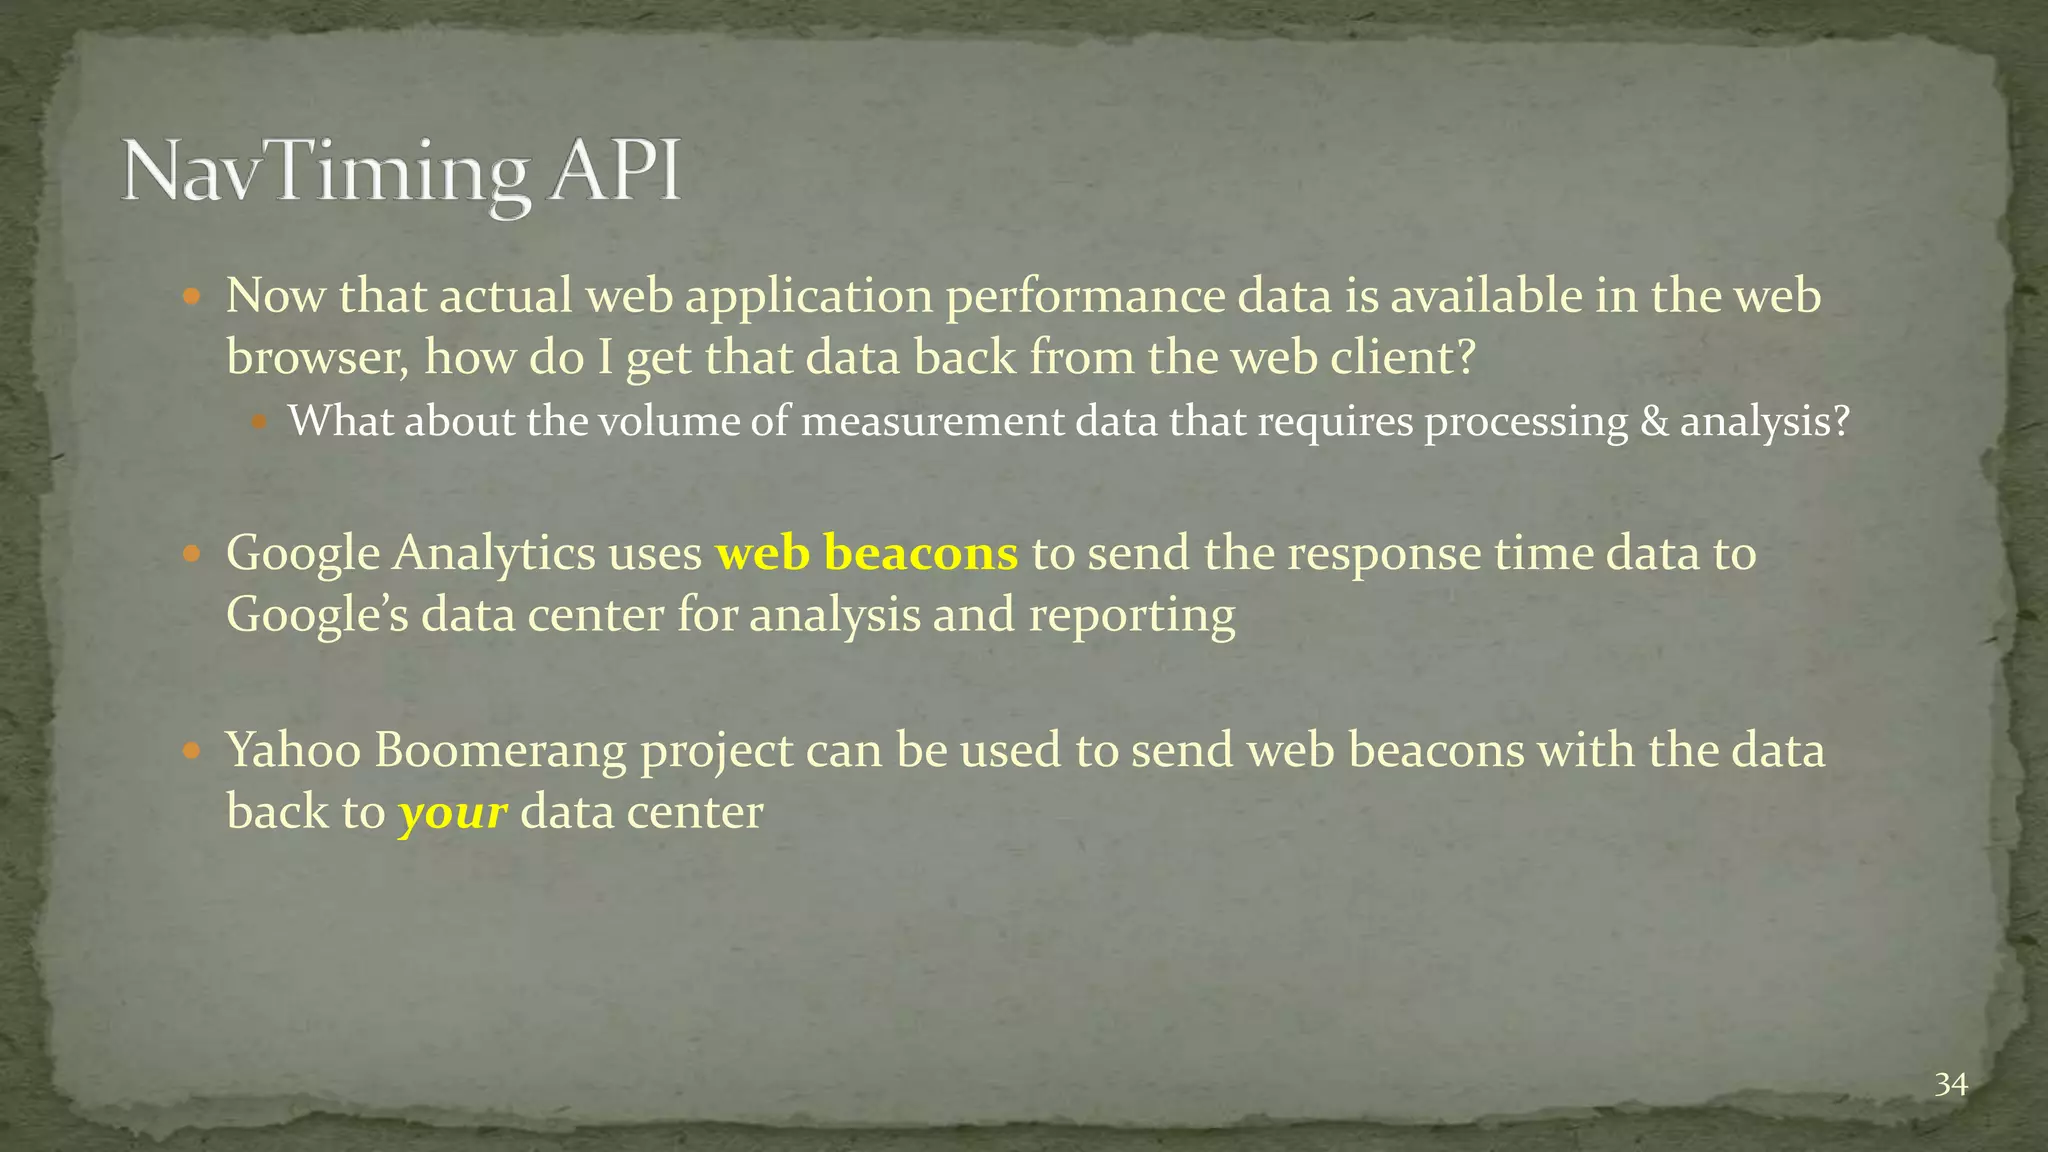
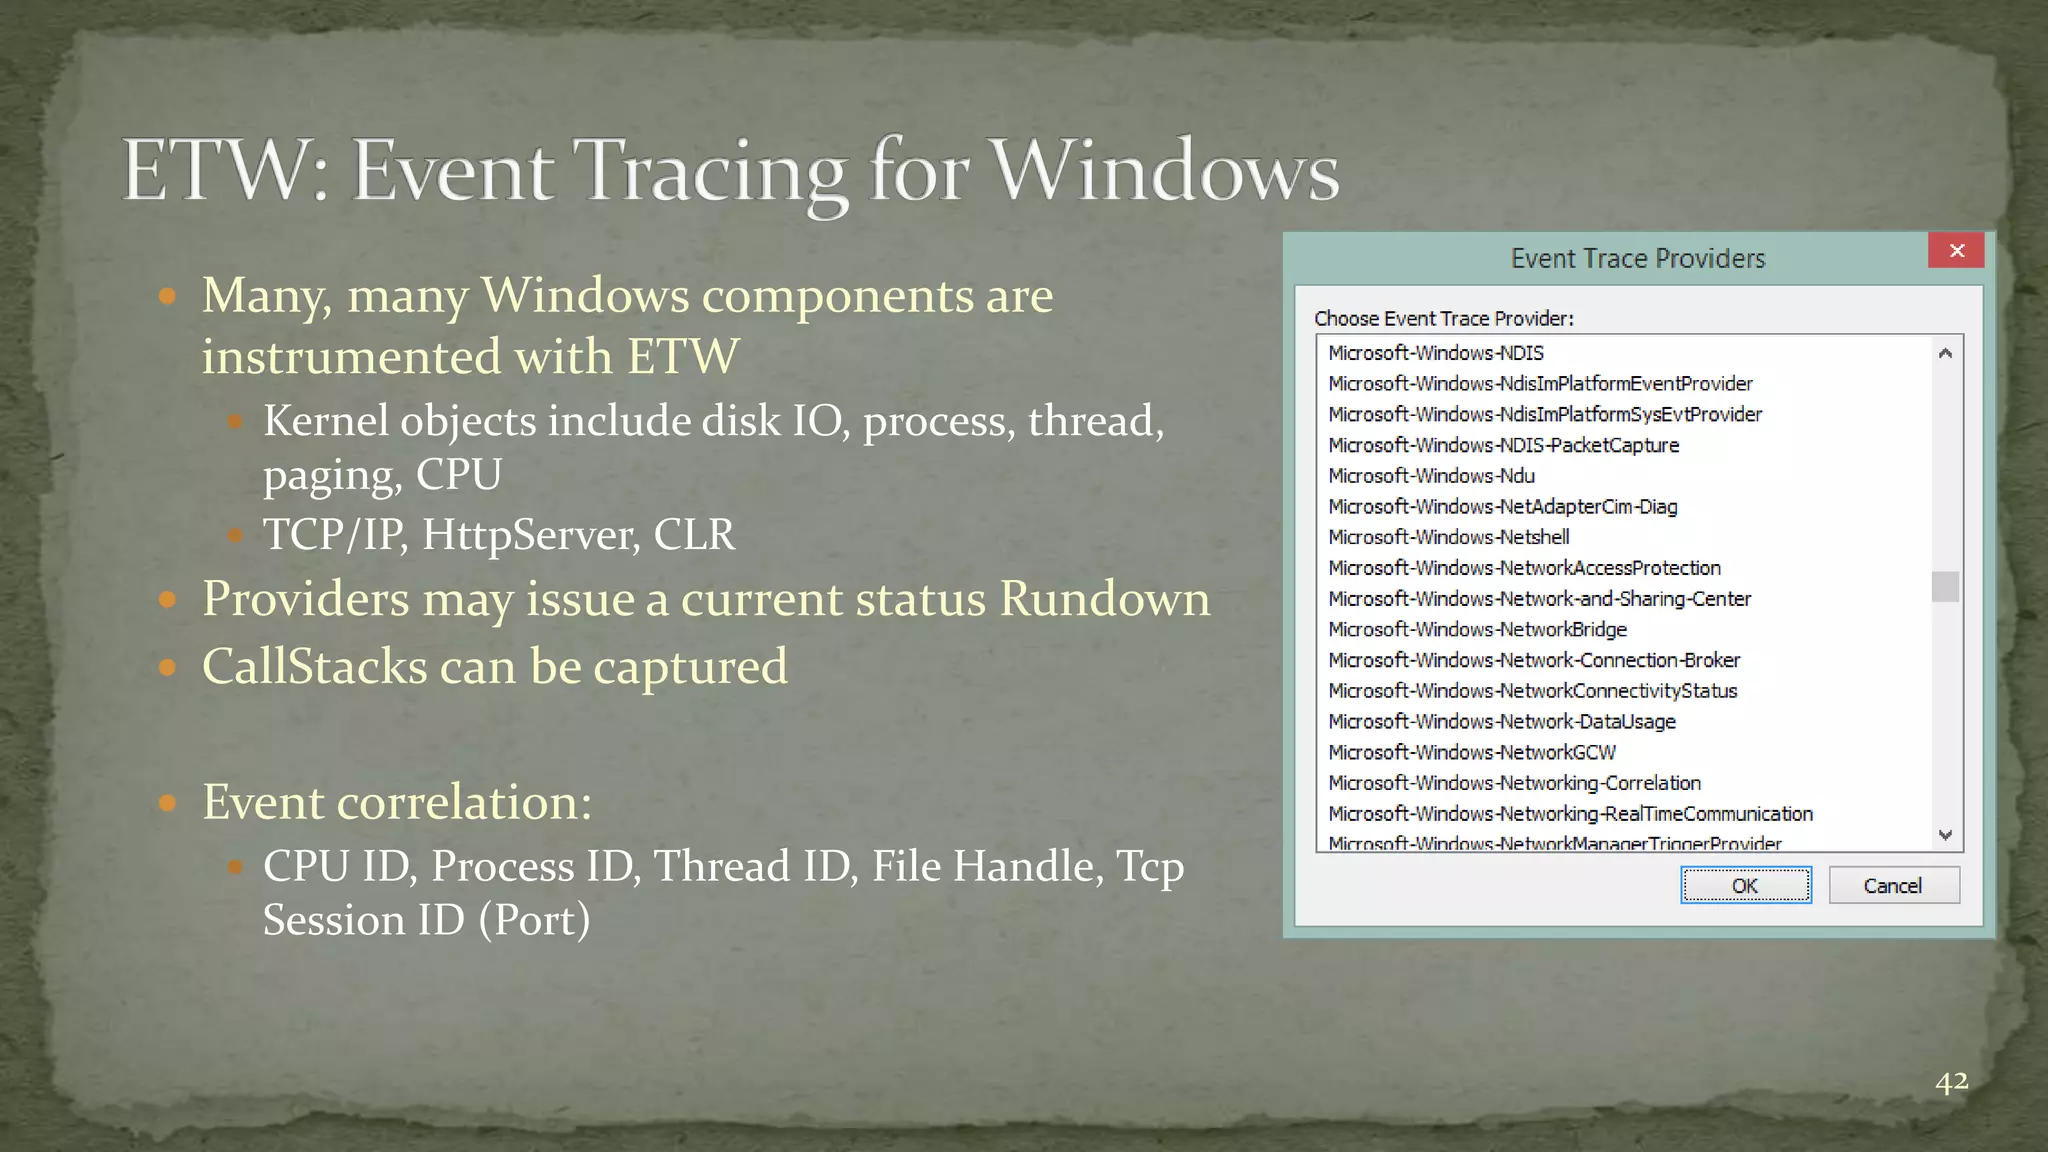
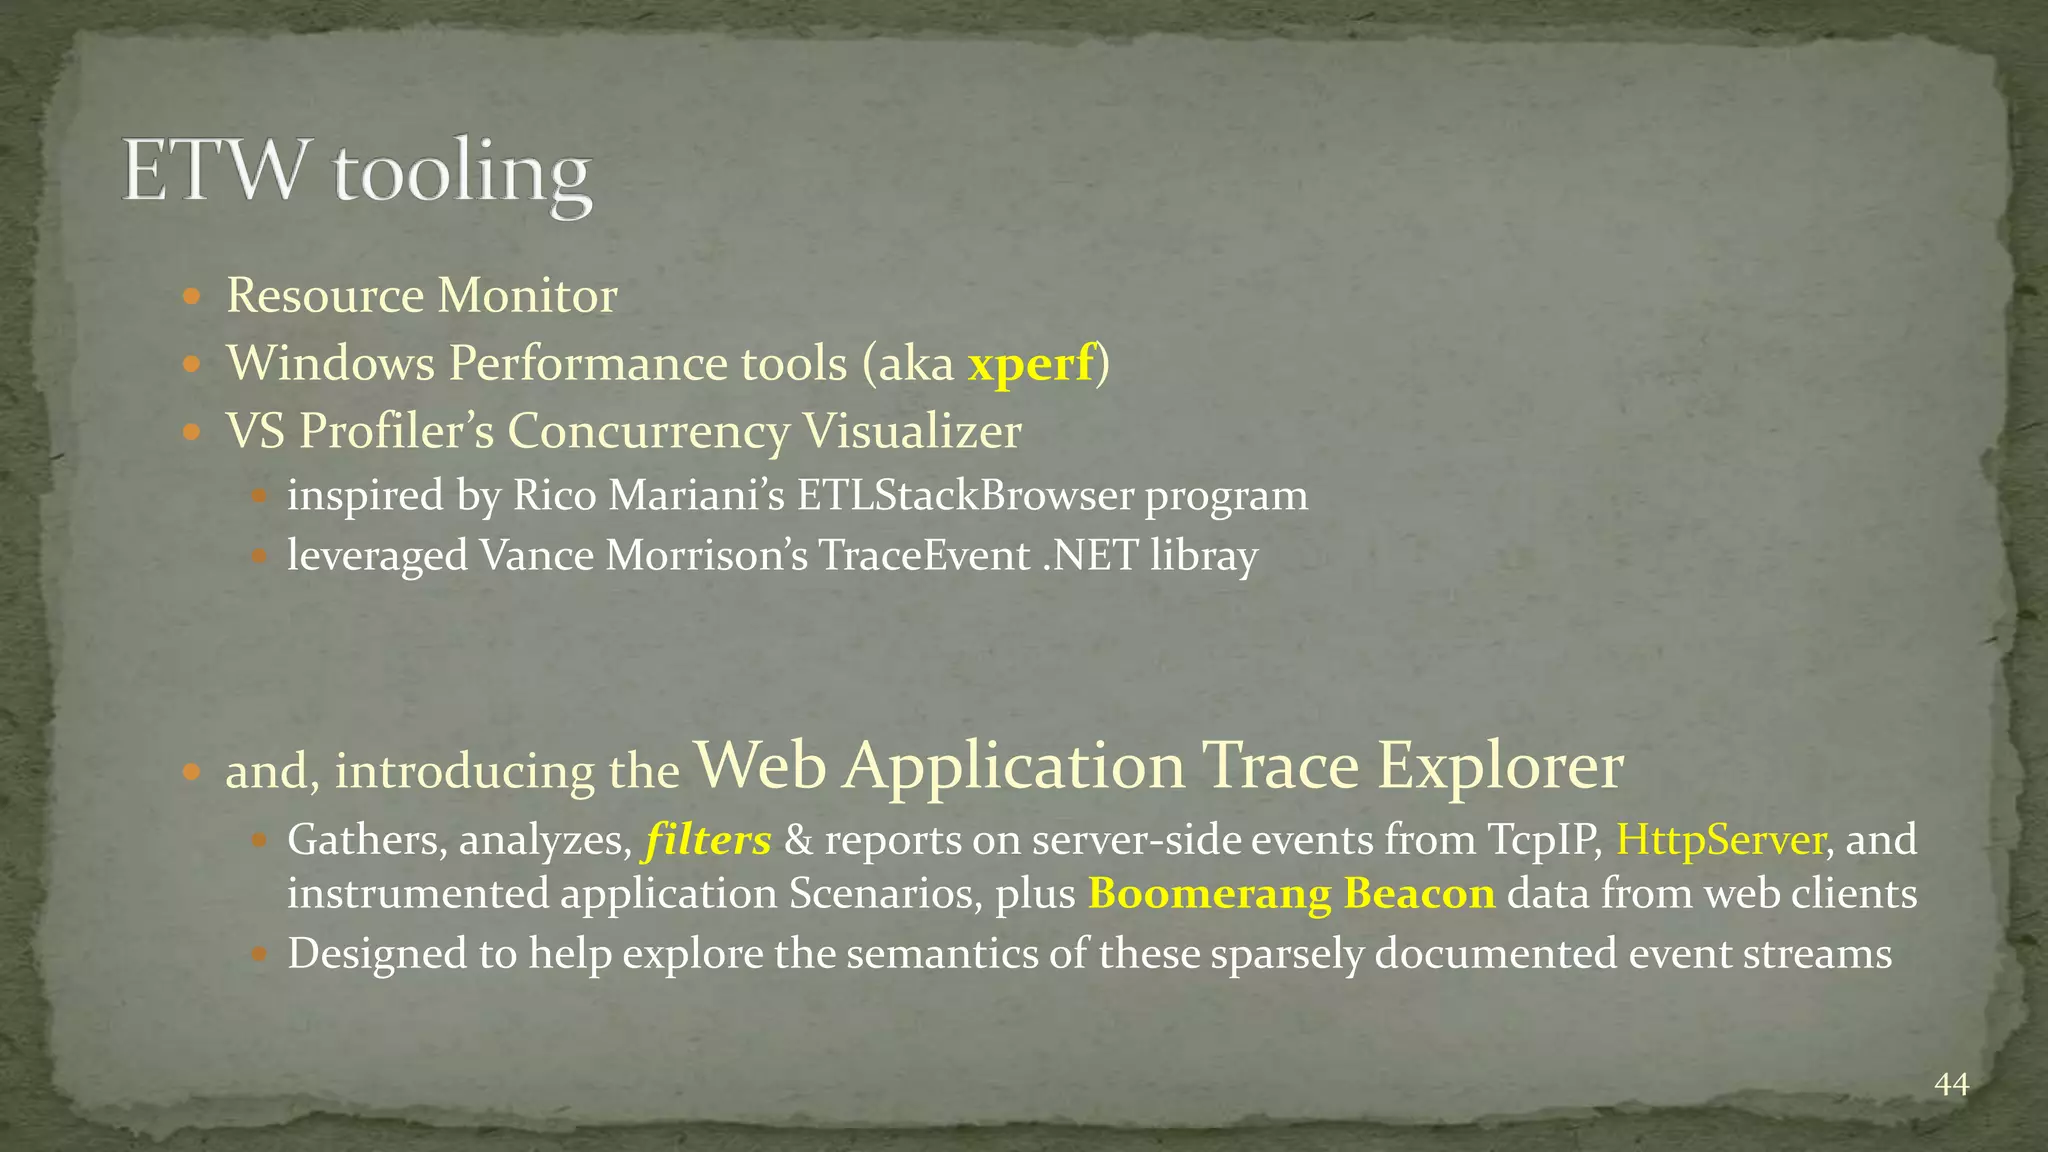
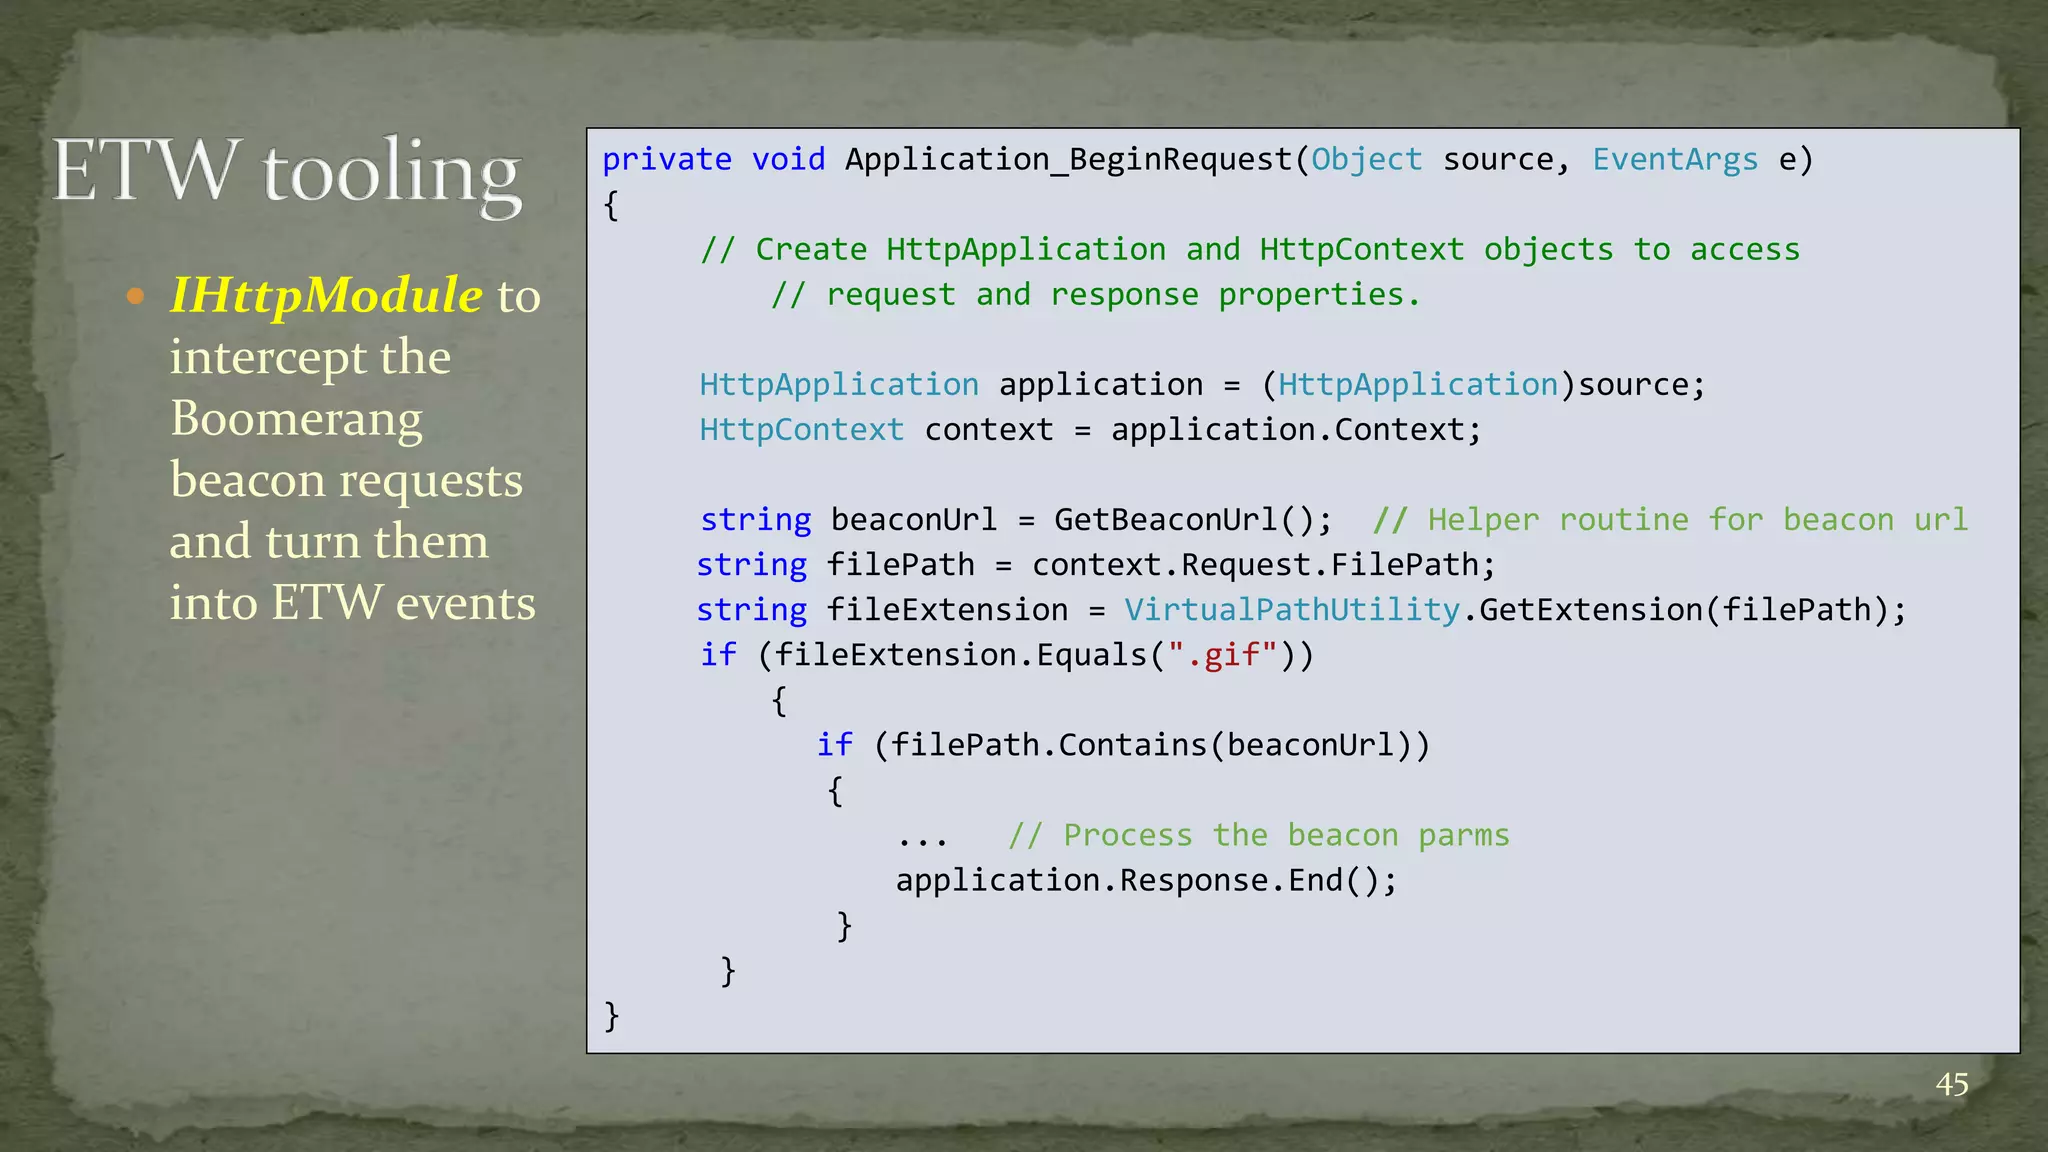
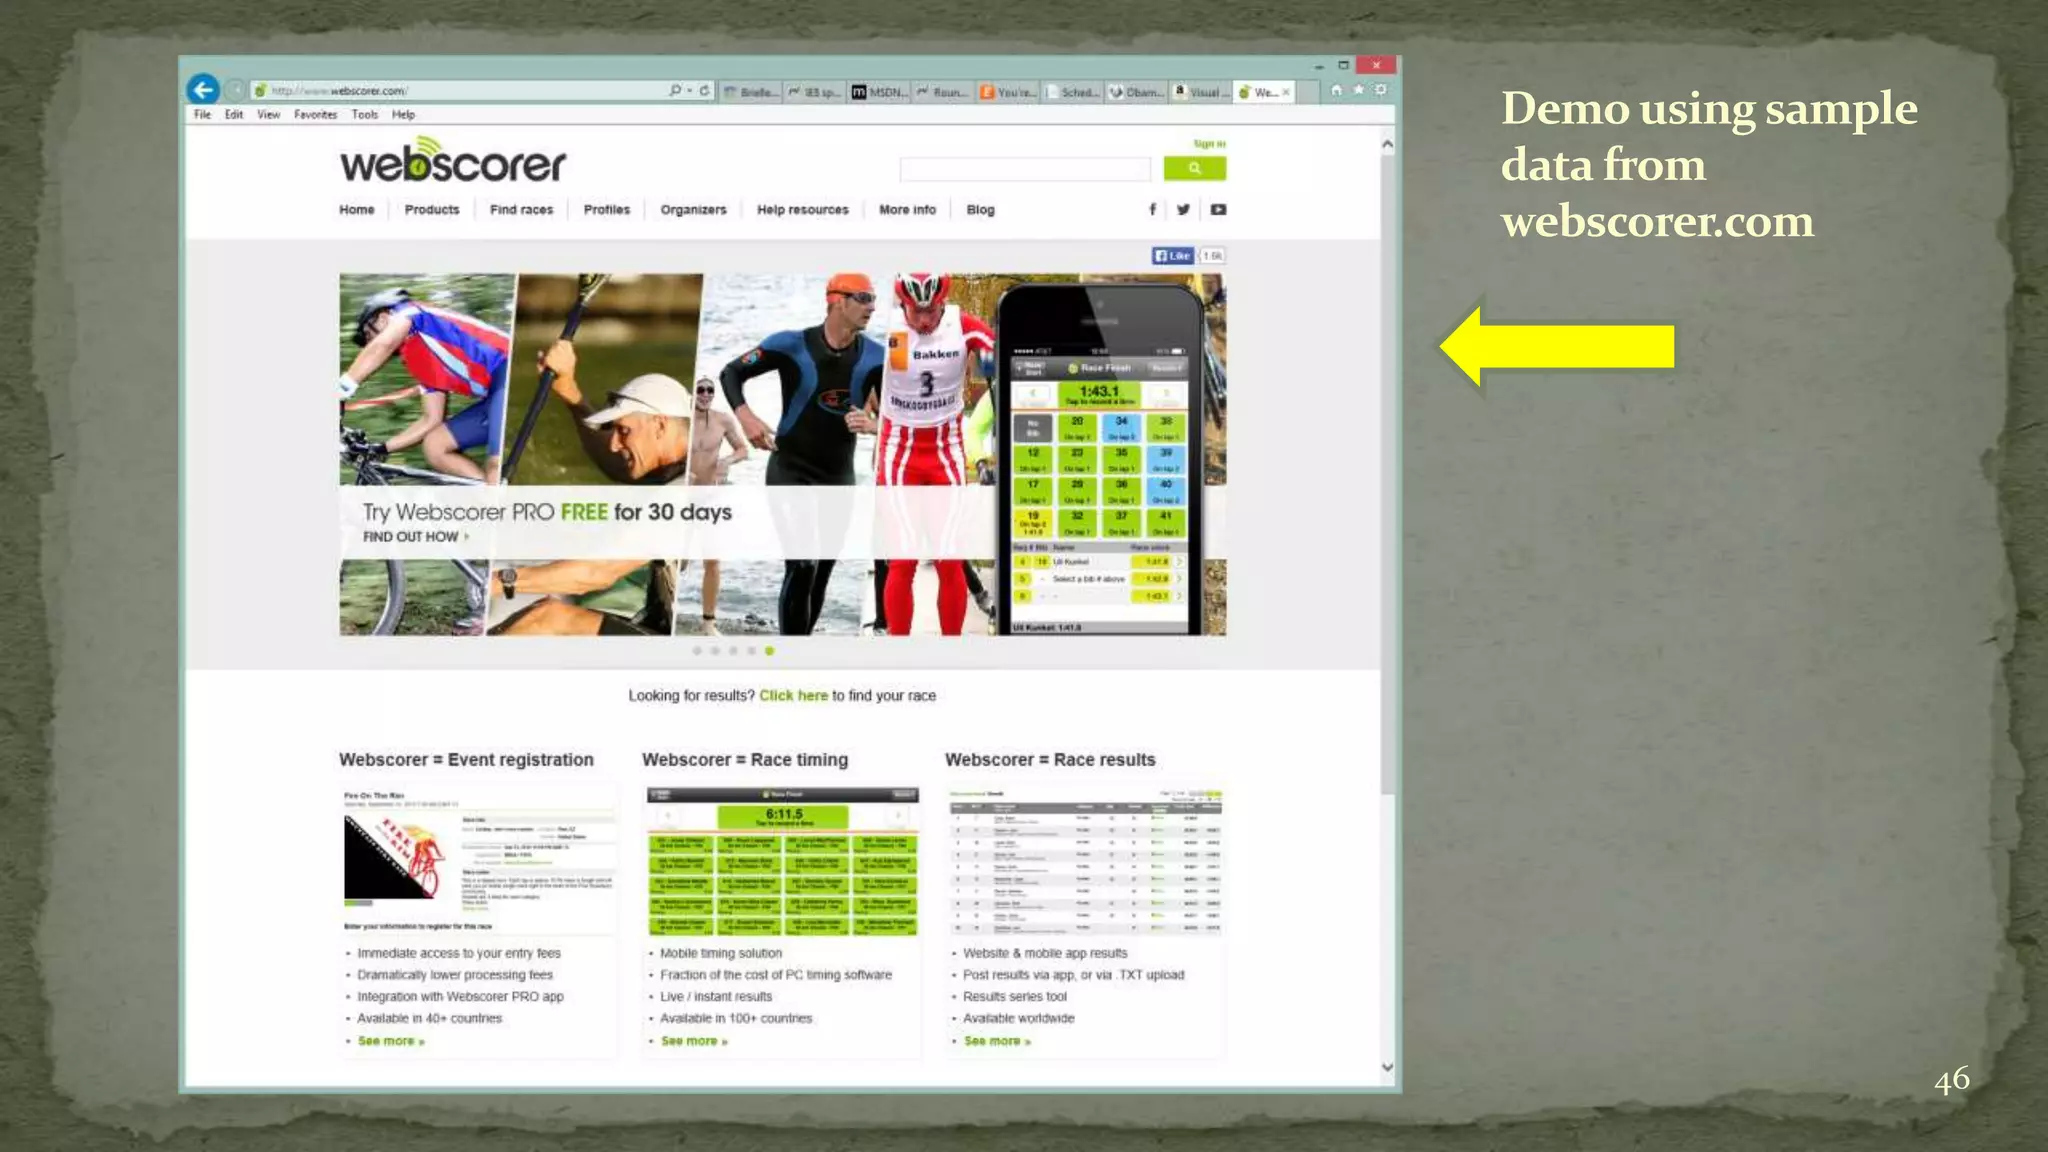
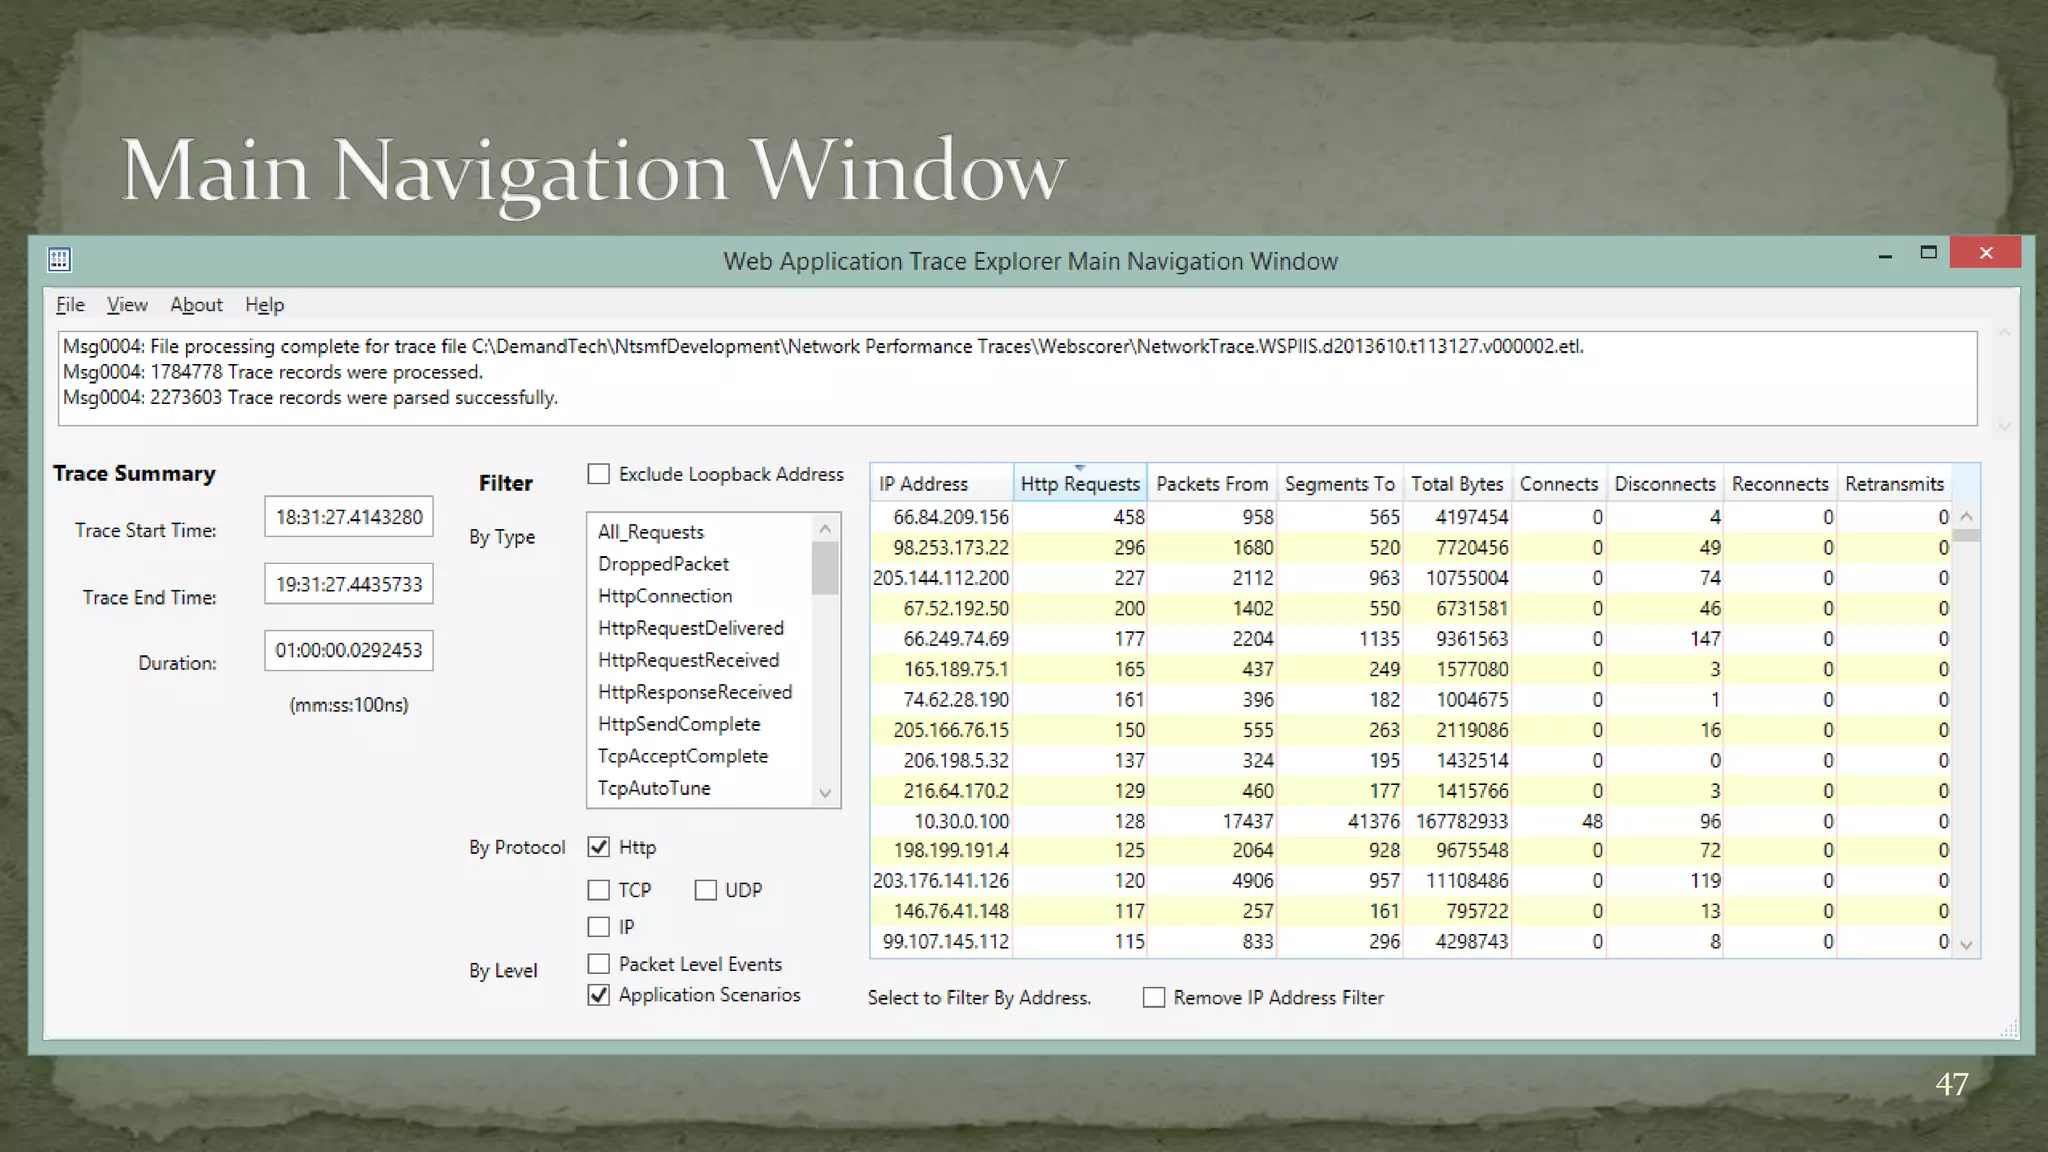
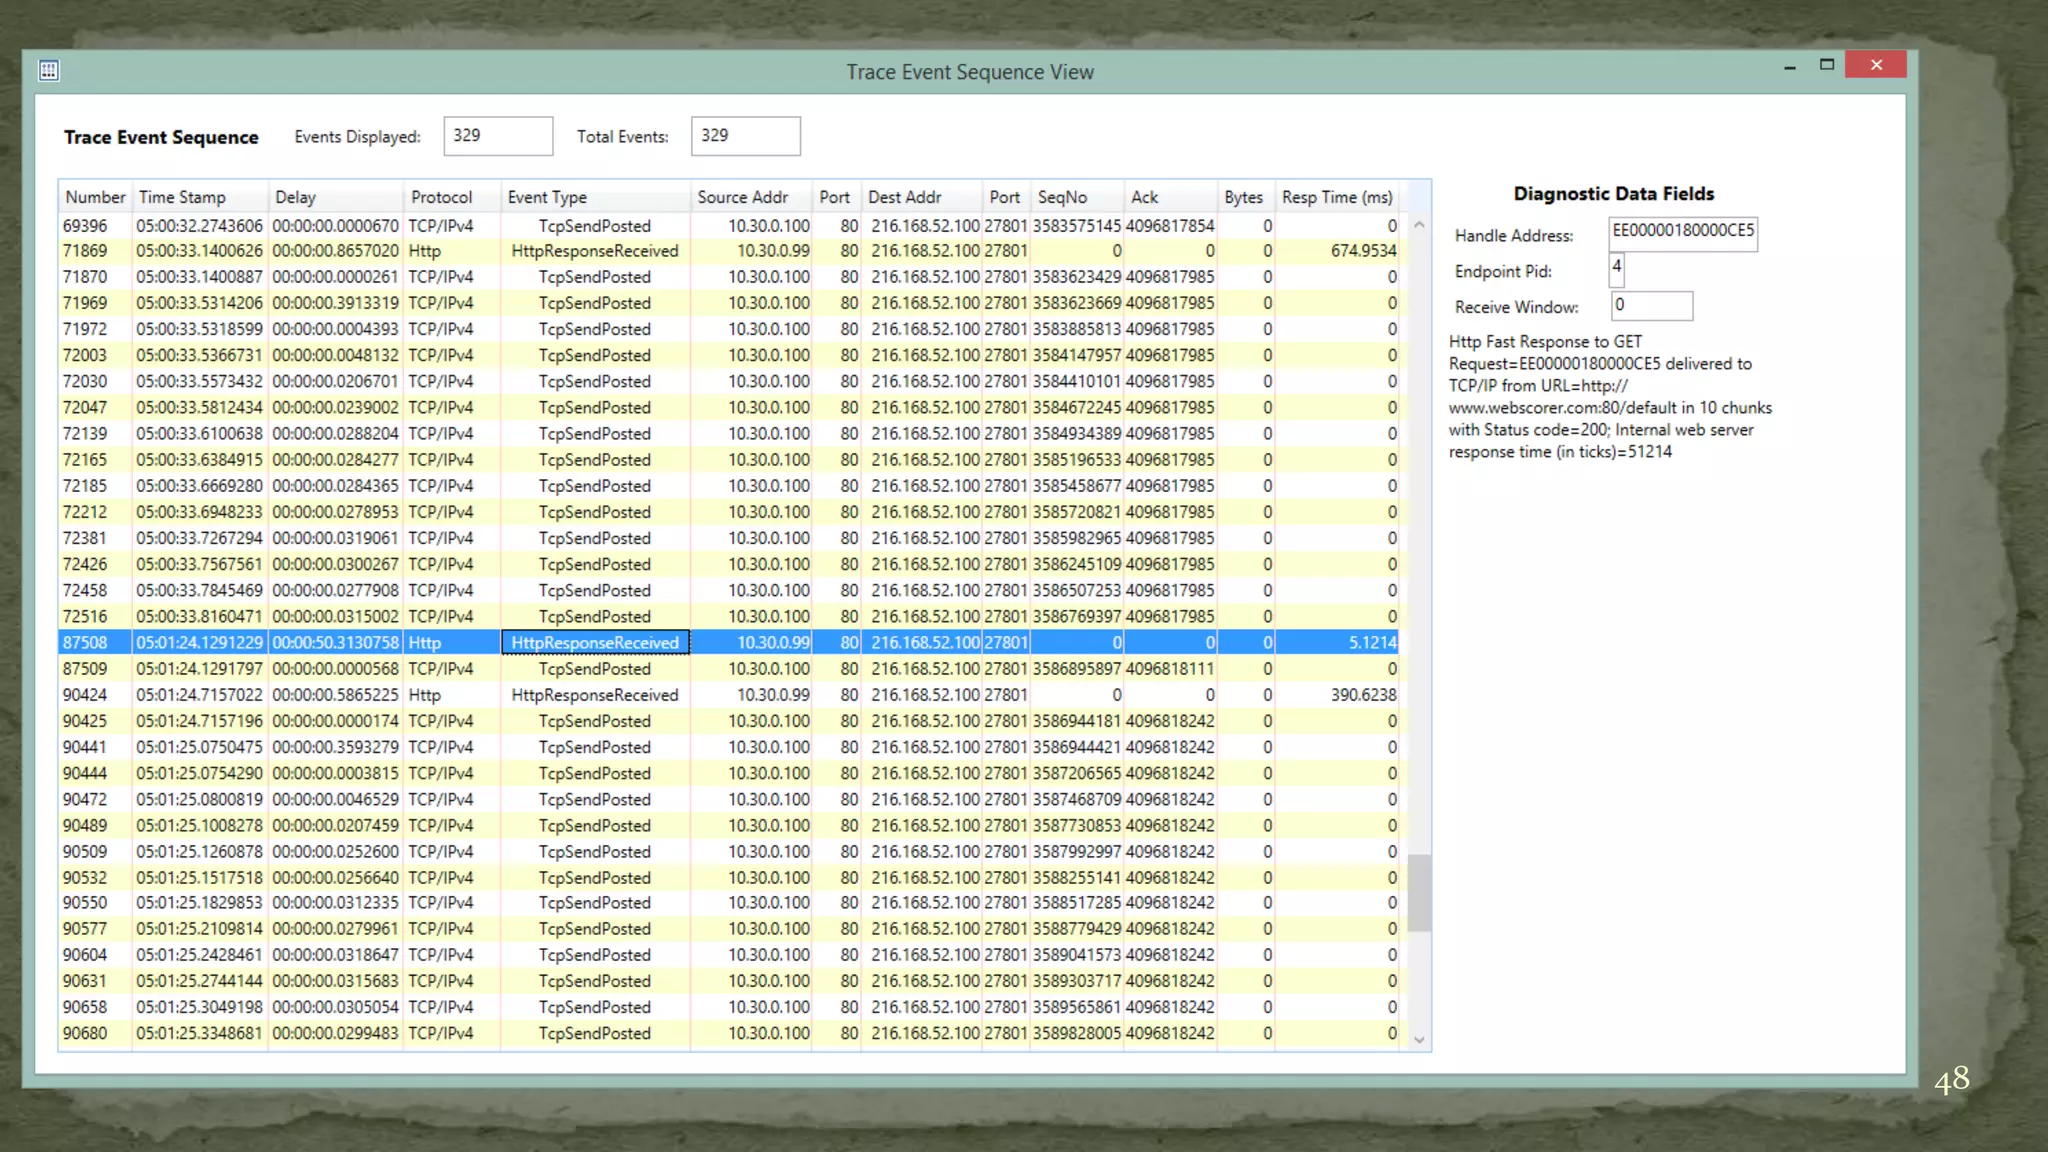
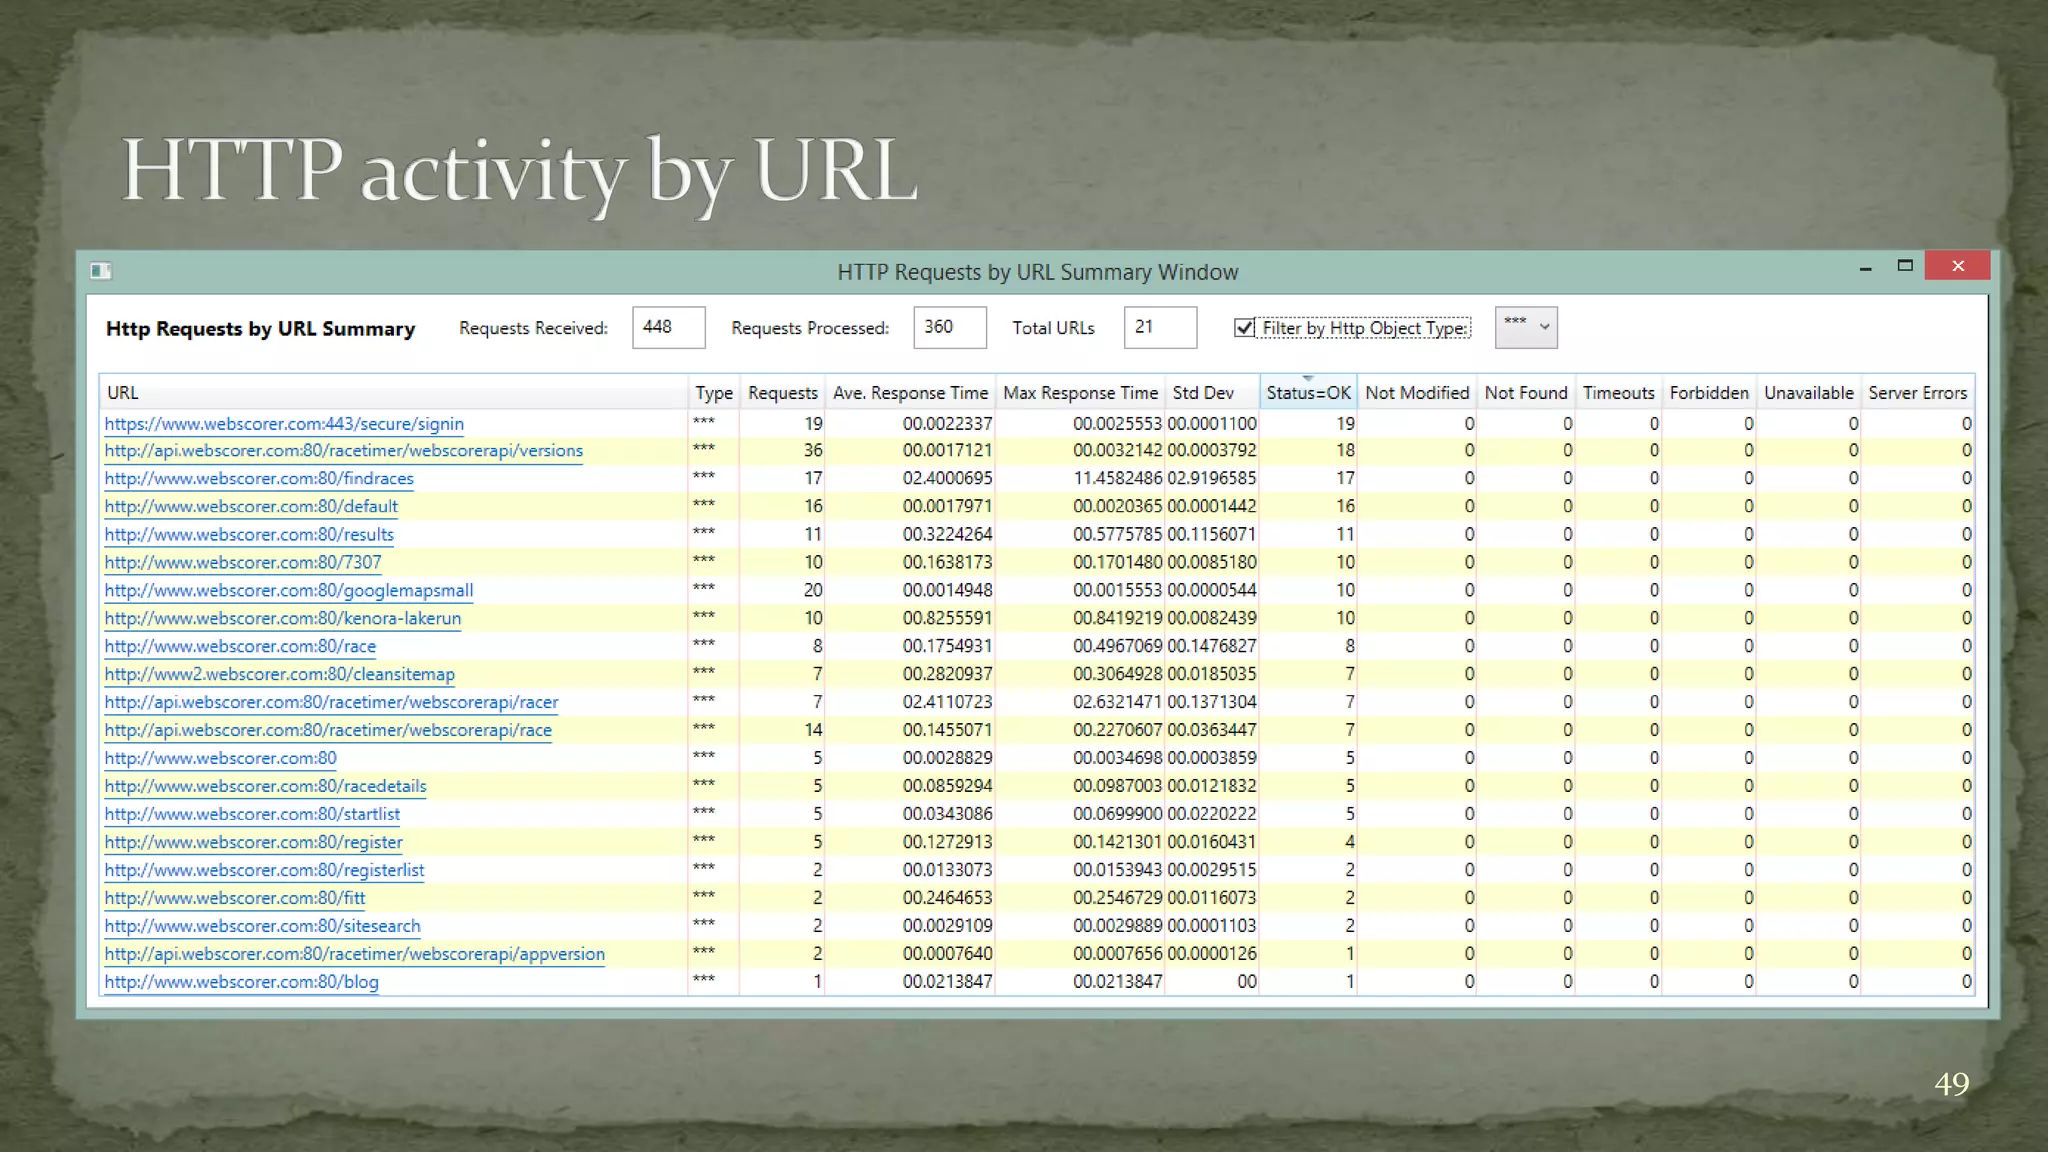
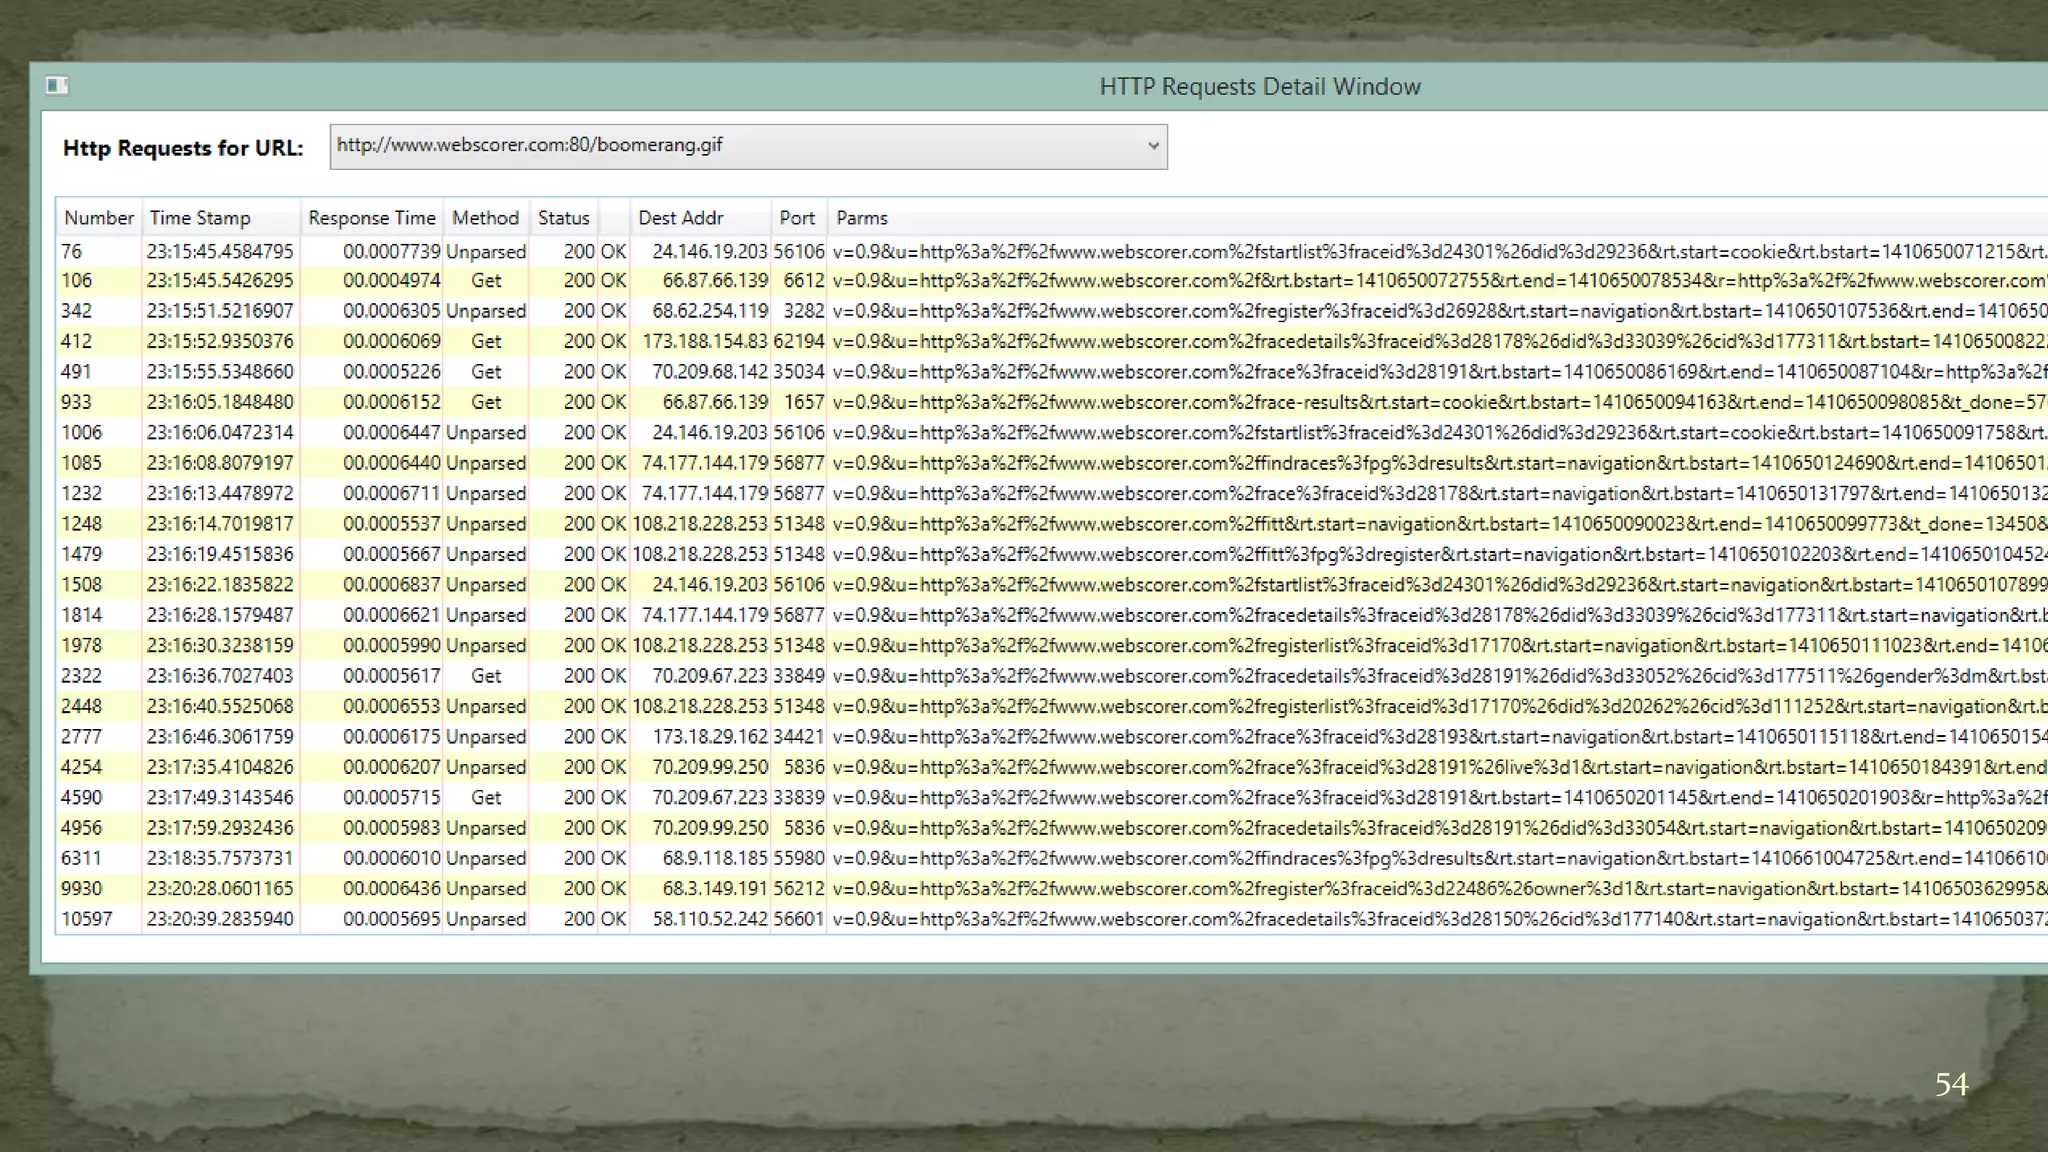
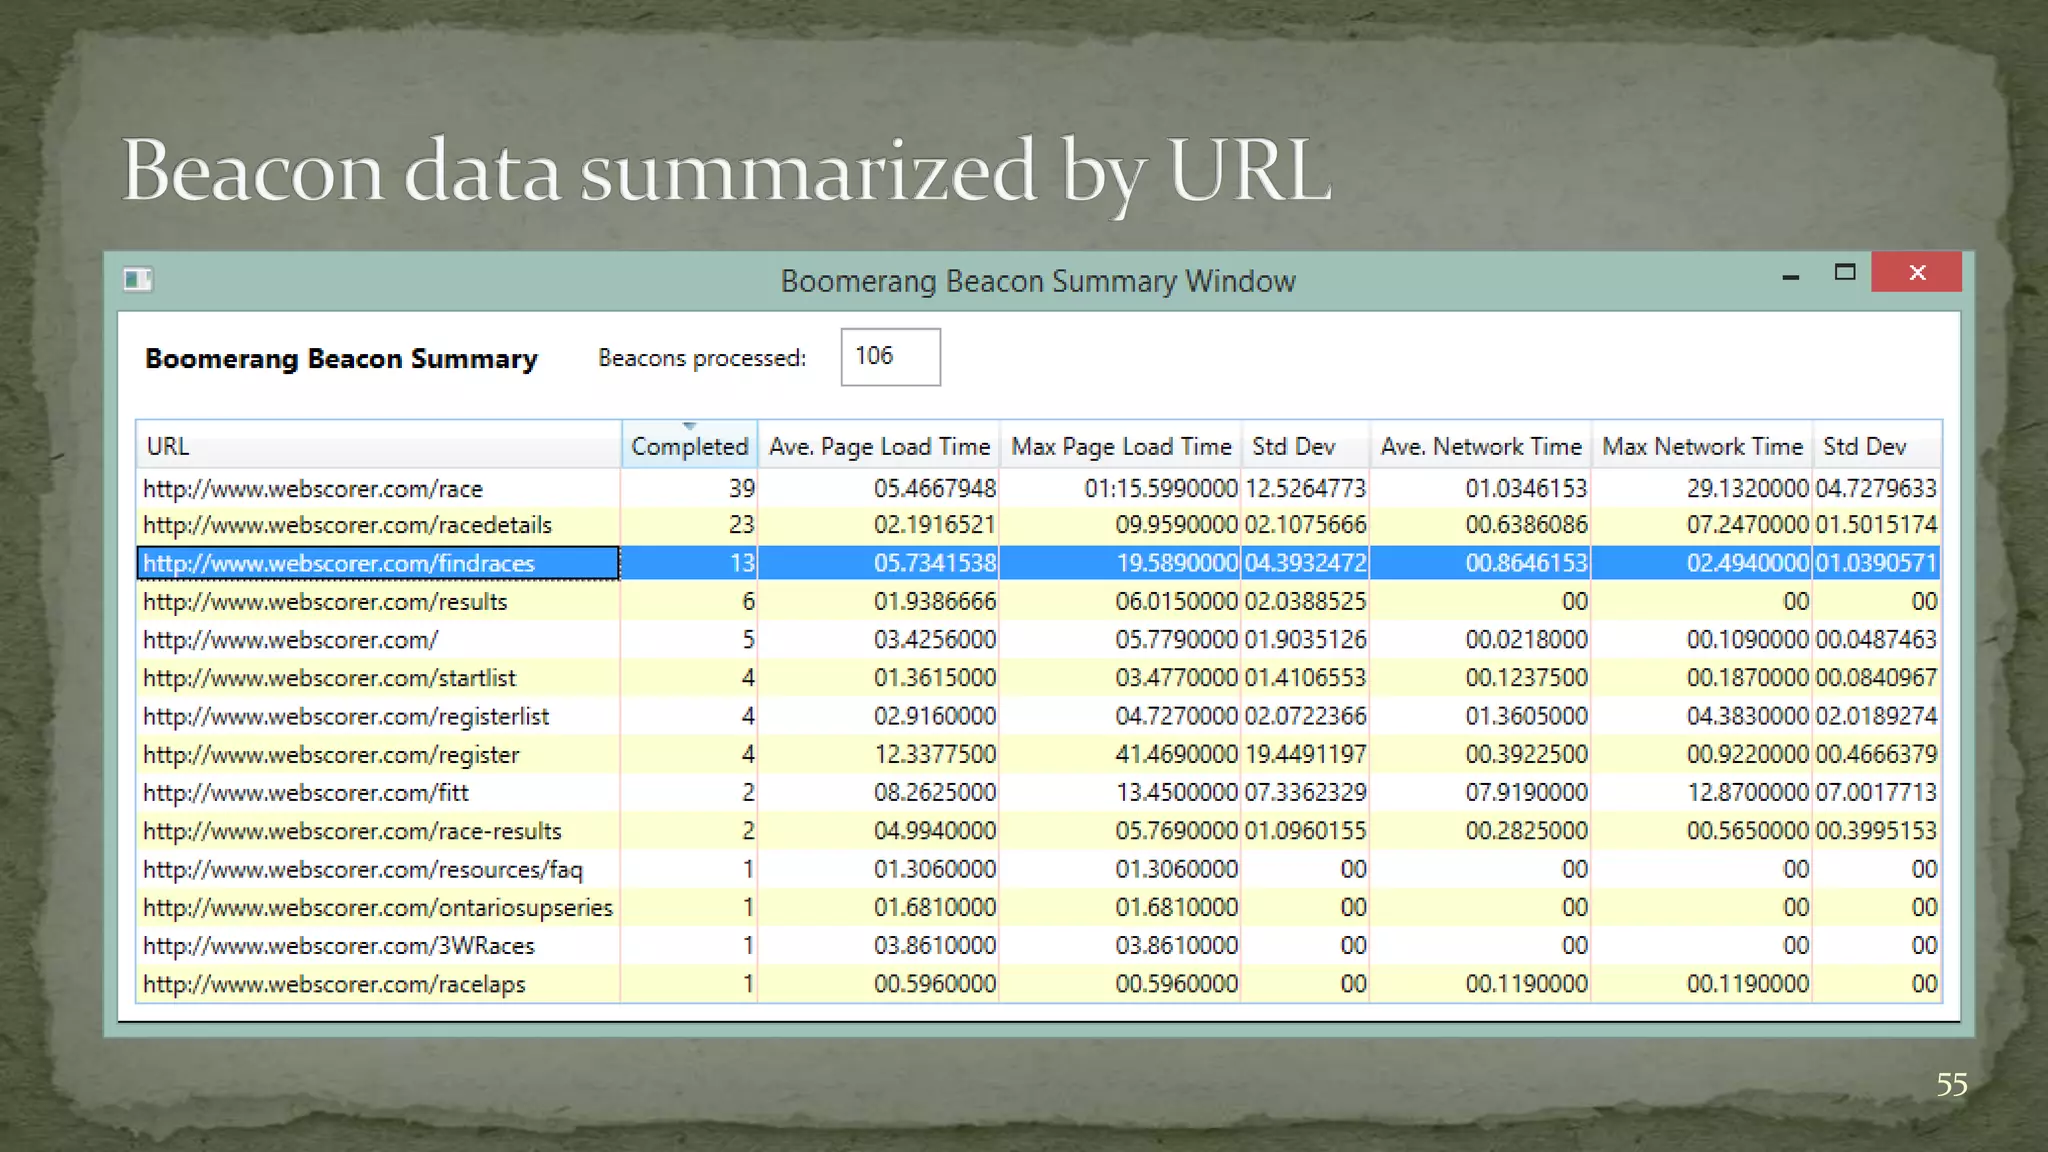
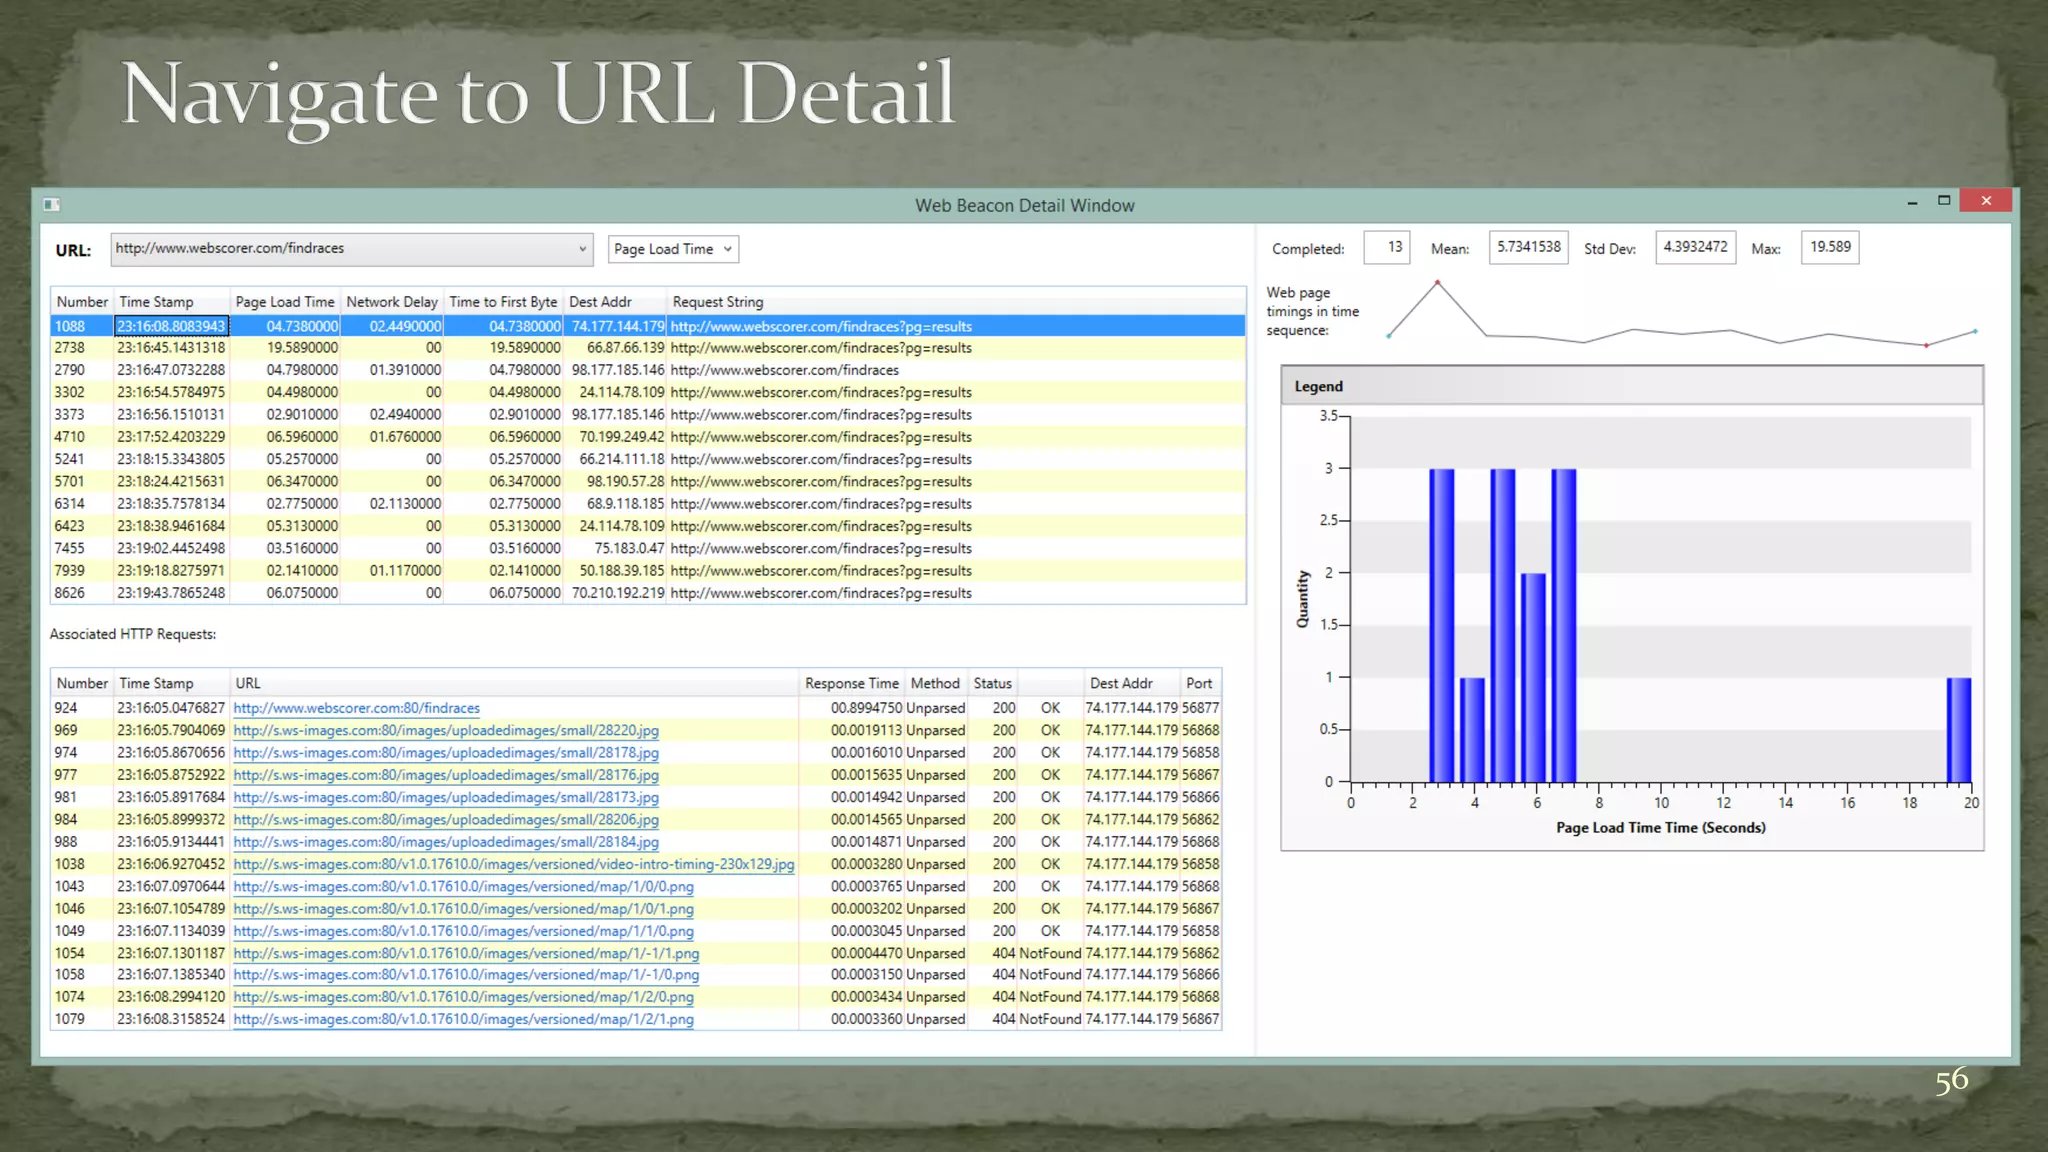
Mark Friedman
Demand Technology Software
markf@demandtech.com
http://computerperformancebydesign.com
1
Why is this web app running slowly?
 Main Topics
 Building scalable web applications
 YSlow scalability model of web page composition
 Page Load Time and Round trips
 Limitations of the approach
 W3C Nav/Timing API
 Google Analytics & RUM
 Progress report on an ETW-based approach to web application performance
monitoring
 plus, sprinkle in some case studies & best practices
2
 Themes:
 The Value of Response Time measurements
 Service Level reporting
 Application response time measurements correlate with measures of customer
productivity & satisfaction
 Queuing models, decomposition & other analytic techniques
 Obstacles:
 Measurement data missing from standard Windows ASP.NET counters, but it is available
from other sources
 Request-Response boundaries are blurred in many AJAX applications
 Understanding how to set good response time objectives
 Since human beings are adaptable &
 “ Good” and “Bad” are often relative to the application context
 See “Engineering Time,” by Dr. Steve Seow
3
 Themes:
 Web application programming models and fashion change faster than tools
can adapt
 AJAX
 e.g., Auto-complete in Google Search
 achieved using client-side Javascript & Asysnchronous Http web service Requests
 High Availability and Scalability using n-tiered architectures
 typically, a Presentation Layer, Business Objects layer, and a Data Access Layer
 HTML5
 HTTP/2
 Effective performance tools are usually one or two generations behind emerging
technology
 e.g., http://webpagetest.org
4
 Fundamental concept in software performance engineering (SPE)
 namely, f(x),
such that f(x) reliably predicts Response time.
 Factors can be
 linear (m+n…)
 multiplicative (m * n)
 exponential (mn)
5
Assuming rendering time inside the web client is minimal,
Web Page Load Time = Render Time  RoundTrips * RTT
where
RoundTrips = 𝒊=𝟏
𝒏 𝒉𝒕𝒕𝒑𝑶𝒃𝒋𝒆𝒄𝒕𝑺𝒊𝒛𝒆𝒊
𝒑𝒂𝒄𝒌𝒆𝒕𝒔𝒊𝒛𝒆
6
7
Part 1.
8
 Developed using ASP.NET (Server-side controls)
 Multiple tiers: presentation/business objects/data layer
 Uses the Model-View-Controller (MVC) pattern
 Key elements of the web Page
 data-rich Charting component (.NET Chart, based on the Dundas component)
 Chart definition used to generate the PDB Query and the results are mapped to a Chart
instance
 Library of Chart templates
 Machine selection
 Date/Time selection
9
10
Ask YSlow
11
 Based on the influential work of Steve Souders*
 originally at Yahoo
 since migrated to Google
 Google Chrome extension
 Rule-based
 Influenced:
 Chrome PageSpeed Insights
 IE Developer Tools
 Fiddler
 Glimpse
 etc.
* High Performance Web Sites, O’Reilly Media, 2007
12
 Optimize for Page Load Time
 Request.Start  DOM.Complete
 Make specific recommendations on how to improve Page Load Time for a
specific web page
 Inventorying the Document Object Model (DOM) after the composition &
rendering the of web page:
 Calculate # of Http objects and their size
 Does not attempt to actually measure Page Load Time, however.
 Lead to a standardization effort to wire performance timing data to the
DOM & create a consistent way to access it
 Navigation Time, Performance Timing & a High Resolution Clock
13
14
Web Browser Http Server
Http GET Request (Uri)
Compose
&
Render
Http RESPONSE
Note: Http is a sessionless protocol
Measurement techniques
• sniff network packets
• monitoring service to submit
synthetic Requests
• Real User Measurements
• attach handlers to DOM
window.unload and
window.load events
15
16
 Response message often contains embedded references to additional
resources needed to render the Page
 e.g.,
 image files
 style sheets
 javascript files
17
Web Browser Http Server
Http GET Request (Uri)
Compose & Render
Http RESPONSE
 HTTP interacts with the underlying TCP/IP networking protocols
 HTTP Response messages > Ethernet packet size (~ 1500 bytes) require
multiple IP packets
 With large cookies and a large number of parms, GET Request messages
can even exceed the Ethernet packet size
18
Web Browser Http Server
Http GET Request (Uri)
Compose & Render
Http RESPONSE
 YSlow scalability model:
assuming web client processing time is minimal, then
Render Time  RoundTrips * RTT
RoundTrips = 𝒊=𝟏
𝒏 𝒉𝒕𝒕𝒑𝑶𝒃𝒋𝒆𝒄𝒕𝑺𝒊𝒛𝒆𝒊
𝒑𝒂𝒄𝒌𝒆𝒕𝒔𝒊𝒛𝒆
19
Ask
YSlow
20
 YSlow scalability model:
Browser Render Time  RoundTrips * RTT
 Web Browser performs page composition using the Document Object
Model, or DOM
 YSlow Rule: Make fewer HTTP requests
 YSlow Rule: Improve cache effectiveness
 YSlow Rule: Reduce the number of DOM elements
 YSlow Rule: Compress the objects the page does need to load
 Tuning is a process that attempts to drive
# RoundTrips  1
RoundTripTime  0
21
 YSlow never actually measures RTT, but other related tools can
 RTT may vary across Requests
 Objects can be geographically dispersed
 Local cluster, remote, cloud
 e.g., referencing 3rd-party, advertising services
 TCP adaptive window scaling and other network congestion avoidance strategies
 Ignores variability in the execution time of client and server-side code
 e.g., sort() a large list of elements, or
 a hi-res visualization component that scales nonlinearly with the size of the result
set
 Compression recommendations can be at odds with good code
maintainability practices
22
 Web Browsers create multiple TCP sessions to download referenced
objects in parallel
 YSlow Rule: take advantage of parallel sessions by loading scripts last
 Accurate rendering of the DOM requires that downloading a Javascript file blocks
parallel downloads
 Script may add elements to the DOM dynamically, call other scripts or reference additional
resources
 Browser assumes DOM rendering can only resume after the Javascript code executes
Page Load Time = Browser Render Time +
Script execution Time +
(RoundTrips * RTT)/Sessions
23
 Despite the many complications, the YSlow scalability model has
proved very influential
 Browser Page Load Time is an end-to-end measurement of service time,
which is apt to be correlated with customer satisfaction
 see, for example, http://www.slideshare.net/Strangeloopnet/37-lessons-ive-
learned-on-the-performance-front-lines
 Inspired development of related tools to measure Page Load Time
24
 The YSlow scalability model is useful, but it is not
adequate for many web applications
25
 Page Load time is a measure of end-to-end
response time
 Navigation Timing measurements decompose overall
response time into Network, Server, and Client (i.e., web
browser) components
 YSlow is silent:
 the scalability of server-side components
 the diversity of web client hardware (PCs, tablets,
phones) & software (iOS, Android, Windows)
 the performance of the client’s network connection
 e.g., Internet vs. Intranet connections
26
 Despite the many complications, the YSlow scalability model has
proved very influential
 Sparked a standardization effort so Javascript developers could access the PLT
measurements reliably across Browsers
 Creation of standard DOM performance objects that are accessible to
Javascript
 Finally, now that actual web application performance data is available in the
web browser, how do I get that data back to my data center for optimization &
capacity planning?
27
28
Prompt for
unload
redirect
App
cache
DNS TCP Request Response Processing load
unload DOMContentLoaded
navigationStart
redirectStart
redirectEnd
fetchStart
domainLookupStart
domainLookupEnd
connectStart
secureConnectionStart
connectEnd
requestStart
responseStart
responseEnd
loadEventStart
loadEventEnd
unloadEventStart
unloadEventEnd
domLoading
domInteractive
domContentLoadedEventStart
domContentLoadedEventEnd
domComplete
 Http Request/Response and Rendering events
 Web Performance Working Group
 Performance Timeline, Navigation Timing, and
High Resolution Time specs
 Supported in IE, Chrome, WebKit, and FoxFire
 Event timings can be used to calculate:
 Network latency (from the standpoint of the web client)
 Page Render time (once the page components are received
from the server)
 Entire sequence from navigation to page load completion:
29Navigation Timing spec: https://dvcs.w3.org/hg/webperf/raw-file/tip/specs/NavigationTiming/Overview.html#processing-model
 Calculate network latency:
responseEnd - fetchStart
30
Calculate Page Render Time:
loadEventEnd - responseEnd
31
Calculate entire sequence:
loadEventEnd - navigationStart.
32
 see https://developer.mozilla.org/
33
<html>
<head>
<script type="text/javascript">
// Add load event listener.
window.addEventListener("load", loadTime, false);
function loadTime() {
// Get current time.
var now = window.performance.now();
// Calculate page load time.
var page_load_time = now - performance.timing.navigationStart;
// Write the load time to the F12 console.
if (window.console) console.log(page_load_time);
}
</script>
</head><body>
<!- Main page body is here. --> </body>
</html>
 Now that actual web application performance data is available in the web
browser, how do I get that data back from the web client?
 What about the volume of measurement data that requires processing & analysis?
 Google Analytics uses web beacons to send the response time data to
Google’s data center for analysis and reporting
 Yahoo Boomerang project can be used to send web beacons with the data
back to your data center
34
 Architecture of an ASP.NET application
 Windows OS
 TCP/IP
 (Clustered) IIS front end Web Servers
 ASP.NET
 .NET CLR
 ADO.NET (data layer)
35
 Dynamic HTML is session-oriented behavior layered on top of the
HTTP
 Web applications require state
 Who you are
 Where you are (mobile apps)
 They preserve state:
 During a session
 TCP protocol is session-oriented
 Requires a connection
 Calculates RTT per connection (used in re-try logic)
 Between sessions (using cookies, etc.)
36
 Server-side Request processing
 Event-oriented programming model (Postback)
 HttpContext wrapper around the HTTP Request
 Persistent State
 ViewState
 Session State
 Application and Page Cache objects
 etc.
37
38
IIS Architecture
User
Kernel
HTTP
TCP
IP
Network
Interface
HTTP Kernel Mode
Driver
(http.sys)
HTTP Response Cache
(Physical Memory)
LSSAS
Windows
Authentication
SSL
Inetinfo
IIS
Administration
FTP
Metabase
SMTP
NNTP
SVCHOST
W3SVC
W3wp
W3wp
Mscoree.dll
http
<code-behind>.dll
Default.aspx
Application Pool
W3wp
W3wp
Mscoree.dll
<code-behind>.dll
Default.aspx
Application Pool
WAS
Cache
net.tcp net.tcp
http
 HttpApplication Event Handlers (IHttpModule)
Event Event
BeginRequest PreRequestHandlerExecute
AuthenticateRequest PostRequestHandlerExecute
PostAuthenticateRequest ReleaseRequestState
AuthorizeRequest PostReleaseRequestState
PostAuthorizeRequest PostMapRequestHandler
ResolveRequestCache PostMapRequestHandler
PostResolveRequestCache PostMapRequestHandler
MapRequestHandler UpdateRequestCache
PostMapRequestHandler PostUpdateRequestCache
AcquireRequestState LogRequest
PostAcquireRequestState EndRequest 39
 Extends the ASP.NET event model to all Http Requests
 HttpApplication Event Handlers (IHttpModule)
40
public class BoomerangBeacon : IHttpModule
{
public MyHttpModule()
{}
public void Dispose()
{}
public void Init(HttpApplication application)
{
application.BeginRequest += (new EventHandler(this.Application_BeginRequest));
}
}
w3wp.exe
Common Language Runtime (CLR)
JIT compiler
Garbage Collection threads
mscoree.dll
mscorsvr.dllMyApp.dll
41
 Many, many Windows components are
instrumented with ETW
 Kernel objects include disk IO, process, thread,
paging, CPU
 TCP/IP, HttpServer, CLR
 Providers may issue a current status Rundown
 CallStacks can be captured
 Event correlation:
 CPU ID, Process ID, Thread ID, File Handle, Tcp
Session ID (Port)
42
 Many obstacles to using trace-based instrumentation effectively in
performance investigations
 Sheer volume of trace data that can be generated (e.g., OS Dispatcher ContextSwitch
events)
 Cannot always be filtered effectively
 Very little documentation on specific events and how they are logically related
 Inconsistent semantics (but only a few common patterns)
 Sequence: Begin, Step, End
 StateChange(oldState, newState)
 Fork:Join
 Send:Receive
 etc.
43
 Resource Monitor
 Windows Performance tools (aka xperf)
 VS Profiler’s Concurrency Visualizer
 inspired by Rico Mariani’s ETLStackBrowser program
 leveraged Vance Morrison’s TraceEvent .NET libray
 and, introducing the Web Application Trace Explorer
 Gathers, analyzes, filters & reports on server-side events from TcpIP, HttpServer, and
instrumented application Scenarios, plus Boomerang Beacon data from web clients
 Designed to help explore the semantics of these sparsely documented event streams
44
 IHttpModule to
intercept the
Boomerang
beacon requests
and turn them
into ETW events
45
private void Application_BeginRequest(Object source, EventArgs e)
{
// Create HttpApplication and HttpContext objects to access
// request and response properties.
HttpApplication application = (HttpApplication)source;
HttpContext context = application.Context;
string beaconUrl = GetBeaconUrl(); // Helper routine for beacon url
string filePath = context.Request.FilePath;
string fileExtension = VirtualPathUtility.GetExtension(filePath);
if (fileExtension.Equals(".gif"))
{
if (filePath.Contains(beaconUrl))
{
... // Process the beacon parms
application.Response.End();
}
}
}
Demo using sample
data from
webscorer.com
46
47
48
49
50
 Boomerang beacon support
 Add the boomerang.js script to your web page HTML:
 Initialize boomerang:
51
<script src="javascriptBoomerangboomerang.js" type="text/javascript"></script>
<script src="javascriptBoomerangplug-insnavtiming.js"
type="text/javascript"></script>
<script src="javascriptBoomerangplug-insrt.js" type="text/javascript"></script
<script lang="javascript">
BOOMR.init({beacon_url: "boomerang.gif"});
</script>
 Boomerang beacon support
 Add the BoomerangBeacon HttpModule from MeasurementWareWebServices.dll to
web.config
52
<system.webServer>
<modules>
<add name="MeasurementWareWebServices“
type="MeasurementWareWebServices.BoomerangBeacon"/>
</modules>
</system.webServer>
 BoomerangBeacon class
 derives from IHttpModule
 adds an EventHandler for HttpApplication.BeginRequest
 In the BeginRequest event handler,
 intercepts the boomerang.gif GET Requests
 parse the beacon parms
 generate a MeasurementWareWeb ETW event whose payload includes
 Page Load Time measurements
 plus, IP Address and Tcp Port (unique session ID) of the Sender for correlation with other
HttpServer and TcpIP events
53
54
55
56
 Initial stage of the work to add Boomerang beacon data to the event
collection and the displays is functionally complete
 Prototype real-time collector that reports HTTP Response time
measurements (by URL) as Windows performance counters is
currently available
 Contact me if your org is interested in participating
 markf@demandtech.com
 See my blog at http://computerperformancebydesign.com for the
latest status (until it reaches the Release to github stage)
57
58

Monitoring web application response times^lj a hybrid approach for windows

  • 1.
    Mark Friedman Demand TechnologySoftware markf@demandtech.com http://computerperformancebydesign.com 1 Why is this web app running slowly?
  • 2.
     Main Topics Building scalable web applications  YSlow scalability model of web page composition  Page Load Time and Round trips  Limitations of the approach  W3C Nav/Timing API  Google Analytics & RUM  Progress report on an ETW-based approach to web application performance monitoring  plus, sprinkle in some case studies & best practices 2
  • 3.
     Themes:  TheValue of Response Time measurements  Service Level reporting  Application response time measurements correlate with measures of customer productivity & satisfaction  Queuing models, decomposition & other analytic techniques  Obstacles:  Measurement data missing from standard Windows ASP.NET counters, but it is available from other sources  Request-Response boundaries are blurred in many AJAX applications  Understanding how to set good response time objectives  Since human beings are adaptable &  “ Good” and “Bad” are often relative to the application context  See “Engineering Time,” by Dr. Steve Seow 3
  • 4.
     Themes:  Webapplication programming models and fashion change faster than tools can adapt  AJAX  e.g., Auto-complete in Google Search  achieved using client-side Javascript & Asysnchronous Http web service Requests  High Availability and Scalability using n-tiered architectures  typically, a Presentation Layer, Business Objects layer, and a Data Access Layer  HTML5  HTTP/2  Effective performance tools are usually one or two generations behind emerging technology  e.g., http://webpagetest.org 4
  • 5.
     Fundamental conceptin software performance engineering (SPE)  namely, f(x), such that f(x) reliably predicts Response time.  Factors can be  linear (m+n…)  multiplicative (m * n)  exponential (mn) 5
  • 6.
    Assuming rendering timeinside the web client is minimal, Web Page Load Time = Render Time  RoundTrips * RTT where RoundTrips = 𝒊=𝟏 𝒏 𝒉𝒕𝒕𝒑𝑶𝒃𝒋𝒆𝒄𝒕𝑺𝒊𝒛𝒆𝒊 𝒑𝒂𝒄𝒌𝒆𝒕𝒔𝒊𝒛𝒆 6
  • 7.
  • 8.
  • 9.
     Developed usingASP.NET (Server-side controls)  Multiple tiers: presentation/business objects/data layer  Uses the Model-View-Controller (MVC) pattern  Key elements of the web Page  data-rich Charting component (.NET Chart, based on the Dundas component)  Chart definition used to generate the PDB Query and the results are mapped to a Chart instance  Library of Chart templates  Machine selection  Date/Time selection 9
  • 10.
  • 11.
  • 12.
     Based onthe influential work of Steve Souders*  originally at Yahoo  since migrated to Google  Google Chrome extension  Rule-based  Influenced:  Chrome PageSpeed Insights  IE Developer Tools  Fiddler  Glimpse  etc. * High Performance Web Sites, O’Reilly Media, 2007 12
  • 13.
     Optimize forPage Load Time  Request.Start  DOM.Complete  Make specific recommendations on how to improve Page Load Time for a specific web page  Inventorying the Document Object Model (DOM) after the composition & rendering the of web page:  Calculate # of Http objects and their size  Does not attempt to actually measure Page Load Time, however.  Lead to a standardization effort to wire performance timing data to the DOM & create a consistent way to access it  Navigation Time, Performance Timing & a High Resolution Clock 13
  • 14.
    14 Web Browser HttpServer Http GET Request (Uri) Compose & Render Http RESPONSE Note: Http is a sessionless protocol Measurement techniques • sniff network packets • monitoring service to submit synthetic Requests • Real User Measurements • attach handlers to DOM window.unload and window.load events
  • 15.
  • 16.
  • 17.
     Response messageoften contains embedded references to additional resources needed to render the Page  e.g.,  image files  style sheets  javascript files 17 Web Browser Http Server Http GET Request (Uri) Compose & Render Http RESPONSE
  • 18.
     HTTP interactswith the underlying TCP/IP networking protocols  HTTP Response messages > Ethernet packet size (~ 1500 bytes) require multiple IP packets  With large cookies and a large number of parms, GET Request messages can even exceed the Ethernet packet size 18 Web Browser Http Server Http GET Request (Uri) Compose & Render Http RESPONSE
  • 19.
     YSlow scalabilitymodel: assuming web client processing time is minimal, then Render Time  RoundTrips * RTT RoundTrips = 𝒊=𝟏 𝒏 𝒉𝒕𝒕𝒑𝑶𝒃𝒋𝒆𝒄𝒕𝑺𝒊𝒛𝒆𝒊 𝒑𝒂𝒄𝒌𝒆𝒕𝒔𝒊𝒛𝒆 19
  • 20.
  • 21.
     YSlow scalabilitymodel: Browser Render Time  RoundTrips * RTT  Web Browser performs page composition using the Document Object Model, or DOM  YSlow Rule: Make fewer HTTP requests  YSlow Rule: Improve cache effectiveness  YSlow Rule: Reduce the number of DOM elements  YSlow Rule: Compress the objects the page does need to load  Tuning is a process that attempts to drive # RoundTrips  1 RoundTripTime  0 21
  • 22.
     YSlow neveractually measures RTT, but other related tools can  RTT may vary across Requests  Objects can be geographically dispersed  Local cluster, remote, cloud  e.g., referencing 3rd-party, advertising services  TCP adaptive window scaling and other network congestion avoidance strategies  Ignores variability in the execution time of client and server-side code  e.g., sort() a large list of elements, or  a hi-res visualization component that scales nonlinearly with the size of the result set  Compression recommendations can be at odds with good code maintainability practices 22
  • 23.
     Web Browserscreate multiple TCP sessions to download referenced objects in parallel  YSlow Rule: take advantage of parallel sessions by loading scripts last  Accurate rendering of the DOM requires that downloading a Javascript file blocks parallel downloads  Script may add elements to the DOM dynamically, call other scripts or reference additional resources  Browser assumes DOM rendering can only resume after the Javascript code executes Page Load Time = Browser Render Time + Script execution Time + (RoundTrips * RTT)/Sessions 23
  • 24.
     Despite themany complications, the YSlow scalability model has proved very influential  Browser Page Load Time is an end-to-end measurement of service time, which is apt to be correlated with customer satisfaction  see, for example, http://www.slideshare.net/Strangeloopnet/37-lessons-ive- learned-on-the-performance-front-lines  Inspired development of related tools to measure Page Load Time 24
  • 25.
     The YSlowscalability model is useful, but it is not adequate for many web applications 25
  • 26.
     Page Loadtime is a measure of end-to-end response time  Navigation Timing measurements decompose overall response time into Network, Server, and Client (i.e., web browser) components  YSlow is silent:  the scalability of server-side components  the diversity of web client hardware (PCs, tablets, phones) & software (iOS, Android, Windows)  the performance of the client’s network connection  e.g., Internet vs. Intranet connections 26
  • 27.
     Despite themany complications, the YSlow scalability model has proved very influential  Sparked a standardization effort so Javascript developers could access the PLT measurements reliably across Browsers  Creation of standard DOM performance objects that are accessible to Javascript  Finally, now that actual web application performance data is available in the web browser, how do I get that data back to my data center for optimization & capacity planning? 27
  • 28.
    28 Prompt for unload redirect App cache DNS TCPRequest Response Processing load unload DOMContentLoaded navigationStart redirectStart redirectEnd fetchStart domainLookupStart domainLookupEnd connectStart secureConnectionStart connectEnd requestStart responseStart responseEnd loadEventStart loadEventEnd unloadEventStart unloadEventEnd domLoading domInteractive domContentLoadedEventStart domContentLoadedEventEnd domComplete
  • 29.
     Http Request/Responseand Rendering events  Web Performance Working Group  Performance Timeline, Navigation Timing, and High Resolution Time specs  Supported in IE, Chrome, WebKit, and FoxFire  Event timings can be used to calculate:  Network latency (from the standpoint of the web client)  Page Render time (once the page components are received from the server)  Entire sequence from navigation to page load completion: 29Navigation Timing spec: https://dvcs.w3.org/hg/webperf/raw-file/tip/specs/NavigationTiming/Overview.html#processing-model
  • 30.
     Calculate networklatency: responseEnd - fetchStart 30
  • 31.
    Calculate Page RenderTime: loadEventEnd - responseEnd 31
  • 32.
  • 33.
     see https://developer.mozilla.org/ 33 <html> <head> <scripttype="text/javascript"> // Add load event listener. window.addEventListener("load", loadTime, false); function loadTime() { // Get current time. var now = window.performance.now(); // Calculate page load time. var page_load_time = now - performance.timing.navigationStart; // Write the load time to the F12 console. if (window.console) console.log(page_load_time); } </script> </head><body> <!- Main page body is here. --> </body> </html>
  • 34.
     Now thatactual web application performance data is available in the web browser, how do I get that data back from the web client?  What about the volume of measurement data that requires processing & analysis?  Google Analytics uses web beacons to send the response time data to Google’s data center for analysis and reporting  Yahoo Boomerang project can be used to send web beacons with the data back to your data center 34
  • 35.
     Architecture ofan ASP.NET application  Windows OS  TCP/IP  (Clustered) IIS front end Web Servers  ASP.NET  .NET CLR  ADO.NET (data layer) 35
  • 36.
     Dynamic HTMLis session-oriented behavior layered on top of the HTTP  Web applications require state  Who you are  Where you are (mobile apps)  They preserve state:  During a session  TCP protocol is session-oriented  Requires a connection  Calculates RTT per connection (used in re-try logic)  Between sessions (using cookies, etc.) 36
  • 37.
     Server-side Requestprocessing  Event-oriented programming model (Postback)  HttpContext wrapper around the HTTP Request  Persistent State  ViewState  Session State  Application and Page Cache objects  etc. 37
  • 38.
    38 IIS Architecture User Kernel HTTP TCP IP Network Interface HTTP KernelMode Driver (http.sys) HTTP Response Cache (Physical Memory) LSSAS Windows Authentication SSL Inetinfo IIS Administration FTP Metabase SMTP NNTP SVCHOST W3SVC W3wp W3wp Mscoree.dll http <code-behind>.dll Default.aspx Application Pool W3wp W3wp Mscoree.dll <code-behind>.dll Default.aspx Application Pool WAS Cache net.tcp net.tcp http
  • 39.
     HttpApplication EventHandlers (IHttpModule) Event Event BeginRequest PreRequestHandlerExecute AuthenticateRequest PostRequestHandlerExecute PostAuthenticateRequest ReleaseRequestState AuthorizeRequest PostReleaseRequestState PostAuthorizeRequest PostMapRequestHandler ResolveRequestCache PostMapRequestHandler PostResolveRequestCache PostMapRequestHandler MapRequestHandler UpdateRequestCache PostMapRequestHandler PostUpdateRequestCache AcquireRequestState LogRequest PostAcquireRequestState EndRequest 39
  • 40.
     Extends theASP.NET event model to all Http Requests  HttpApplication Event Handlers (IHttpModule) 40 public class BoomerangBeacon : IHttpModule { public MyHttpModule() {} public void Dispose() {} public void Init(HttpApplication application) { application.BeginRequest += (new EventHandler(this.Application_BeginRequest)); } }
  • 41.
    w3wp.exe Common Language Runtime(CLR) JIT compiler Garbage Collection threads mscoree.dll mscorsvr.dllMyApp.dll 41
  • 42.
     Many, manyWindows components are instrumented with ETW  Kernel objects include disk IO, process, thread, paging, CPU  TCP/IP, HttpServer, CLR  Providers may issue a current status Rundown  CallStacks can be captured  Event correlation:  CPU ID, Process ID, Thread ID, File Handle, Tcp Session ID (Port) 42
  • 43.
     Many obstaclesto using trace-based instrumentation effectively in performance investigations  Sheer volume of trace data that can be generated (e.g., OS Dispatcher ContextSwitch events)  Cannot always be filtered effectively  Very little documentation on specific events and how they are logically related  Inconsistent semantics (but only a few common patterns)  Sequence: Begin, Step, End  StateChange(oldState, newState)  Fork:Join  Send:Receive  etc. 43
  • 44.
     Resource Monitor Windows Performance tools (aka xperf)  VS Profiler’s Concurrency Visualizer  inspired by Rico Mariani’s ETLStackBrowser program  leveraged Vance Morrison’s TraceEvent .NET libray  and, introducing the Web Application Trace Explorer  Gathers, analyzes, filters & reports on server-side events from TcpIP, HttpServer, and instrumented application Scenarios, plus Boomerang Beacon data from web clients  Designed to help explore the semantics of these sparsely documented event streams 44
  • 45.
     IHttpModule to interceptthe Boomerang beacon requests and turn them into ETW events 45 private void Application_BeginRequest(Object source, EventArgs e) { // Create HttpApplication and HttpContext objects to access // request and response properties. HttpApplication application = (HttpApplication)source; HttpContext context = application.Context; string beaconUrl = GetBeaconUrl(); // Helper routine for beacon url string filePath = context.Request.FilePath; string fileExtension = VirtualPathUtility.GetExtension(filePath); if (fileExtension.Equals(".gif")) { if (filePath.Contains(beaconUrl)) { ... // Process the beacon parms application.Response.End(); } } }
  • 46.
    Demo using sample datafrom webscorer.com 46
  • 47.
  • 48.
  • 49.
  • 50.
  • 51.
     Boomerang beaconsupport  Add the boomerang.js script to your web page HTML:  Initialize boomerang: 51 <script src="javascriptBoomerangboomerang.js" type="text/javascript"></script> <script src="javascriptBoomerangplug-insnavtiming.js" type="text/javascript"></script> <script src="javascriptBoomerangplug-insrt.js" type="text/javascript"></script <script lang="javascript"> BOOMR.init({beacon_url: "boomerang.gif"}); </script>
  • 52.
     Boomerang beaconsupport  Add the BoomerangBeacon HttpModule from MeasurementWareWebServices.dll to web.config 52 <system.webServer> <modules> <add name="MeasurementWareWebServices“ type="MeasurementWareWebServices.BoomerangBeacon"/> </modules> </system.webServer>
  • 53.
     BoomerangBeacon class derives from IHttpModule  adds an EventHandler for HttpApplication.BeginRequest  In the BeginRequest event handler,  intercepts the boomerang.gif GET Requests  parse the beacon parms  generate a MeasurementWareWeb ETW event whose payload includes  Page Load Time measurements  plus, IP Address and Tcp Port (unique session ID) of the Sender for correlation with other HttpServer and TcpIP events 53
  • 54.
  • 55.
  • 56.
  • 57.
     Initial stageof the work to add Boomerang beacon data to the event collection and the displays is functionally complete  Prototype real-time collector that reports HTTP Response time measurements (by URL) as Windows performance counters is currently available  Contact me if your org is interested in participating  markf@demandtech.com  See my blog at http://computerperformancebydesign.com for the latest status (until it reaches the Release to github stage) 57
  • 58.