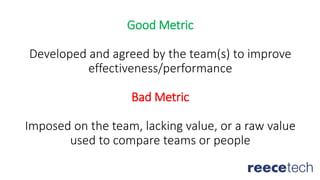
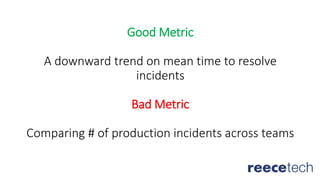
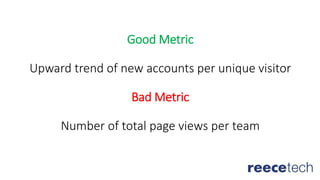
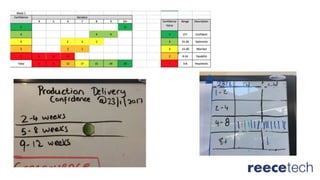
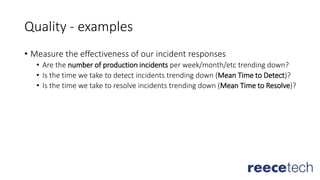
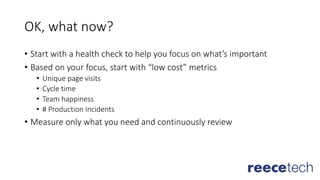
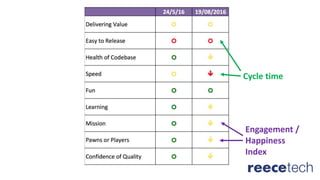
Measuring for Team
Effectiveness
a.k.a data-driven continuous improvement
a.k.a metrics you’ll love
Why measure anything?
Metric
A data point within context. Metrics are
derived from measurements.
For example, our average cycle time is 5 days
and we want it to trend down.
Good Metric
Developed and agreed by the team(s) to improve
effectiveness/performance
Bad Metric
Imposed on the team, lacking value, or a raw value
used to compare teams or people
Good Metric
A downward trend on mean time to resolve
incidents
Bad Metric
Comparing # of production incidents across teams
Good Metric
Upward trend of new accounts per unique visitor
Bad Metric
Number of total page views per team
“When a measure becomes a target, it ceases to be a good measure” – Goodhart’s Law
“Measures tend to be corrupted/gamed when used for target-setting” - Campbell’s Law
“Monitoring a metric may subtly influence people to maximize that measure” – The Observer Effect
(via https://www.industriallogic.com/blog/what-should-we-measure/)
Getting good at measuring is not the point,
Getting good through measuring is.
A good metric is an indicator of where a team could focus improvement efforts and the impact
those efforts are having.
So don’t measure everything, focus on one or two important things.
Put an expiry date on your metrics so you constantly reassess their value.
There’s more to lean/agile metrics than cycle time,
so let’s look at some examples in some key areas.
Remember: YMMV!
Most metrics address 3 areas…
…are we building the right thing?
…are we building the thing right?
…are we building the thing in a sustainable way?
Building the right thing
• We go faster as a whole by building the wrong thing less often
• How do we know we aren’t building the wrong thing?
• How do you know your work is adding value to customers’ lives?
Building the right thing
• Think about how engaged customers behave:
• They use your product;
• They keep coming back;
• They refer their friends or colleagues;
• They pay for your product;
• They leave positive reviews.
Building the right thing - examples
• Pirate metrics!
• AARRR (Acquisition, Activation, Retention, Referral, Revenue)
• NPS
• User insights (app ratings, in-product surveys)
Building the right thing - examples
• Other examples?
Building the thing right
• We want to be responsive to change
• We want to eliminate waste
• We want to know how we are progressing
Building the thing right
• We want to be responsive to change
• Short lead times
• Frequent/continuous delivery
• Flow
• We want to eliminate waste
• Reduce failure demand and non-value add processes
• We want to know where we are
• Progress
Responsive to change - examples
• Lead and cycle time
• Frequency of deployment
• Tact time
• Throughput
• Cumulative flow
Eliminate waste
• What is waste in this context?
• Activities leading to a sub-optimal system
• For example, unnecessary hand-offs or process gates
• Activities that do not add to the value stream
• For example, unnecessary documentation
• 3 wastes of lean thinking
Eliminate waste - examples
• Value stream mapping
• Reduce time spent in non-value add activities
• For example, time spent sizing stories
• Failure demand
• Demand for effort due to something not working or not being done
• Reduce time spent on failure demand
• For example, time spent on fixing bugs
• For example, time spent on fixing broken build pipelines
"You could have a timer go off a dozen times per day and record whether you were a) wasting time, b) working
on new stuff, or c) fixing stuff that should have been done correctly the first time. If the team does that for a
week, a picture will start to emerge. After a month, you'll know how much of your capacity is spent on failure
demand”
Kent Beck
Progress - examples
• Impact on customer success metrics
• For example, this iteration led to a 20% increase in new accounts
• For example, this iteration led to an increase in NPS
• Empirical forecasting using #noestimates techniques
• Process control charts and throughput
• Release confidence
Building the thing in a sustainable way
• Sustainable refers to people and systems
• We need healthy teams to build great products
• We need high quality products to create happy customers
Team Health - examples
• Safety checks
Team Health - examples
• Safety checks
• Happiness indicators
Team Health - examples
• Safety checks
• Happiness indicators
• Feedback matrix
Team Health - examples
• Safety checks
• Happiness indicators
• Feedback matrix
• Engagement
Team Health - examples
• Safety checks
• Happiness indicators
• Feedback matrix
• Engagement
• Team health checks
Quality
• Measure our confidence in the quality of our systems and code
• Measure the effectiveness of our incident responses
• Others?
Quality – examples
• Measure our confidence in the quality of our systems and code
• Quantitative:
• System health checks & monitoring (load times, CPU, etc)
• Test coverage
• Other quantitative code quality metrics (eg using code analysis tools)
• Qualitative
• System confidence (team ratings for maintainability, readability, other –abilities)
• Test confidence
Quality - examples
• Measure the effectiveness of our incident responses
• Are the number of production incidents per week/month/etc trending down?
• Is the time we take to detect incidents trending down (Mean Time to Detect)?
• Is the time we take to resolve incidents trending down (Mean Time to Resolve)?
OK, what now?
OK, what now?
• Start with a health check to help you focus on what’s important
• Based on your focus, start with “low cost” metrics
• Unique page visits
• Cycle time
• Team happiness
• # Production Incidents
• Measure only what you need and continuously review
Cycle time
Engagement /
Happiness
Index

Measuring for team effectiveness (with Reecetech)

  • 1.
    Measuring for Team Effectiveness a.k.adata-driven continuous improvement a.k.a metrics you’ll love
  • 2.
  • 4.
    Metric A data pointwithin context. Metrics are derived from measurements. For example, our average cycle time is 5 days and we want it to trend down.
  • 5.
    Good Metric Developed andagreed by the team(s) to improve effectiveness/performance Bad Metric Imposed on the team, lacking value, or a raw value used to compare teams or people
  • 6.
    Good Metric A downwardtrend on mean time to resolve incidents Bad Metric Comparing # of production incidents across teams
  • 7.
    Good Metric Upward trendof new accounts per unique visitor Bad Metric Number of total page views per team
  • 8.
    “When a measurebecomes a target, it ceases to be a good measure” – Goodhart’s Law “Measures tend to be corrupted/gamed when used for target-setting” - Campbell’s Law “Monitoring a metric may subtly influence people to maximize that measure” – The Observer Effect (via https://www.industriallogic.com/blog/what-should-we-measure/)
  • 9.
    Getting good atmeasuring is not the point, Getting good through measuring is.
  • 10.
    A good metricis an indicator of where a team could focus improvement efforts and the impact those efforts are having. So don’t measure everything, focus on one or two important things. Put an expiry date on your metrics so you constantly reassess their value.
  • 11.
    There’s more tolean/agile metrics than cycle time, so let’s look at some examples in some key areas. Remember: YMMV!
  • 12.
    Most metrics address3 areas… …are we building the right thing? …are we building the thing right? …are we building the thing in a sustainable way?
  • 13.
  • 14.
    Building the rightthing • We go faster as a whole by building the wrong thing less often • How do we know we aren’t building the wrong thing? • How do you know your work is adding value to customers’ lives?
  • 15.
    Building the rightthing • Think about how engaged customers behave: • They use your product; • They keep coming back; • They refer their friends or colleagues; • They pay for your product; • They leave positive reviews.
  • 16.
    Building the rightthing - examples • Pirate metrics! • AARRR (Acquisition, Activation, Retention, Referral, Revenue) • NPS • User insights (app ratings, in-product surveys)
  • 17.
    Building the rightthing - examples • Other examples?
  • 18.
  • 19.
    Building the thingright • We want to be responsive to change • We want to eliminate waste • We want to know how we are progressing
  • 20.
    Building the thingright • We want to be responsive to change • Short lead times • Frequent/continuous delivery • Flow • We want to eliminate waste • Reduce failure demand and non-value add processes • We want to know where we are • Progress
  • 21.
    Responsive to change- examples • Lead and cycle time • Frequency of deployment • Tact time • Throughput • Cumulative flow
  • 23.
    Eliminate waste • Whatis waste in this context? • Activities leading to a sub-optimal system • For example, unnecessary hand-offs or process gates • Activities that do not add to the value stream • For example, unnecessary documentation • 3 wastes of lean thinking
  • 24.
    Eliminate waste -examples • Value stream mapping • Reduce time spent in non-value add activities • For example, time spent sizing stories • Failure demand • Demand for effort due to something not working or not being done • Reduce time spent on failure demand • For example, time spent on fixing bugs • For example, time spent on fixing broken build pipelines
  • 25.
    "You could havea timer go off a dozen times per day and record whether you were a) wasting time, b) working on new stuff, or c) fixing stuff that should have been done correctly the first time. If the team does that for a week, a picture will start to emerge. After a month, you'll know how much of your capacity is spent on failure demand” Kent Beck
  • 26.
    Progress - examples •Impact on customer success metrics • For example, this iteration led to a 20% increase in new accounts • For example, this iteration led to an increase in NPS • Empirical forecasting using #noestimates techniques • Process control charts and throughput • Release confidence
  • 28.
    Building the thingin a sustainable way
  • 29.
    Building the thingin a sustainable way • Sustainable refers to people and systems • We need healthy teams to build great products • We need high quality products to create happy customers
  • 30.
    Team Health -examples • Safety checks
  • 31.
    Team Health -examples • Safety checks • Happiness indicators
  • 33.
    Team Health -examples • Safety checks • Happiness indicators • Feedback matrix
  • 34.
    Team Health -examples • Safety checks • Happiness indicators • Feedback matrix • Engagement
  • 35.
    Team Health -examples • Safety checks • Happiness indicators • Feedback matrix • Engagement • Team health checks
  • 37.
    Quality • Measure ourconfidence in the quality of our systems and code • Measure the effectiveness of our incident responses • Others?
  • 38.
    Quality – examples •Measure our confidence in the quality of our systems and code • Quantitative: • System health checks & monitoring (load times, CPU, etc) • Test coverage • Other quantitative code quality metrics (eg using code analysis tools) • Qualitative • System confidence (team ratings for maintainability, readability, other –abilities) • Test confidence
  • 39.
    Quality - examples •Measure the effectiveness of our incident responses • Are the number of production incidents per week/month/etc trending down? • Is the time we take to detect incidents trending down (Mean Time to Detect)? • Is the time we take to resolve incidents trending down (Mean Time to Resolve)?
  • 40.
  • 41.
    OK, what now? •Start with a health check to help you focus on what’s important • Based on your focus, start with “low cost” metrics • Unique page visits • Cycle time • Team happiness • # Production Incidents • Measure only what you need and continuously review
  • 42.

Editor's Notes

  • #5 How do we get better at what we do if we don’t improve? How do we know we are improving if we don’t measure? Even gut-feel is a mental measure. Let’s make it explicit, visualise it and radiate it.
  • #16 These three things will help us go faster in the long term
  • #20 Acquisition – number of new users, use visitor data Activation – how users engage for the first time, use things like multiple page visits, new account sign ups Retention – how often they keep coming back (stickiness), use repeat visits, session lengths Referral – how often users refer new users to your product, how depends on the mechanism (refer a buddy, sign up bonuses) Revenue – how much revenue is attributed to your product, how depends on the revenue model. Revenue for “back office” teams – how much time do users save using your product? Does it allow more sales to be processed?
  • #21 NPS via surveys Review ratings
  • #27 Muda is any wasteful activity. We can think about non-value add activities (with caveats). This is what we’re focusing on in the next couple of slides. Mura is waste due to unevenness (lack of predictable flow) which we have touched on with metrics around flow. Muri is the waste of overburden (unnecessary stress) which we will address shortly.