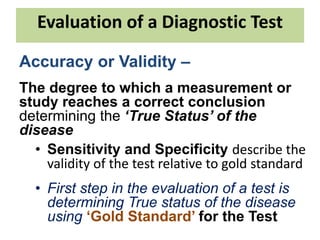
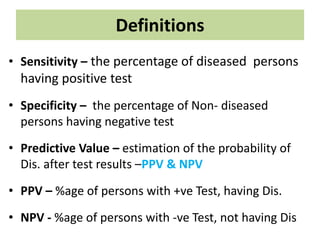
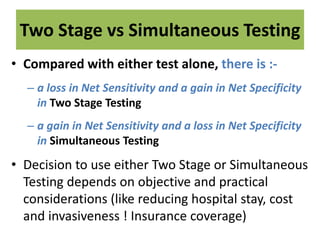
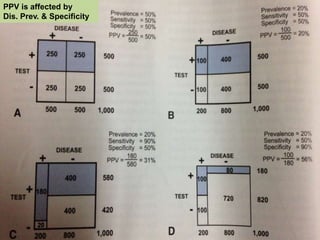
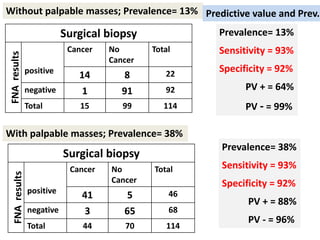
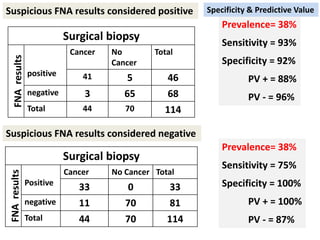
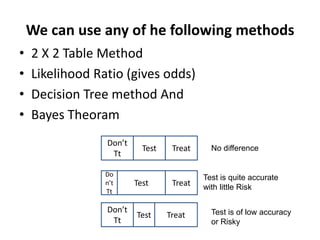
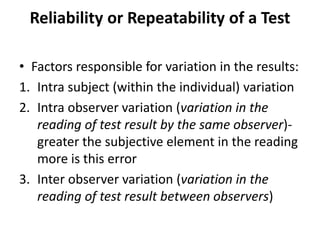
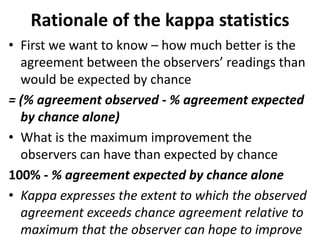
This document discusses the evaluation of diagnostic tests. It defines key terms used to evaluate tests such as sensitivity, specificity, predictive values, and likelihood ratios. It provides examples of evaluating a fine needle aspiration test for breast cancer using these measures. The document also discusses how prevalence of a disease can impact predictive values and compares two-stage versus simultaneous testing approaches.
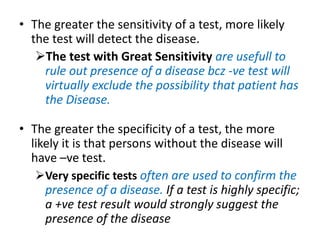
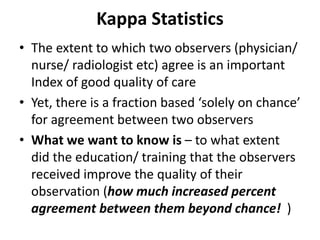
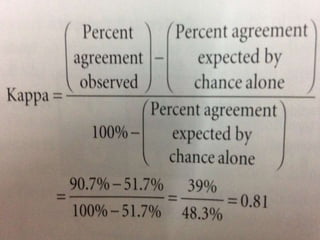
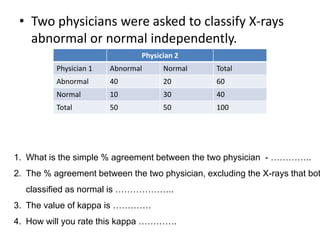
![• Kappa =
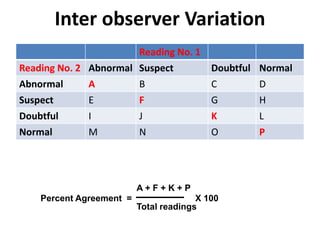
[Percent Agreement
Observed]
[Percent Agreement
expected by chance alone]
-
[Percent Agreement
expected by chance alone]
100% -
Landis and Koch suggested that :-
kappa greater than 0.75 = excellent agreement
Kappa of 0.40 to 0.75 = intermediate to good agreement](https://image.slidesharecdn.com/78screeninganddiagnostictesting-210522014537/85/screening-and-diagnostic-testing-29-320.jpg)


![[Workshop] The science of screening in Psycho-oncology (Oct10)](https://cdn.slidesharecdn.com/ss_thumbnails/workshop1-scienceofscreeningv4a-101024034333-phpapp02-thumbnail.jpg?width=640&height=640&fit=bounds)


