Download as PDF, PPTX
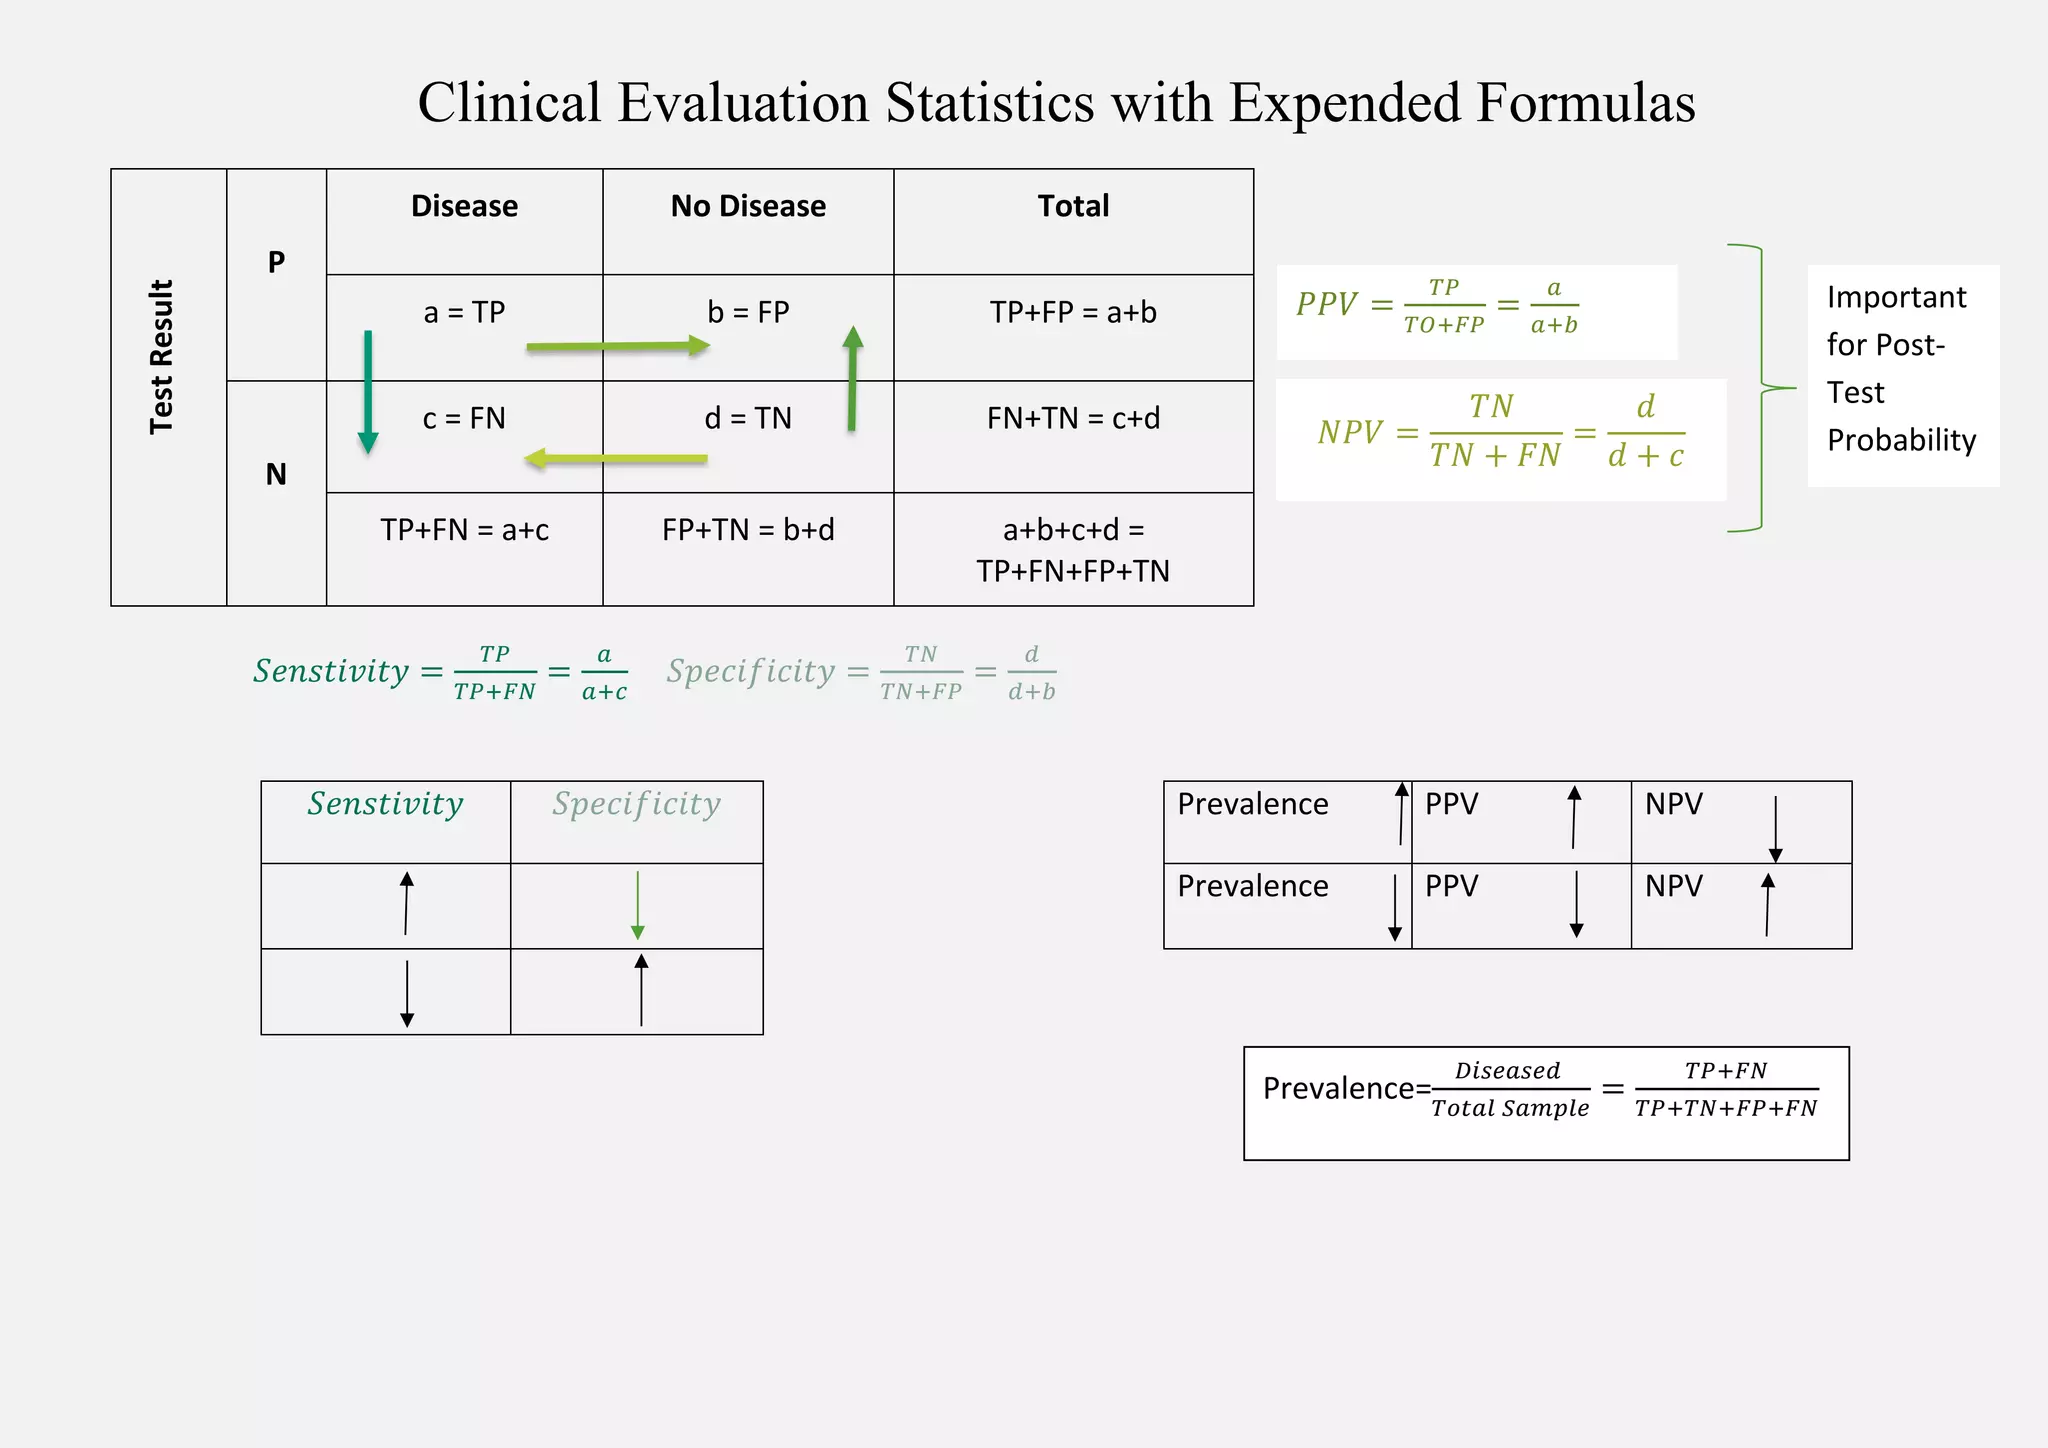
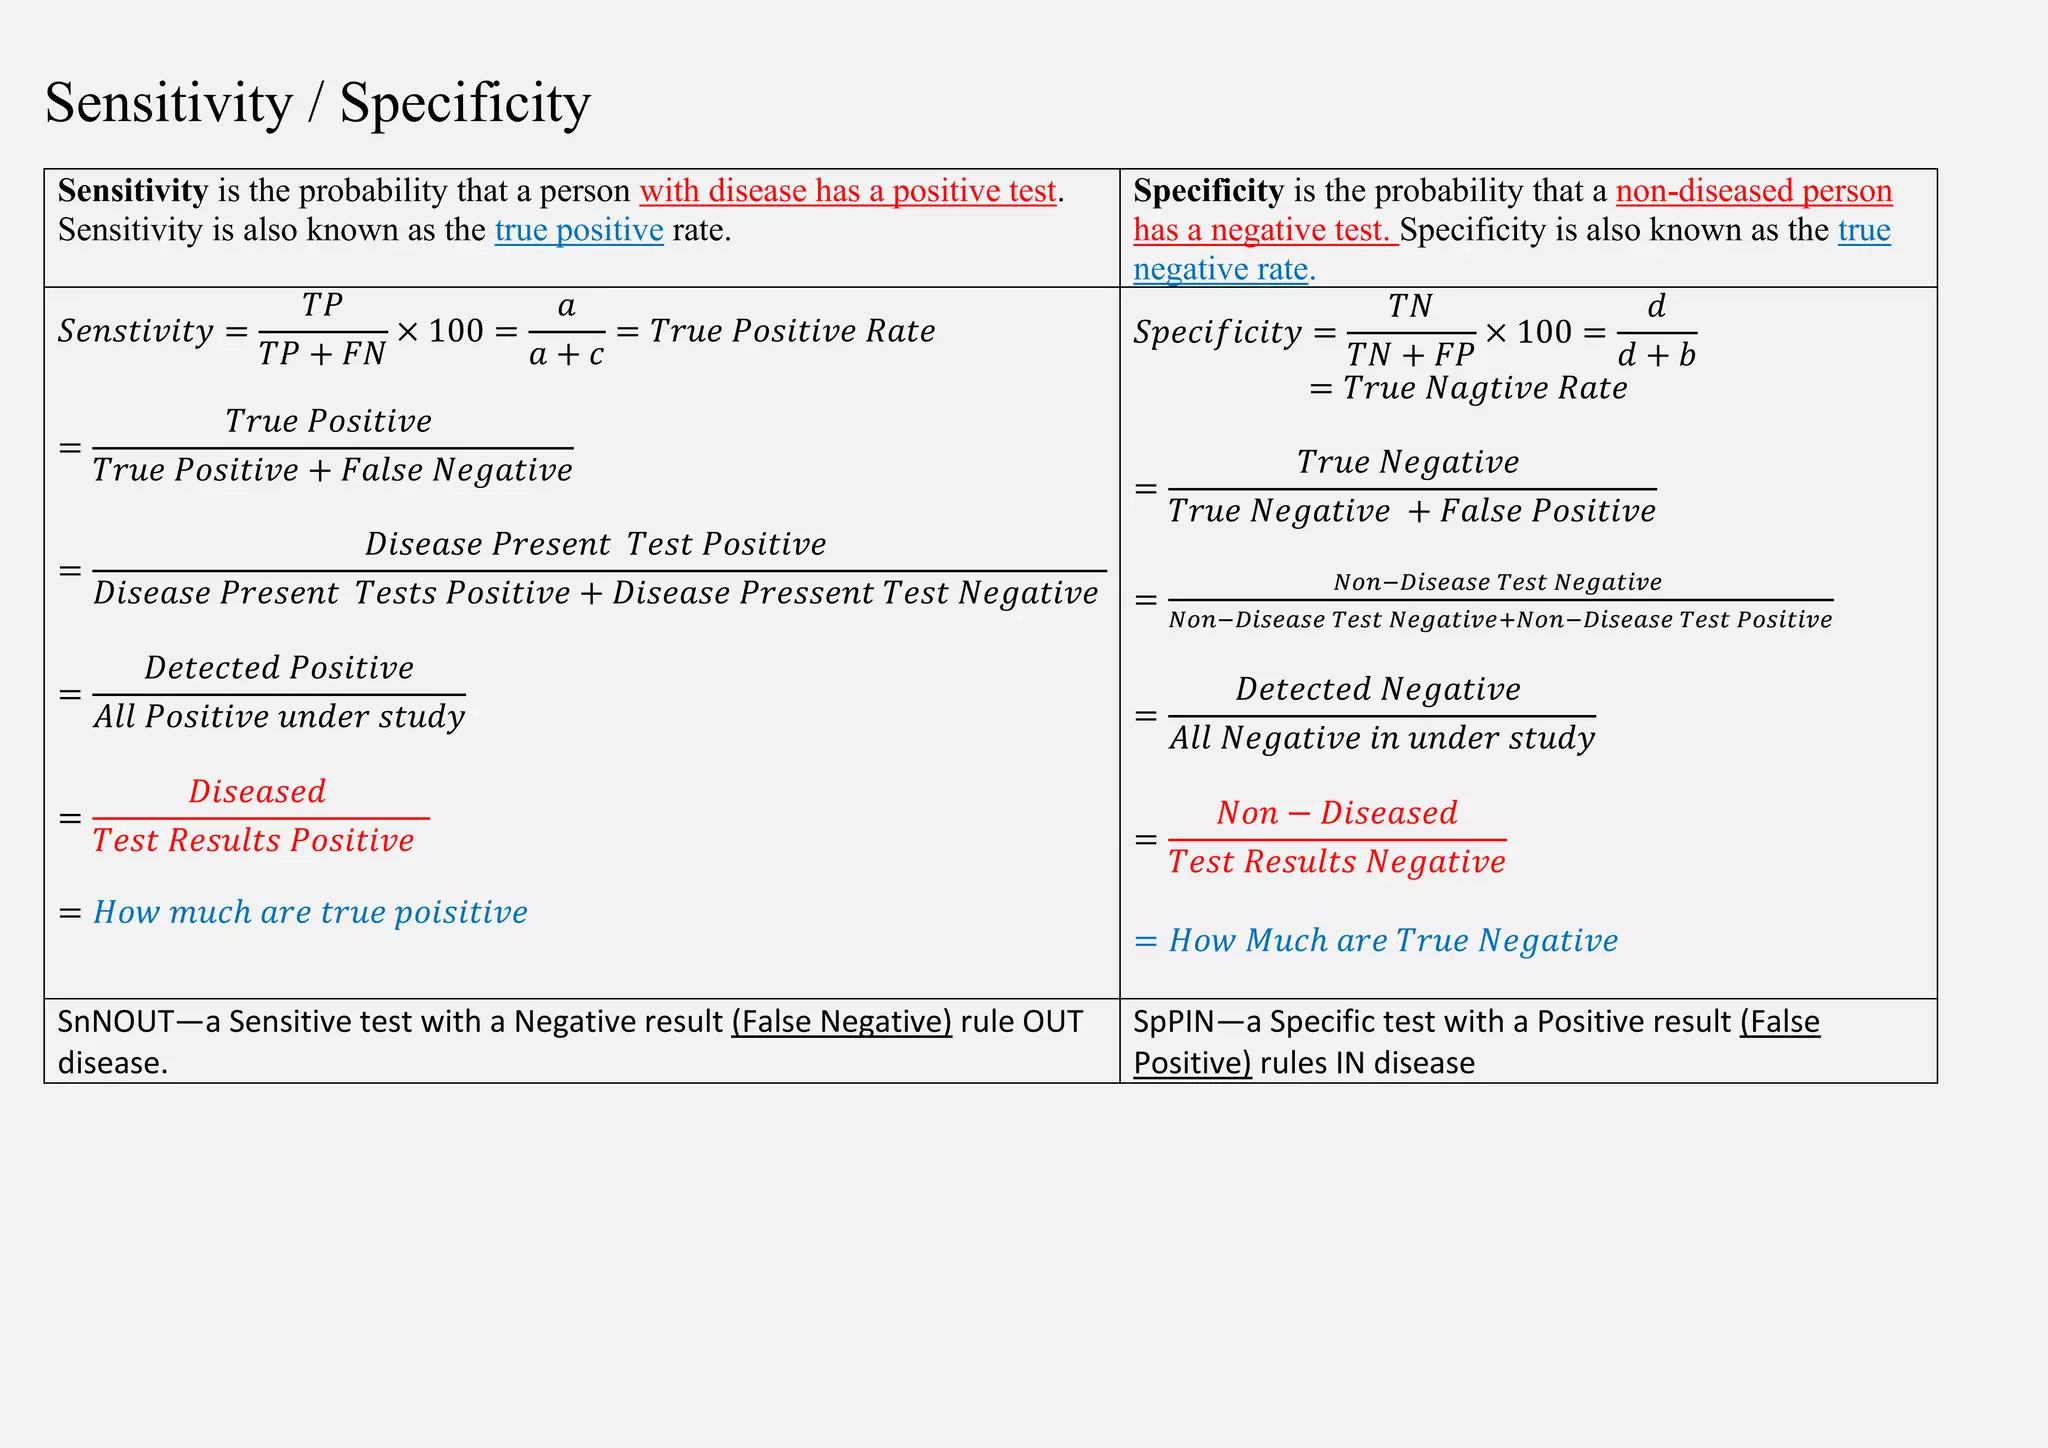
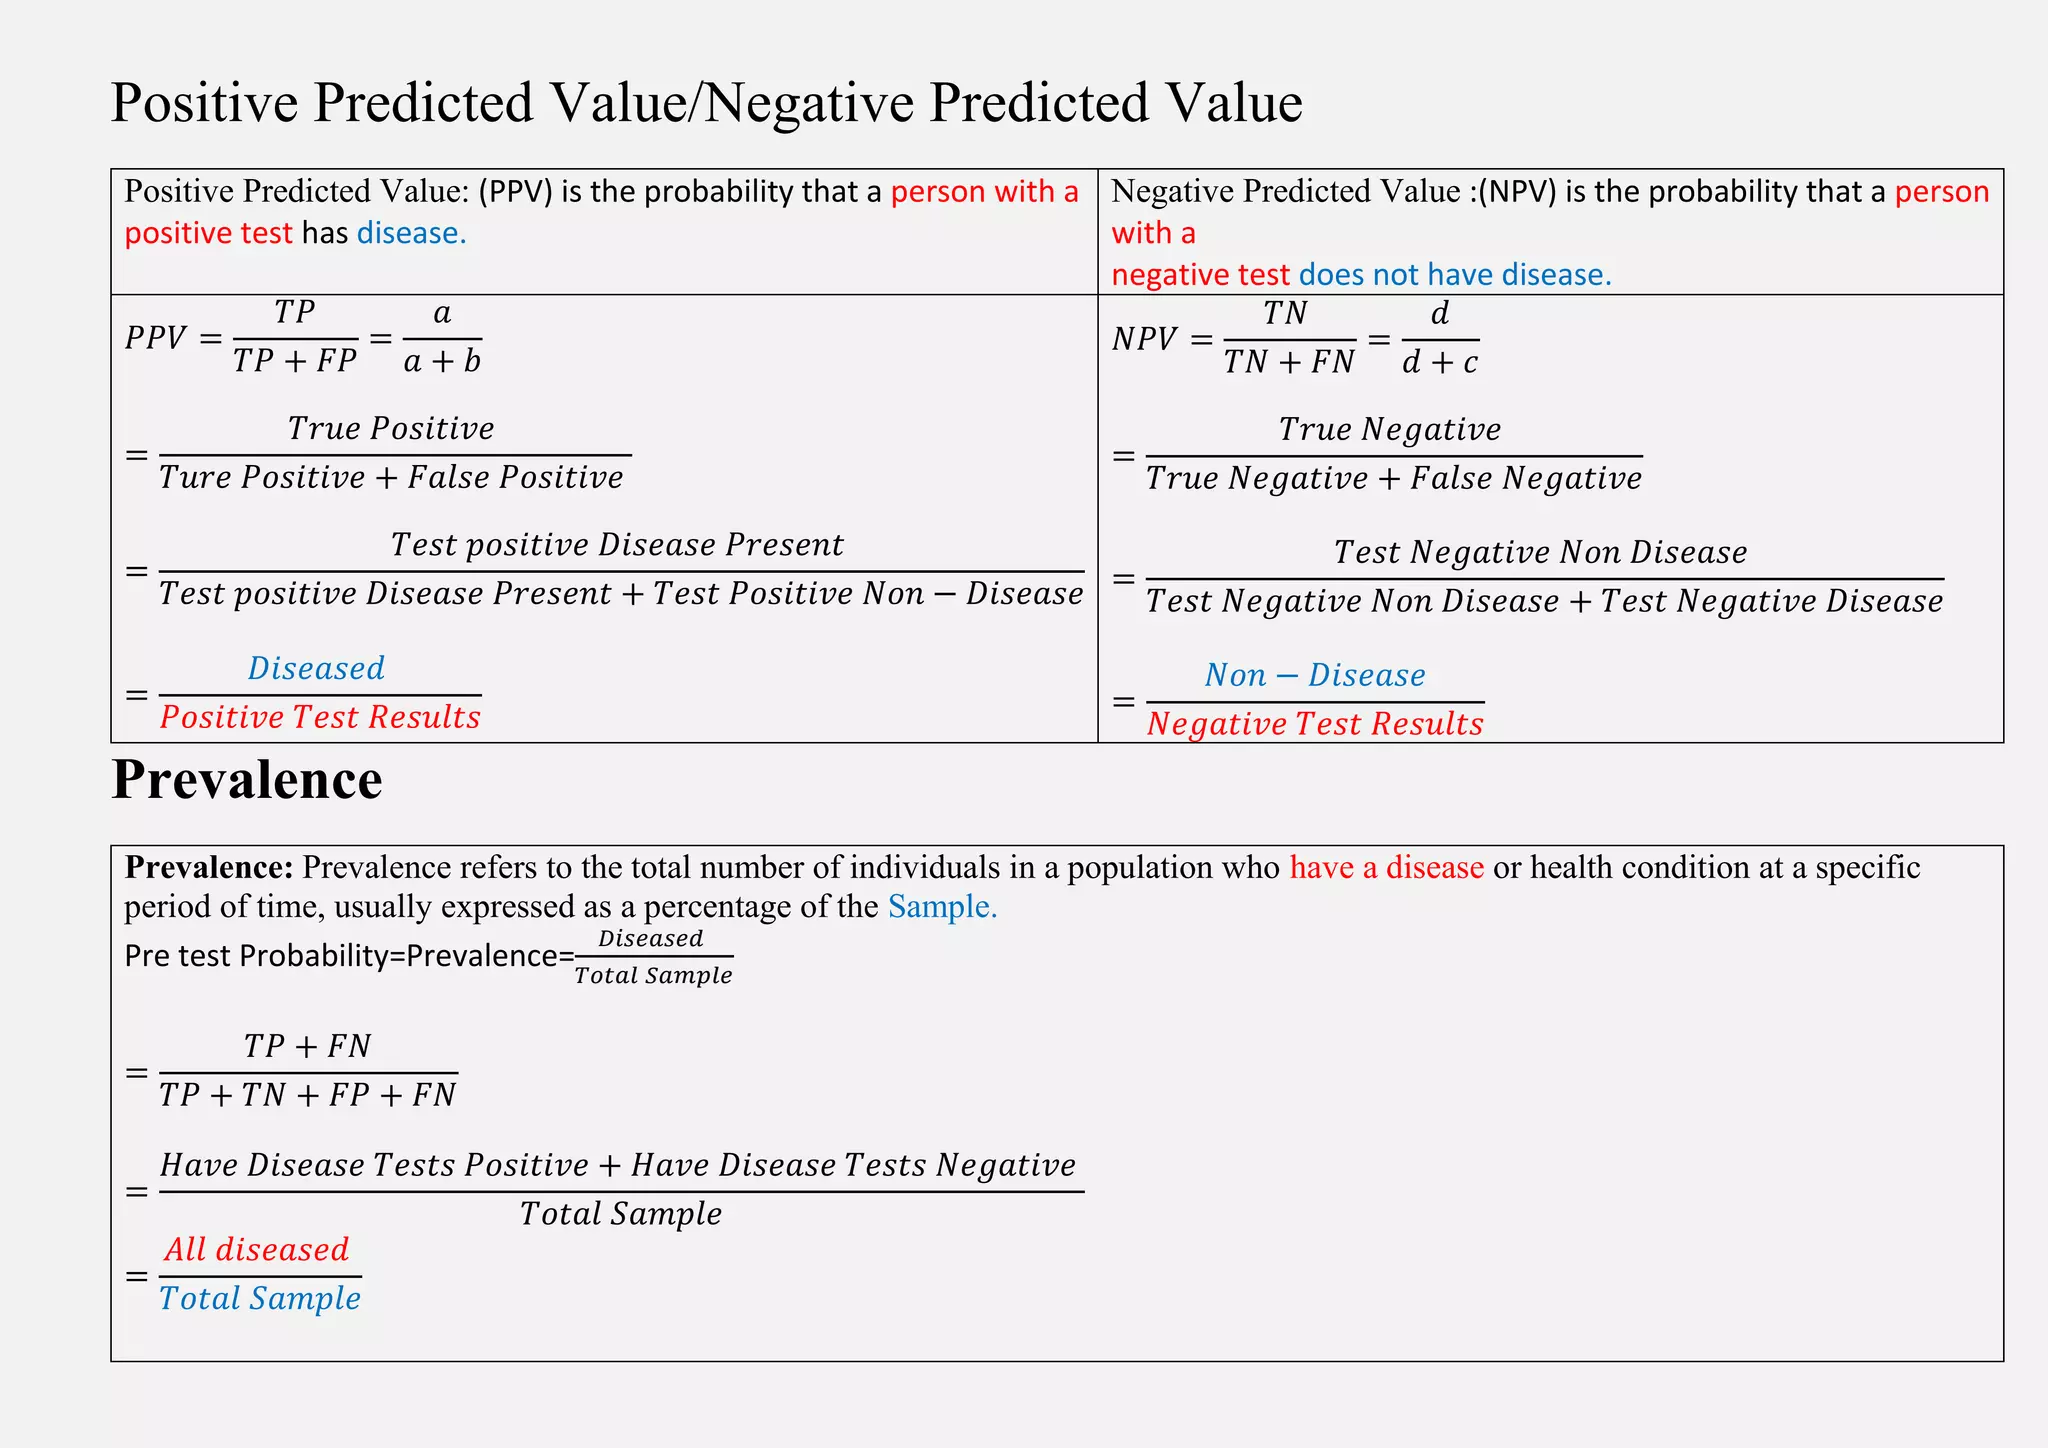

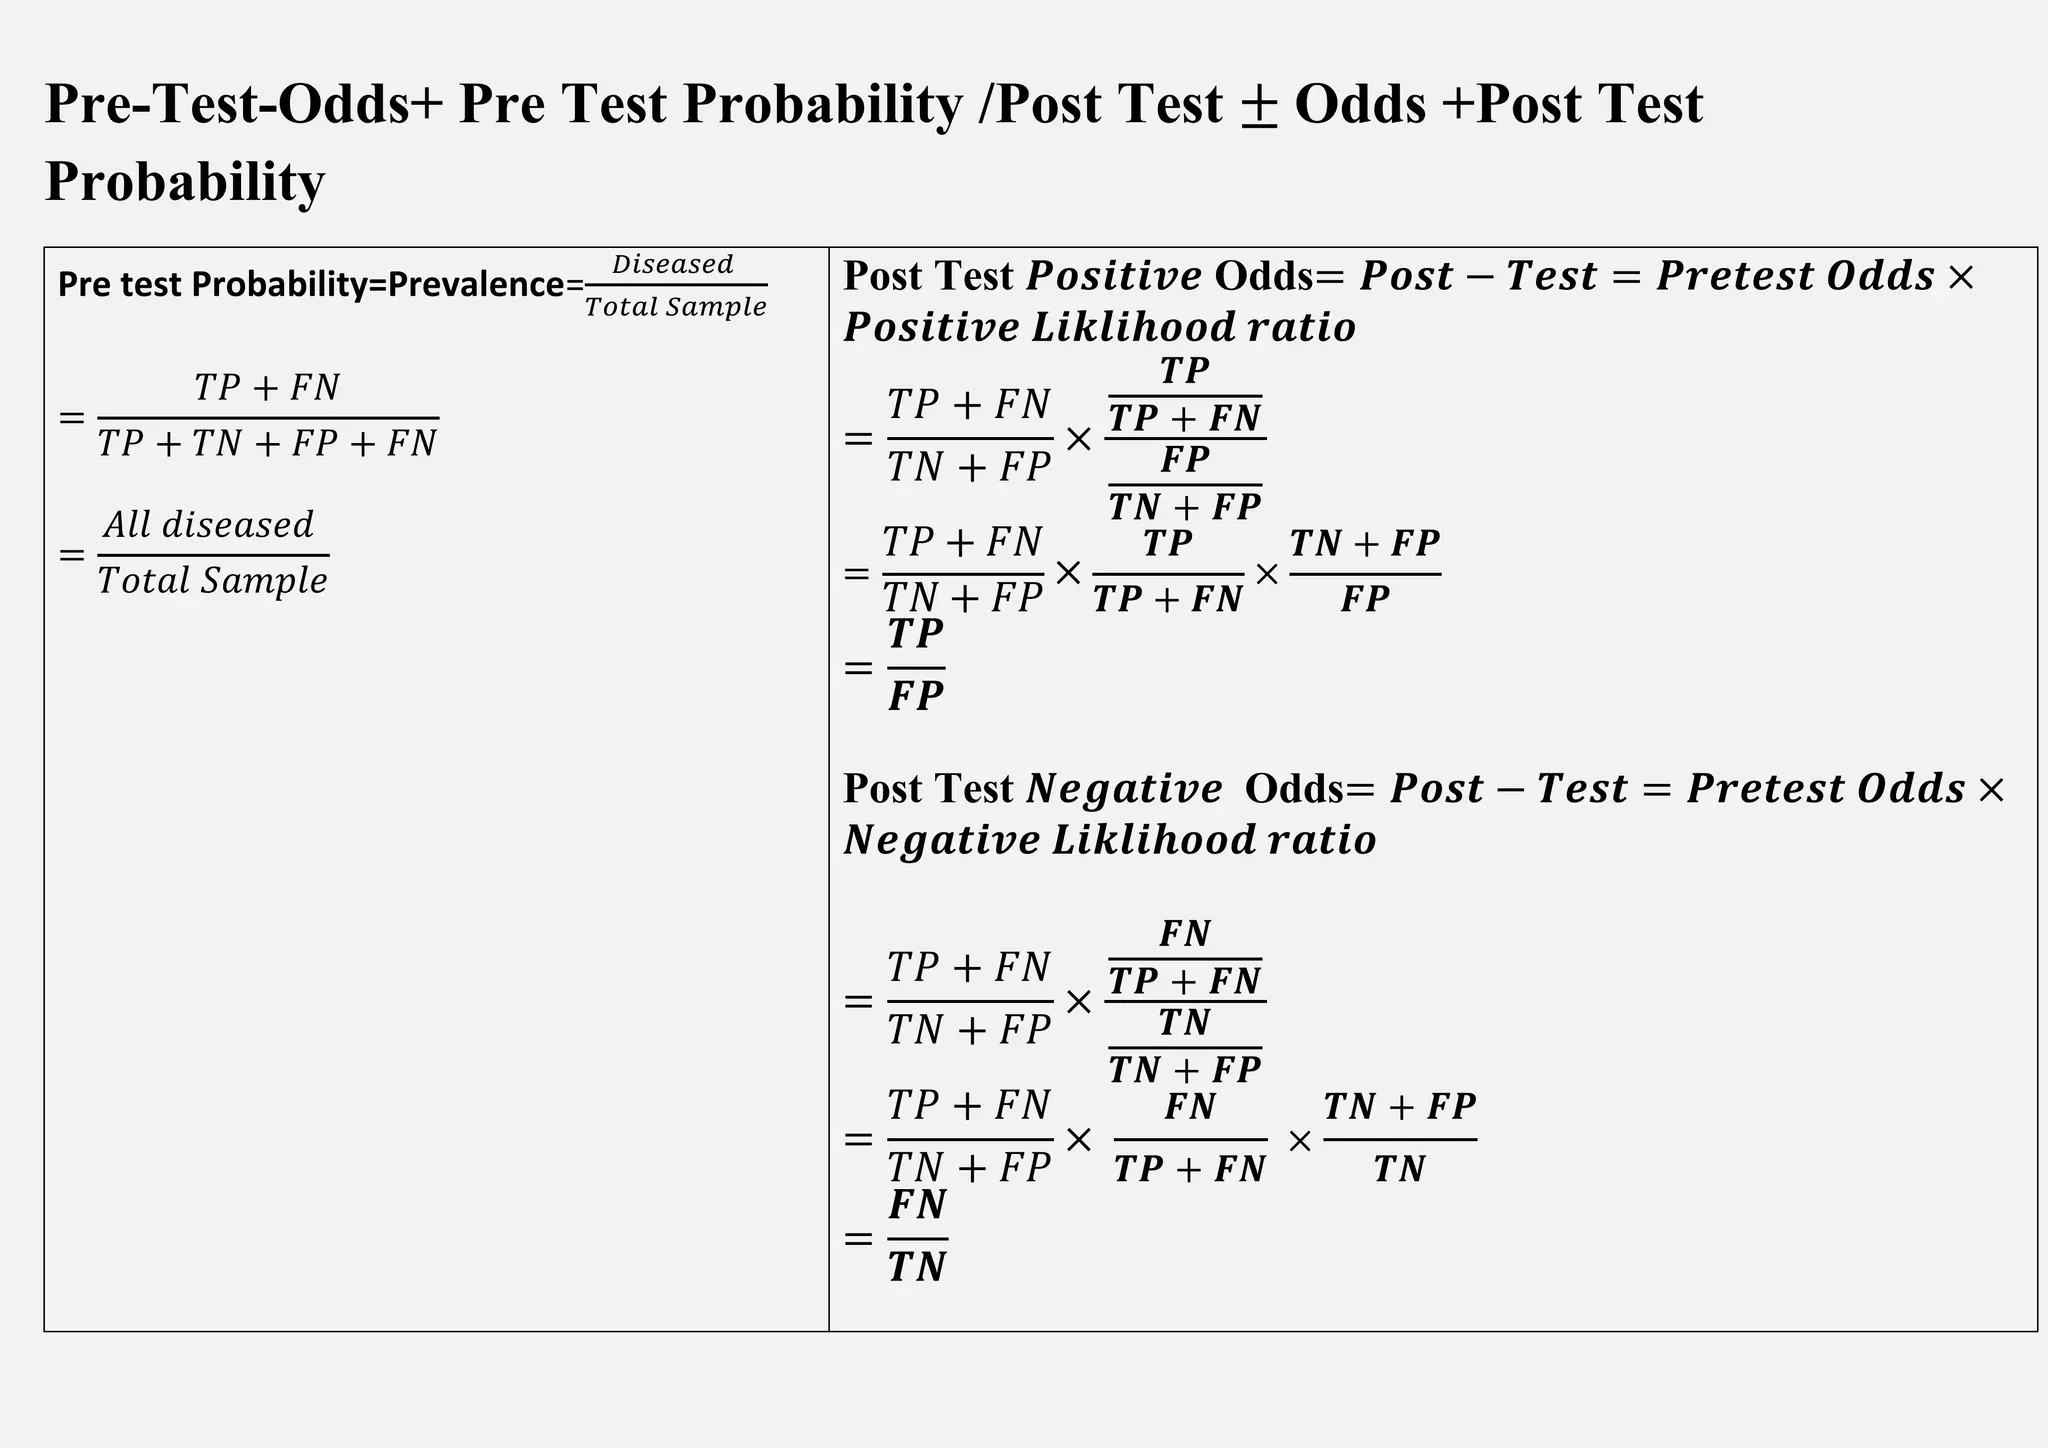
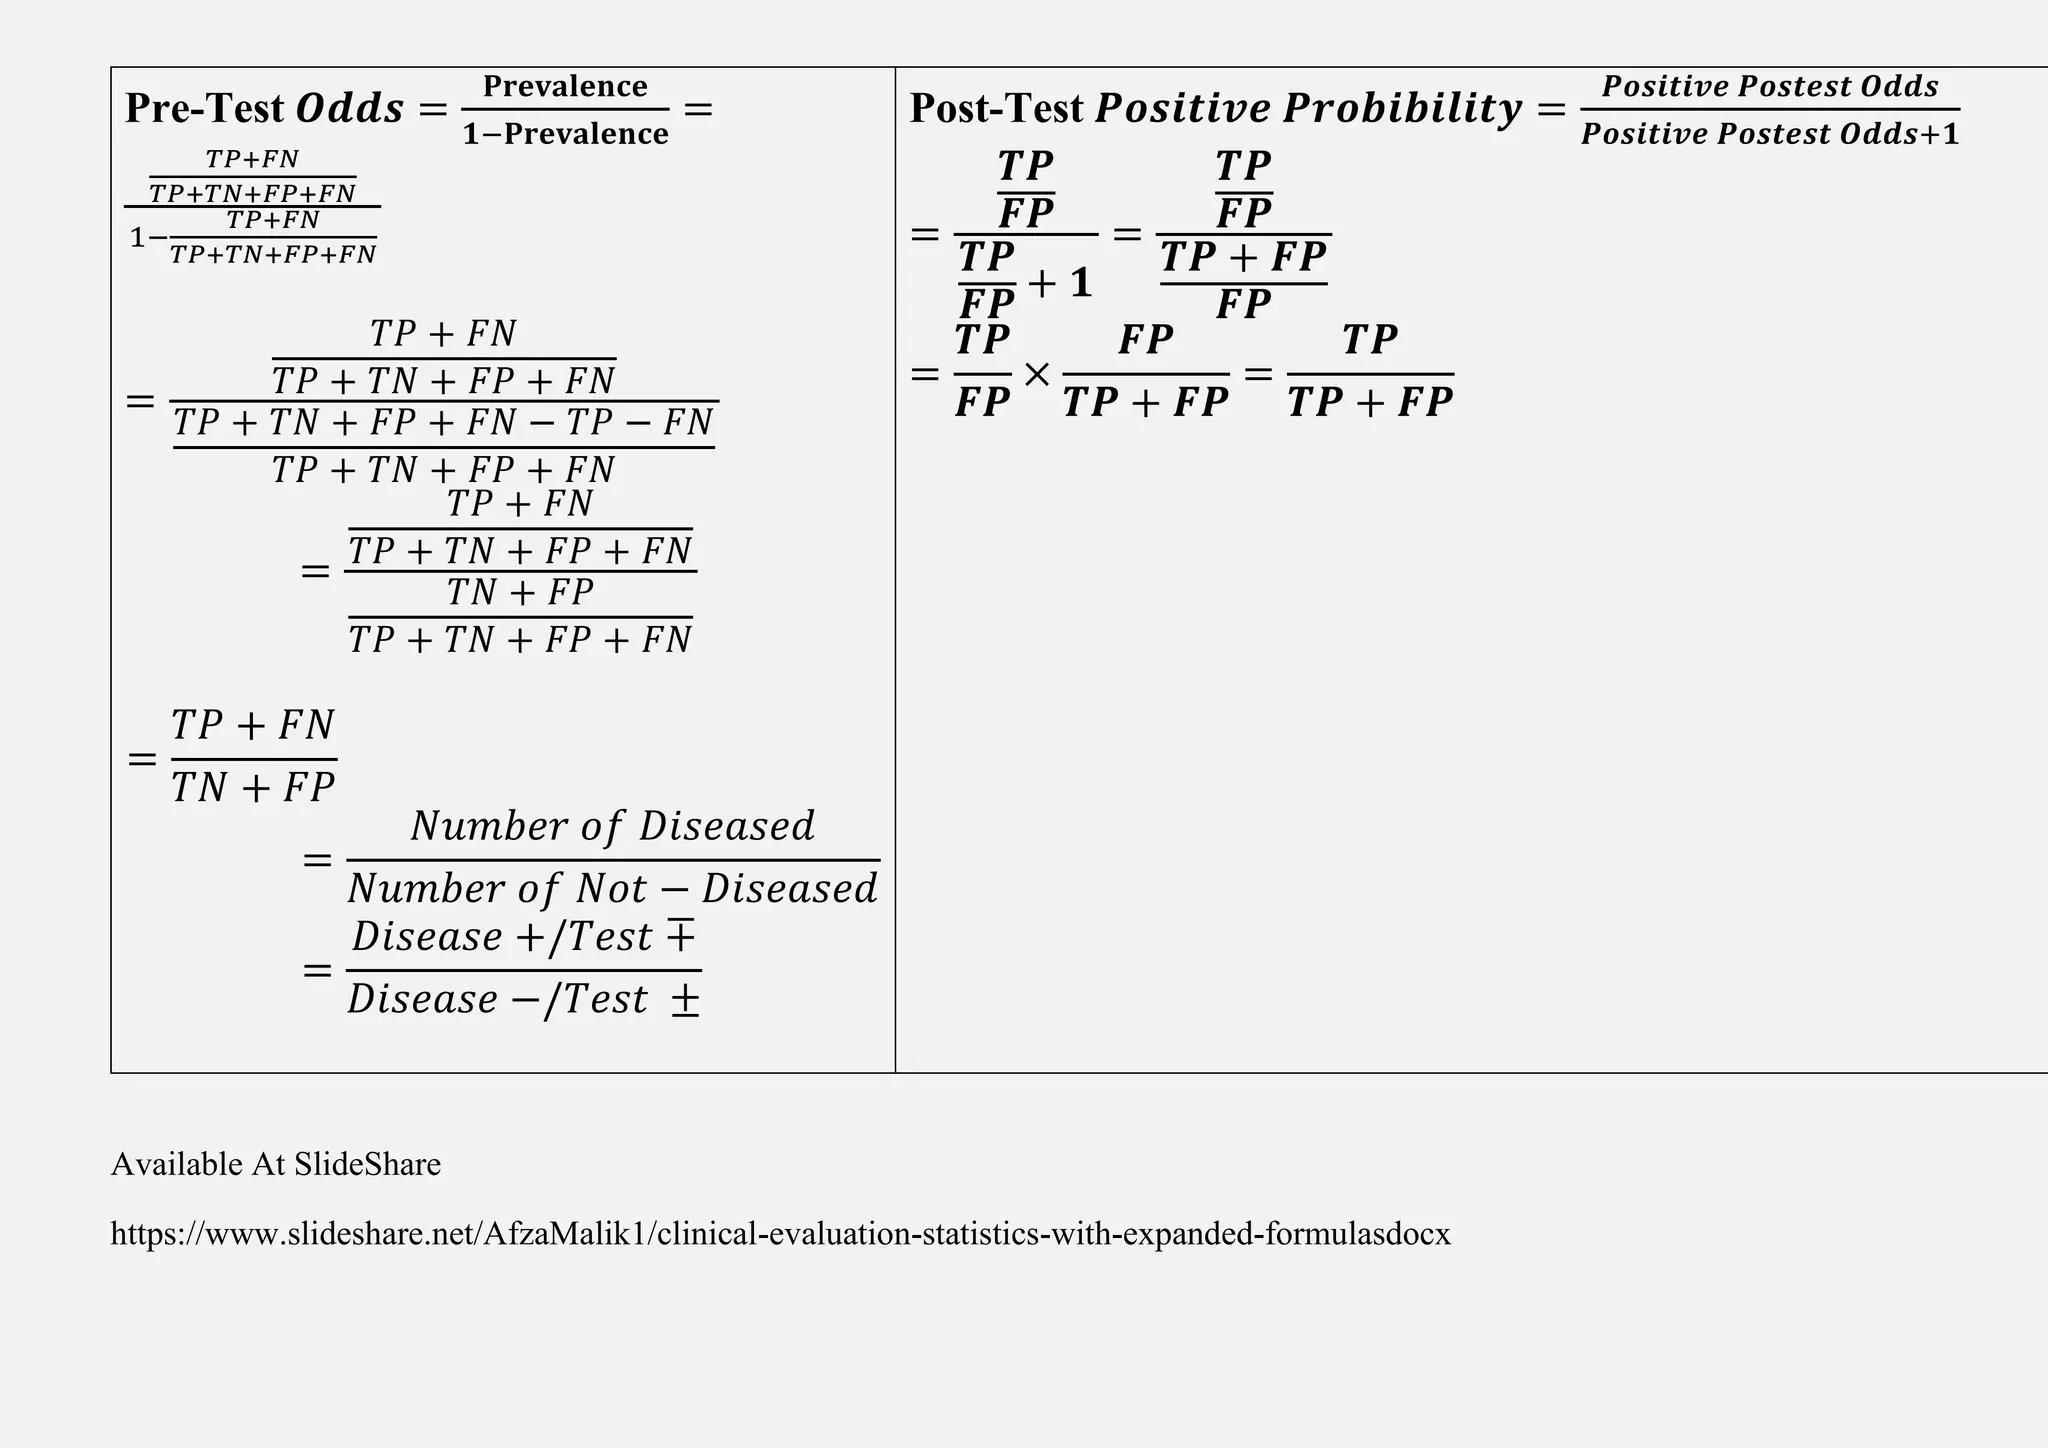
This document defines key clinical evaluation statistics used to assess diagnostic tests: Sensitivity measures the percentage of true positive results and specificity measures the percentage of true negative results. The positive predictive value is the probability a positive test result reflects the disease, and the negative predictive value is the probability a negative result correctly rules out the disease. Prevalence refers to the percentage of a population with the disease. Accuracy measures the percentage of correct test outcomes overall.