The document contains a set of statistics and probability questions with multiple choice answers. It covers topics such as:
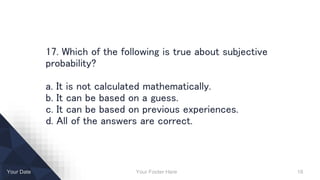
- The definition of key terms like statistics, probability, data collection, and confidentiality.
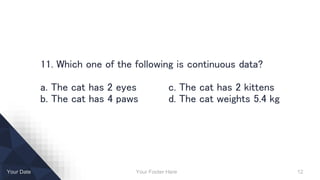
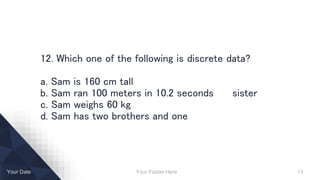
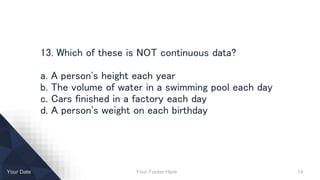
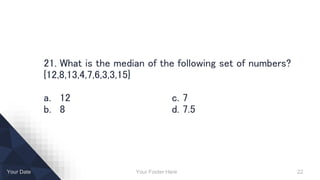
- Examples of different types of data like continuous and discrete.
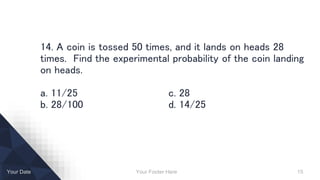
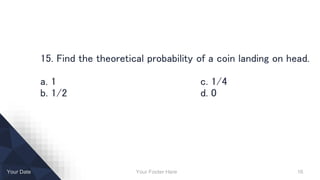
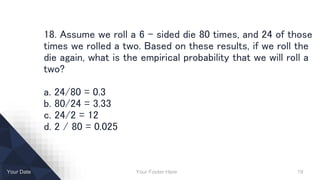
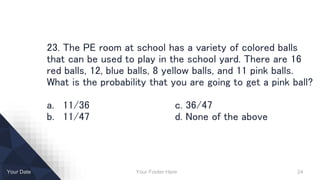
- Calculating probabilities of events.
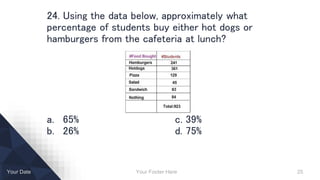
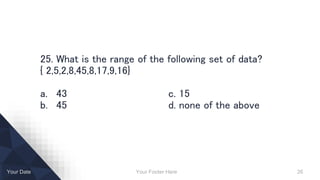
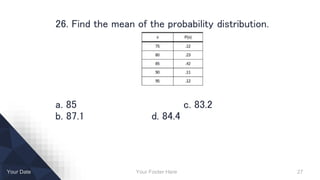
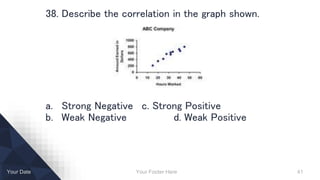
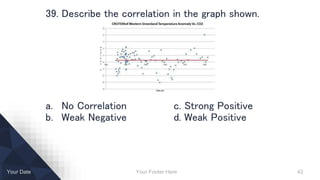
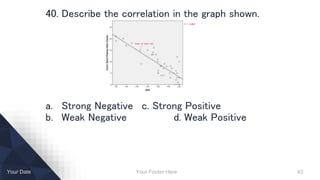
- Describing distributions and correlations.
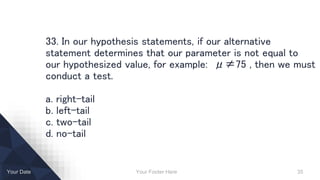
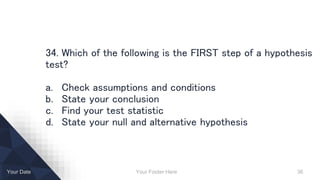
- Stating null and alternative hypotheses.
The questions are designed to test understanding of fundamental concepts in statistics and probability.