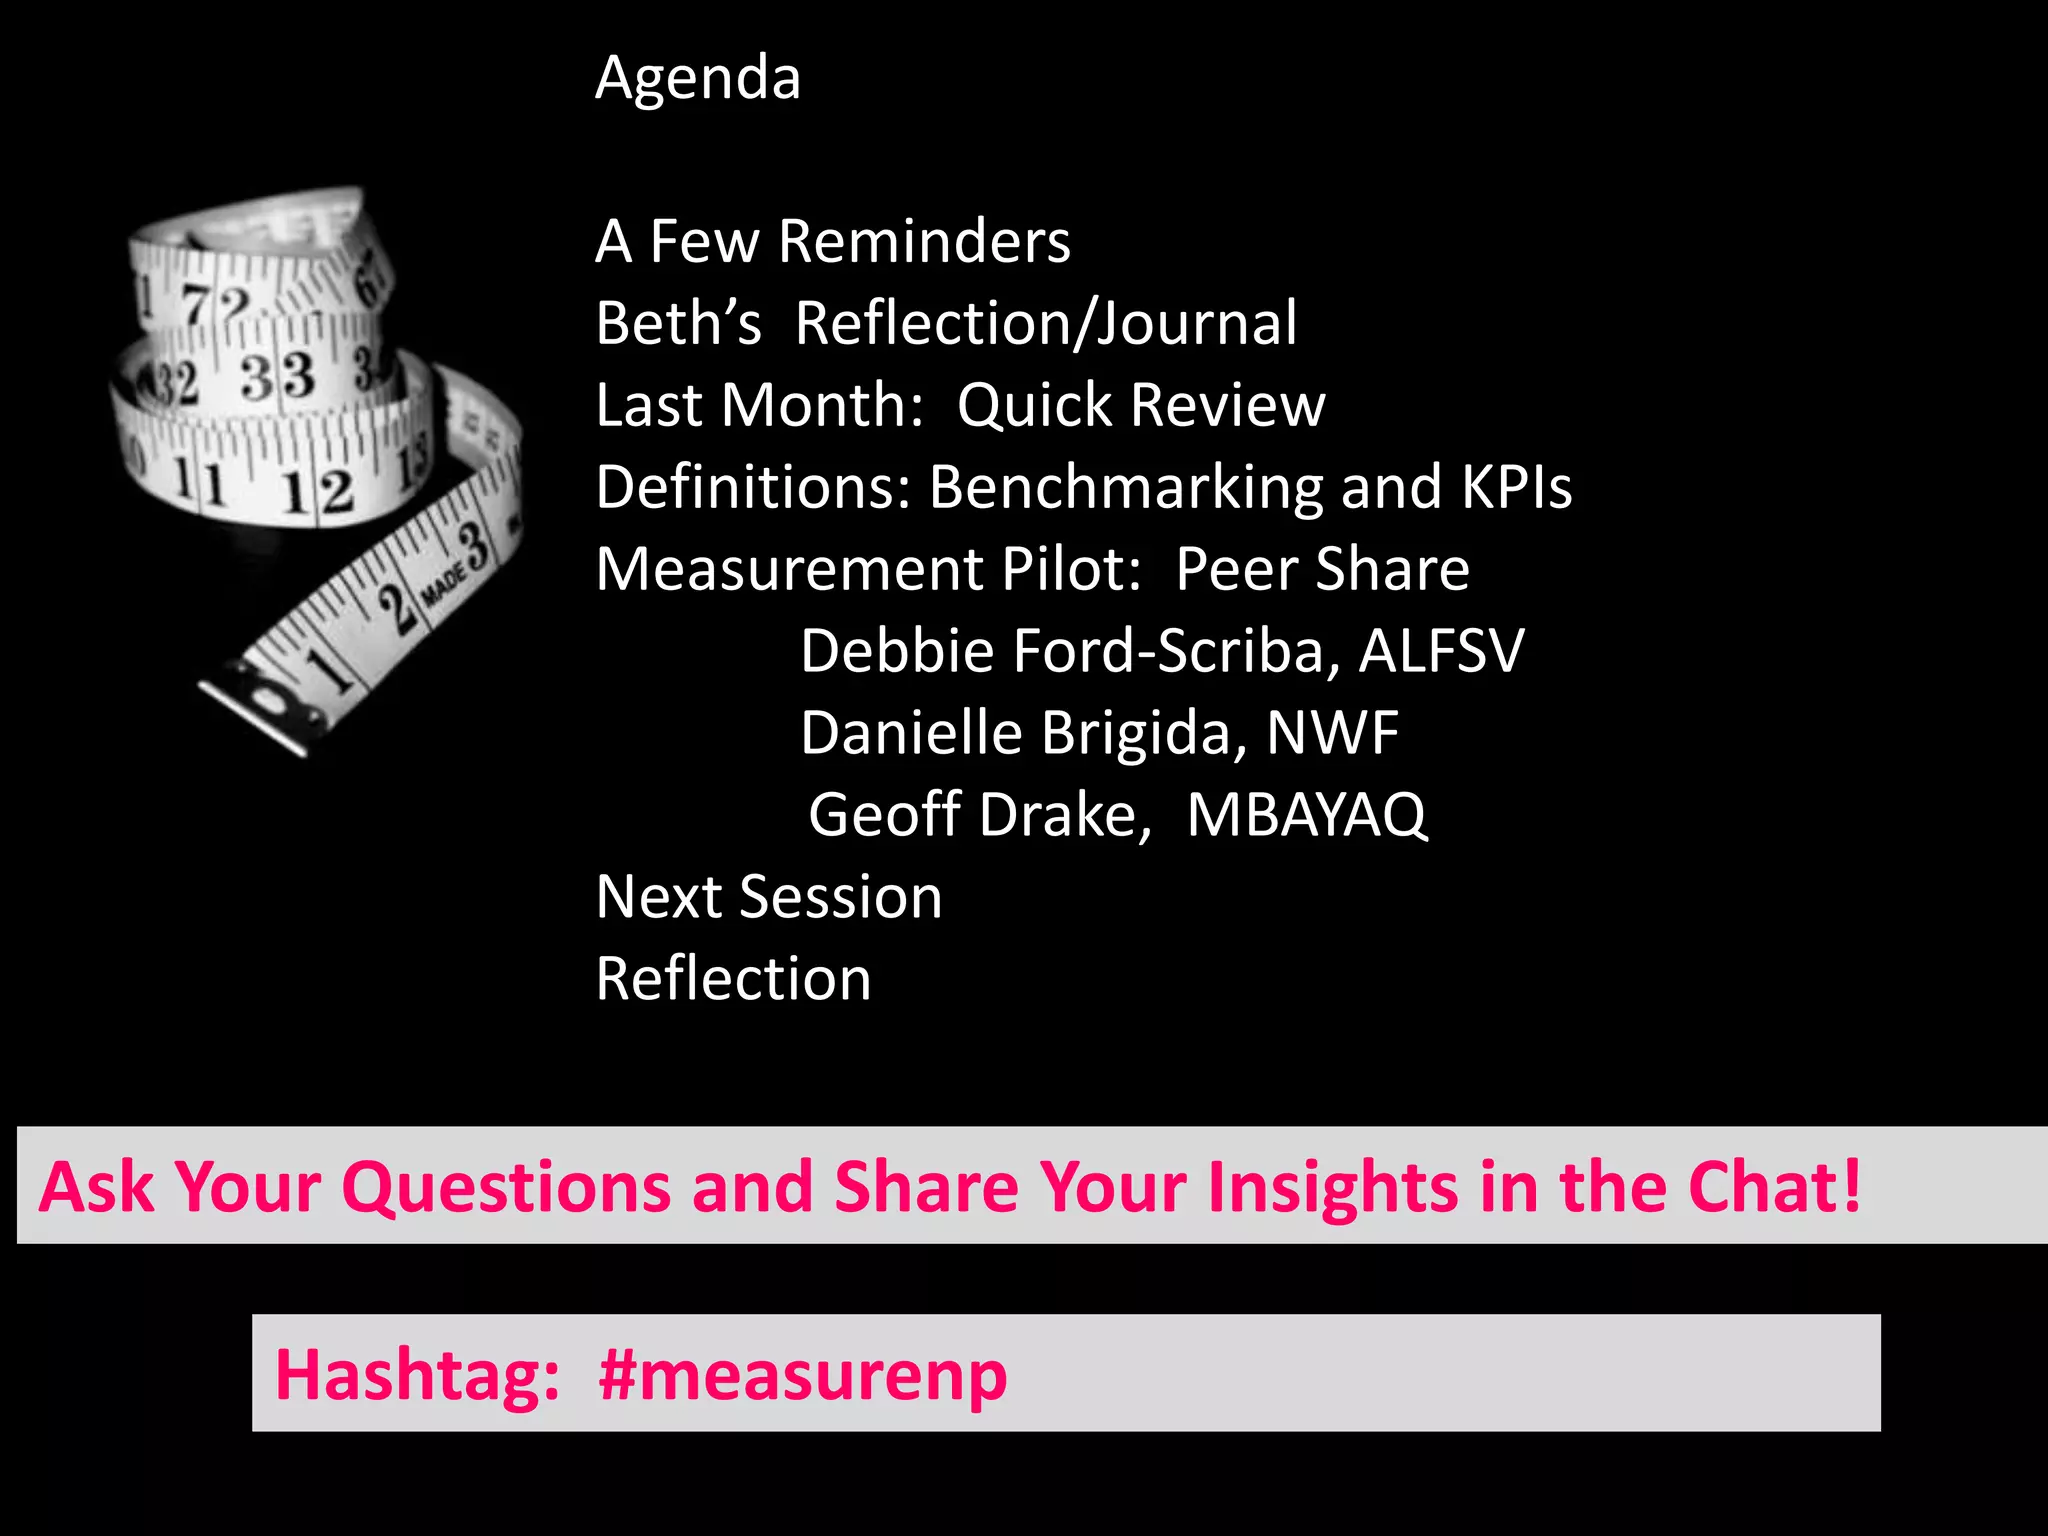
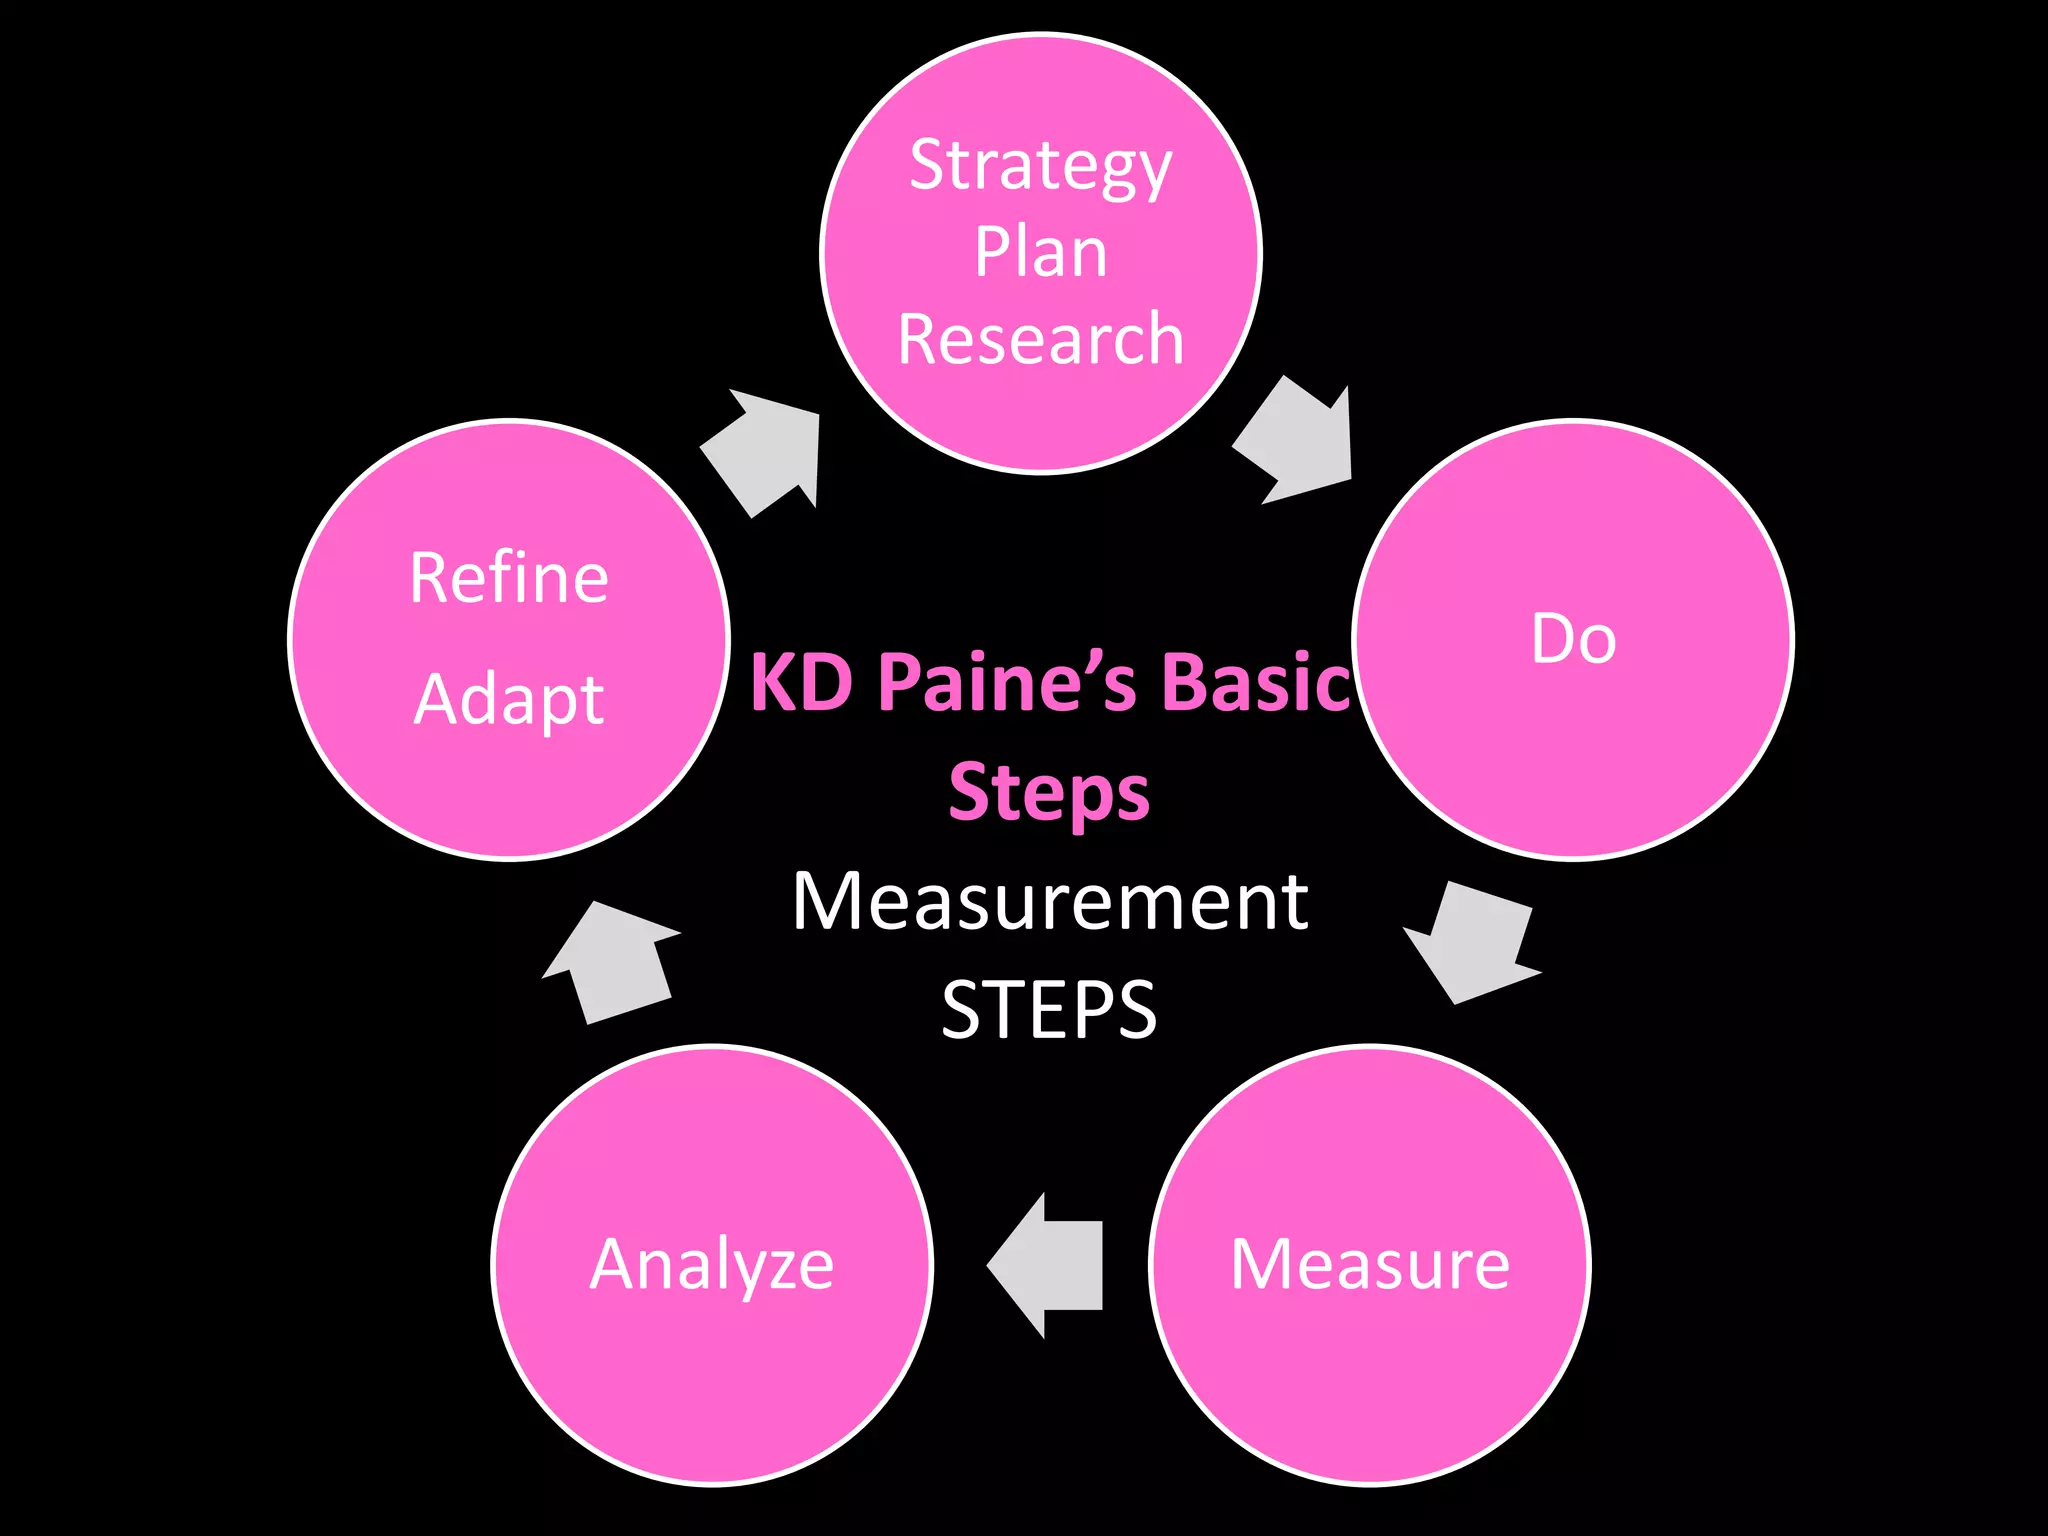
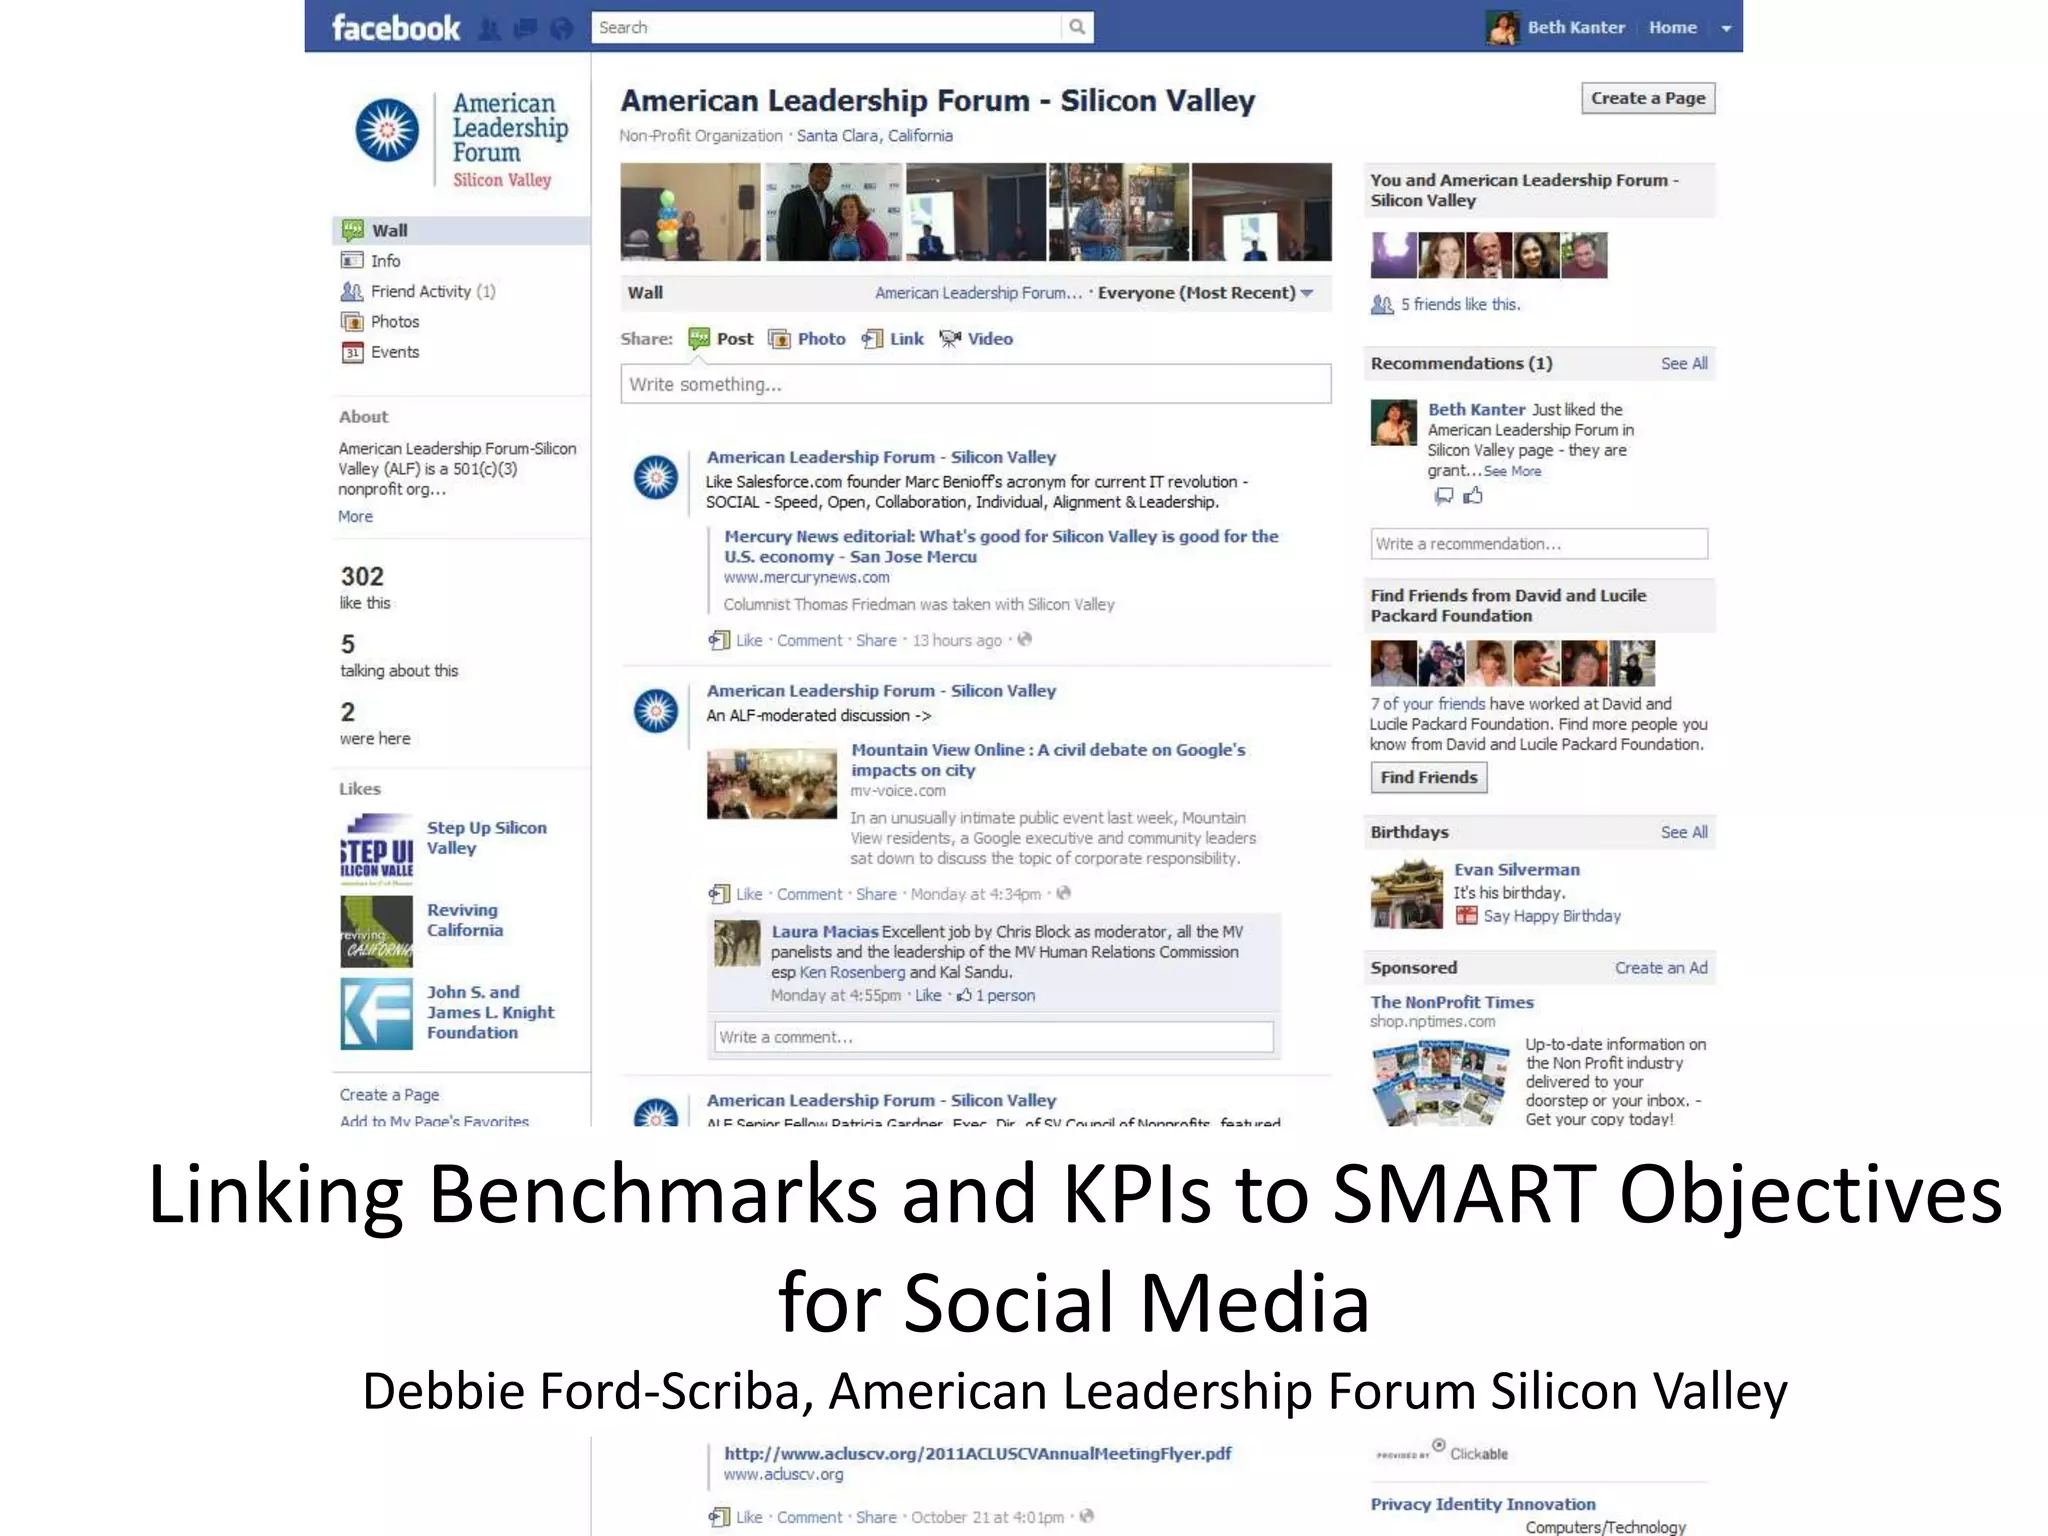
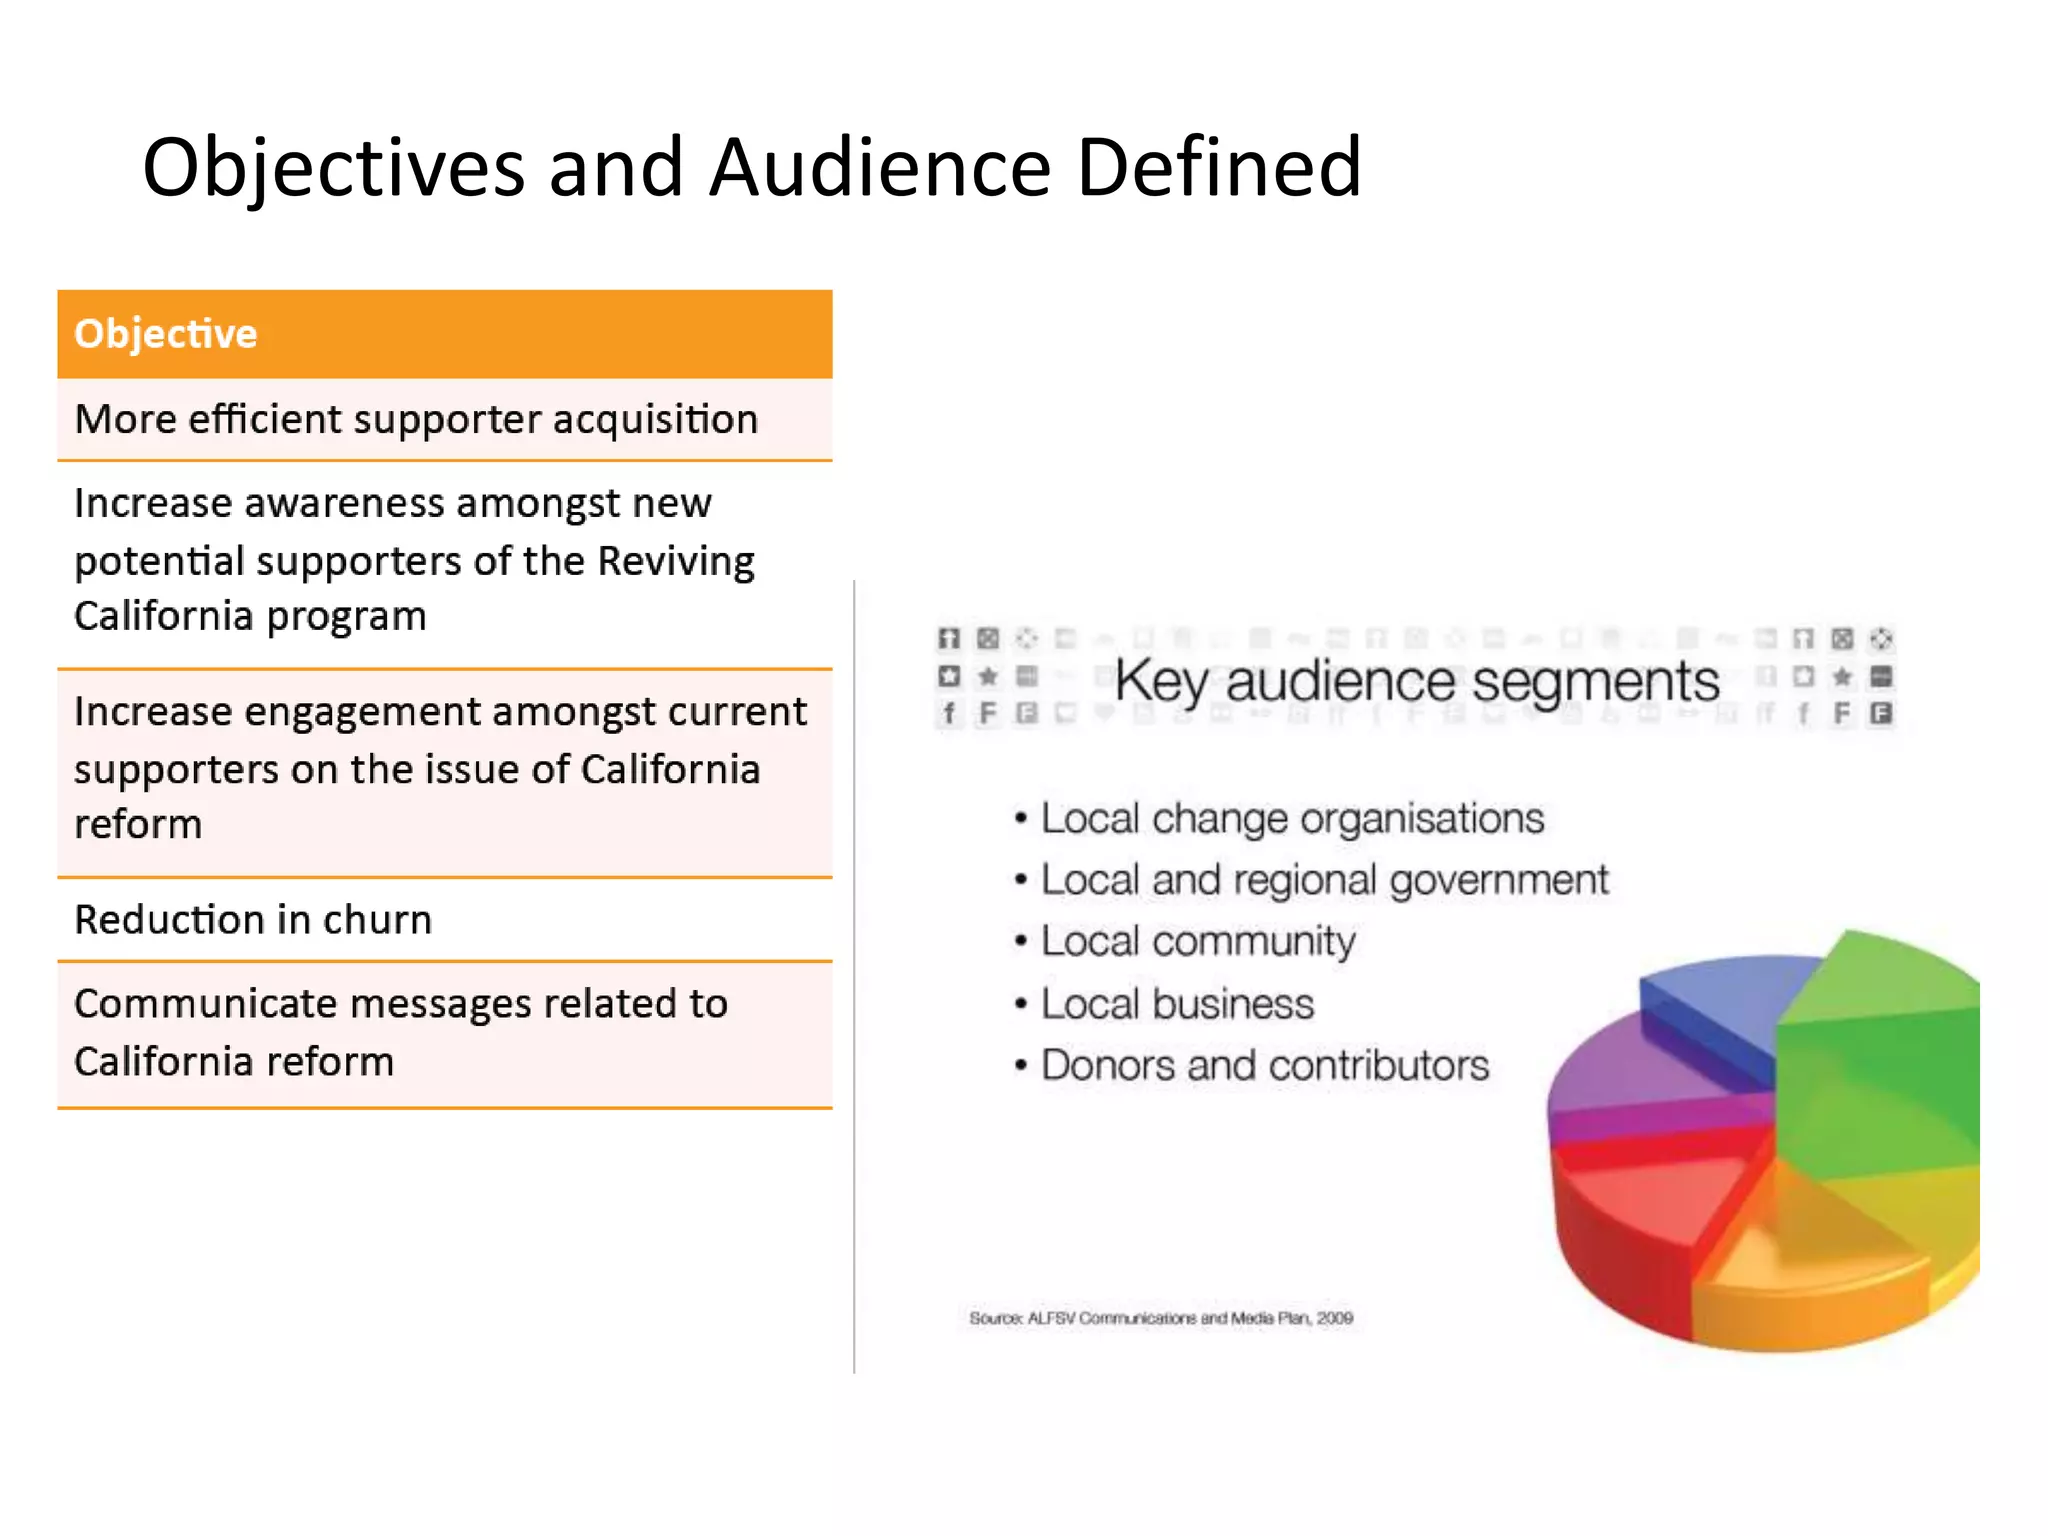
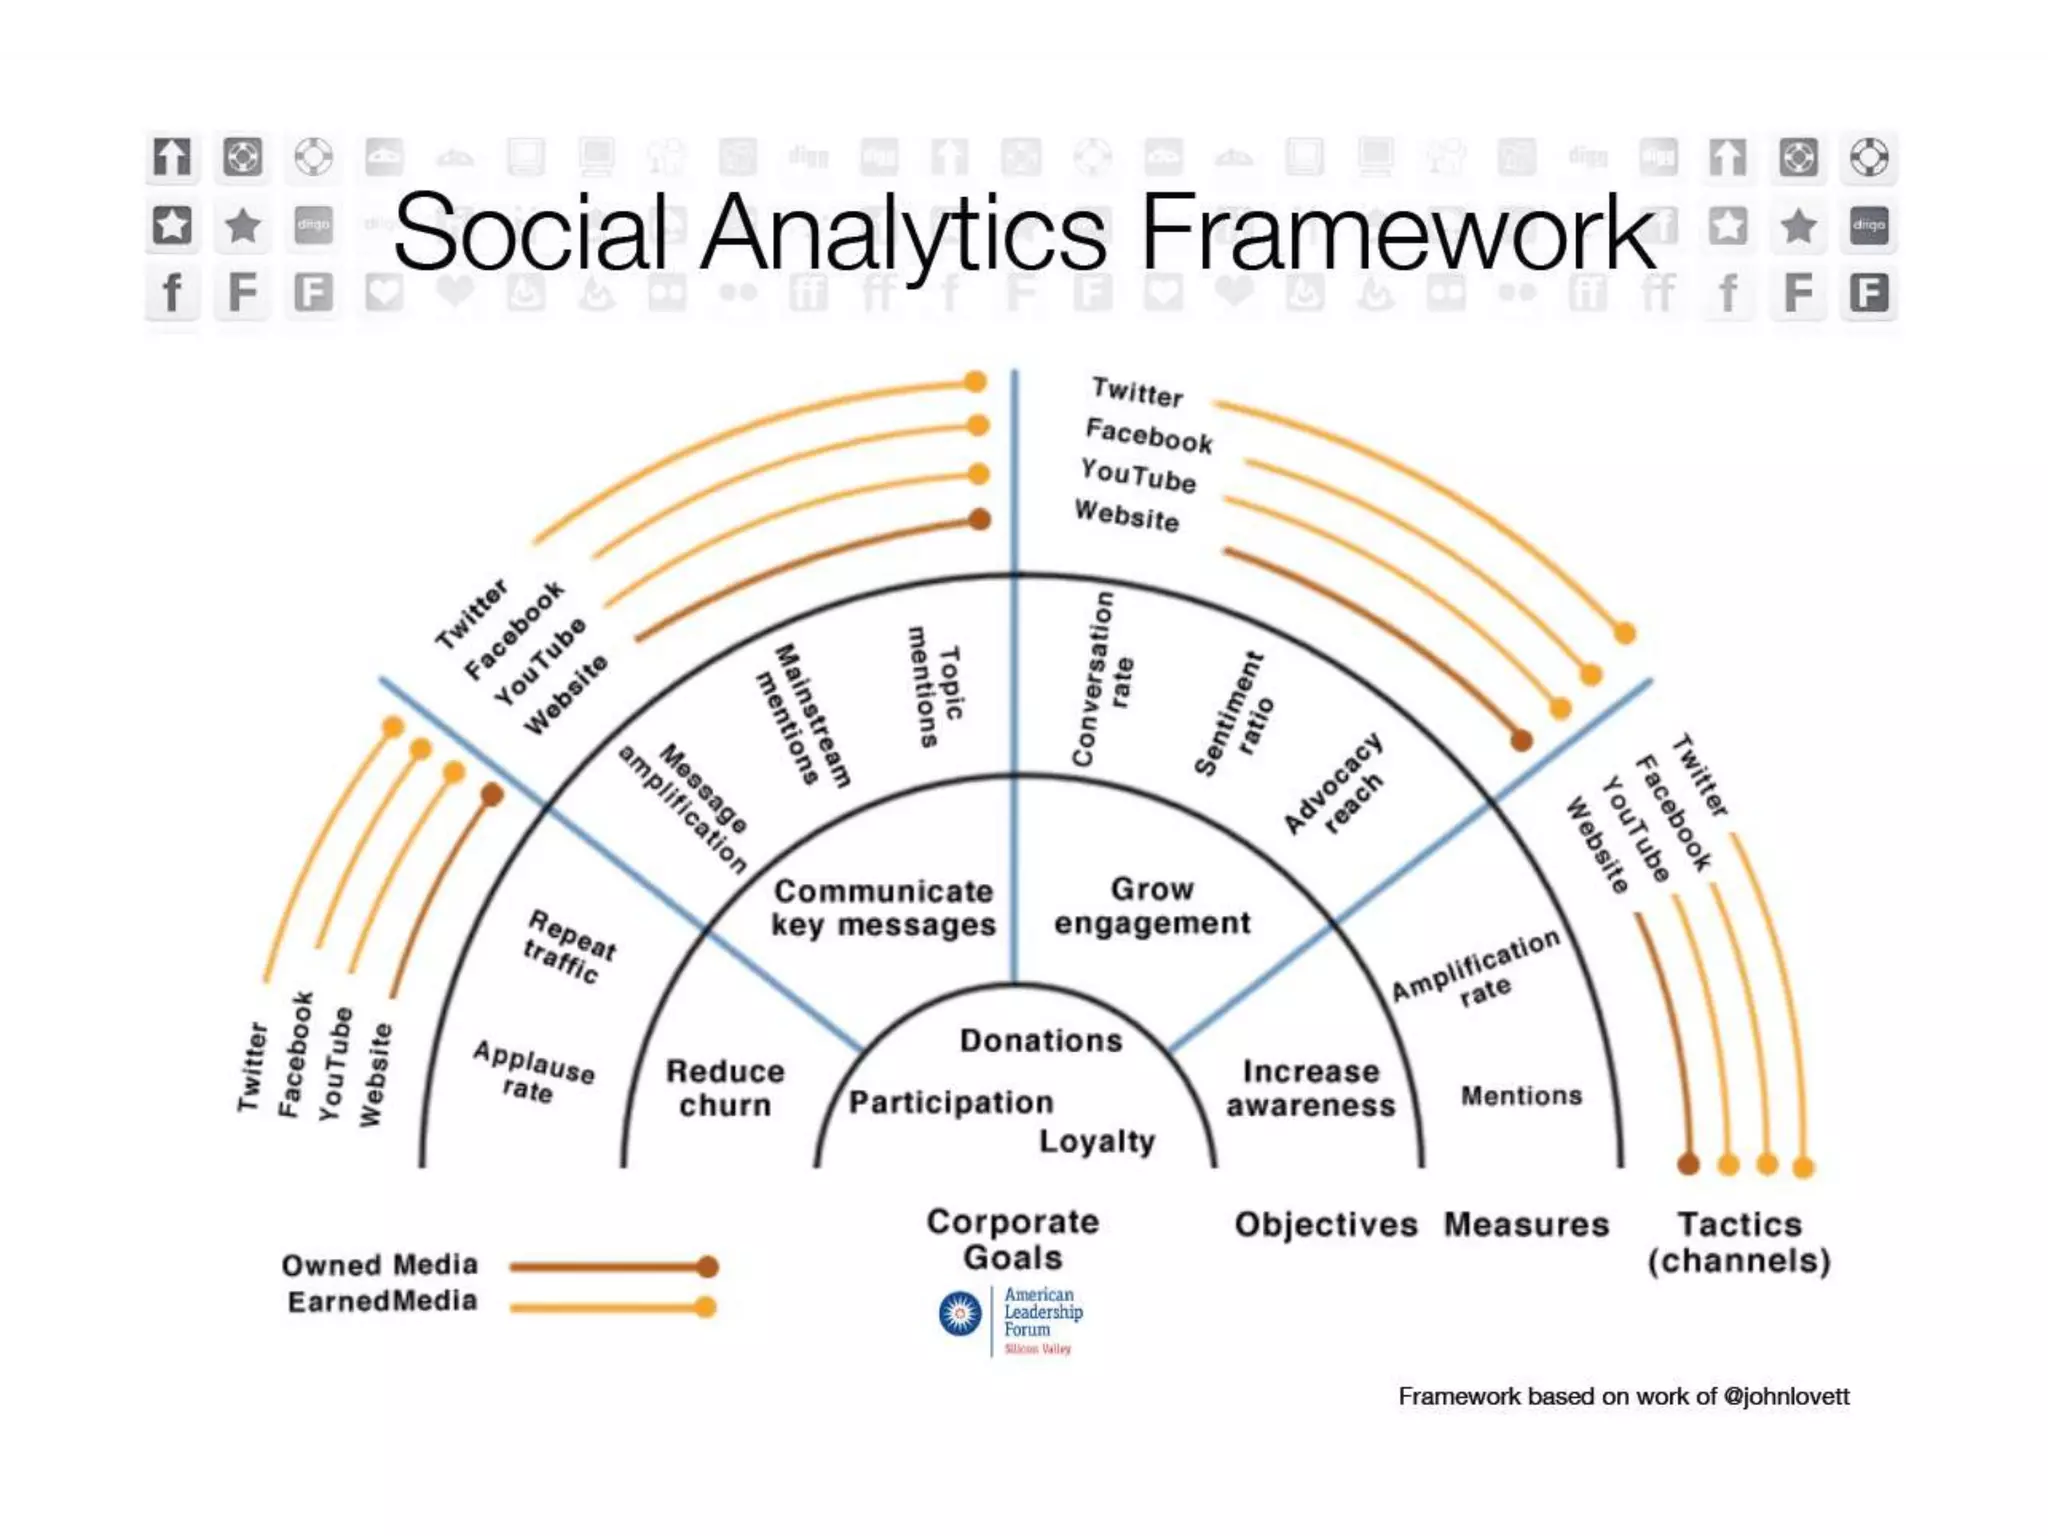
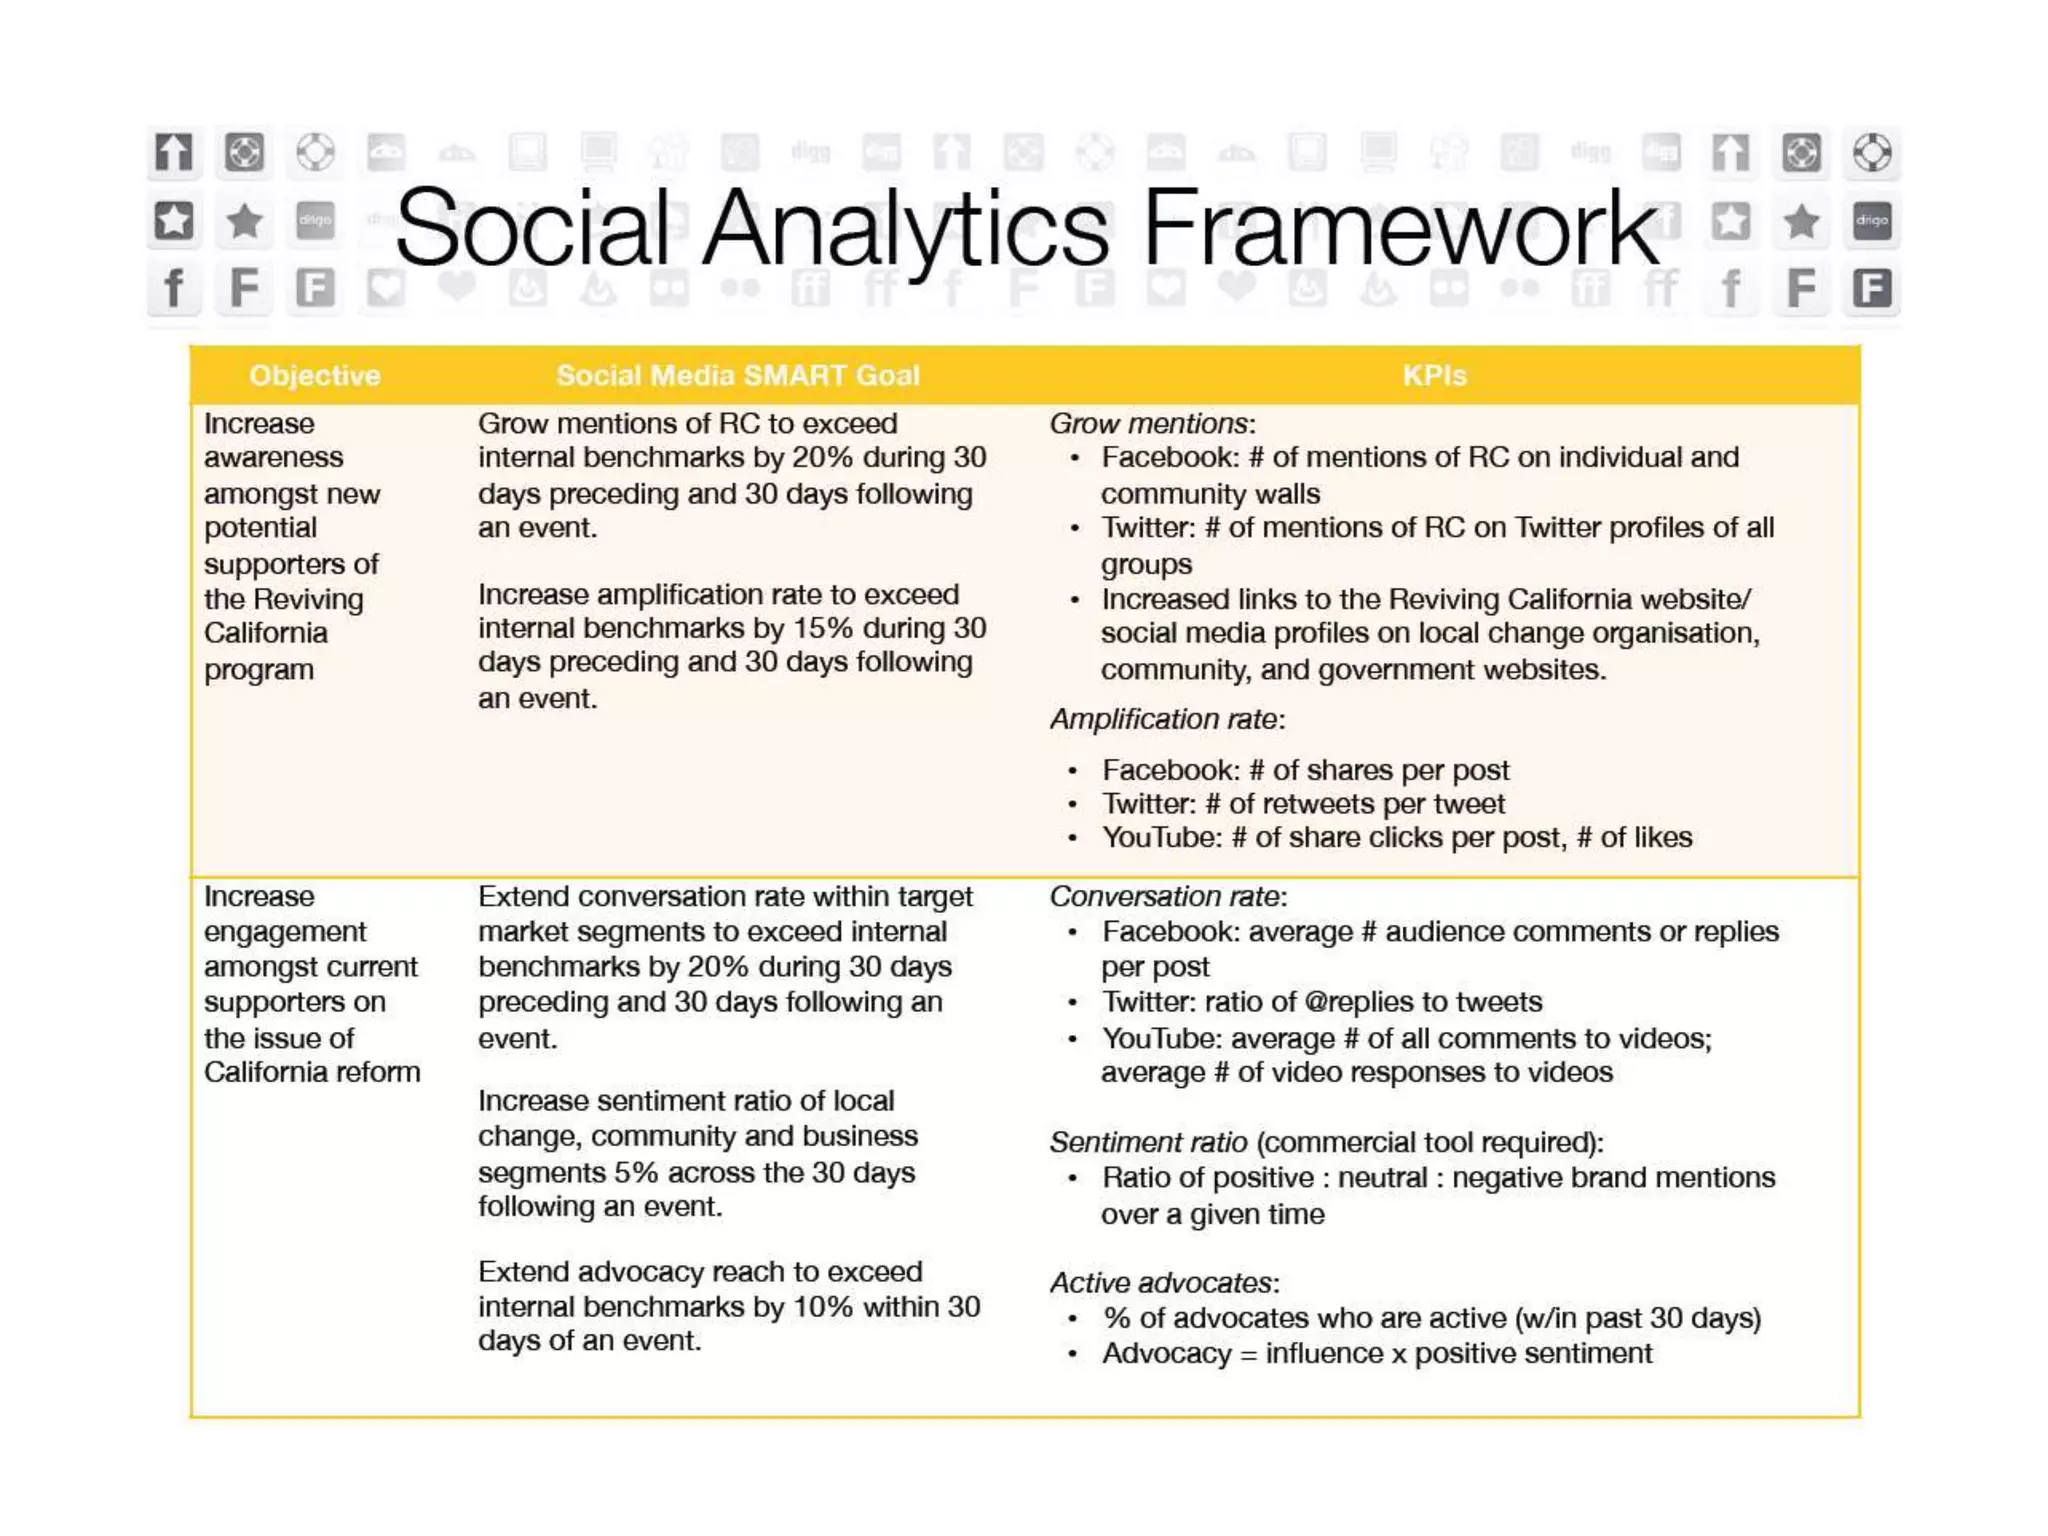
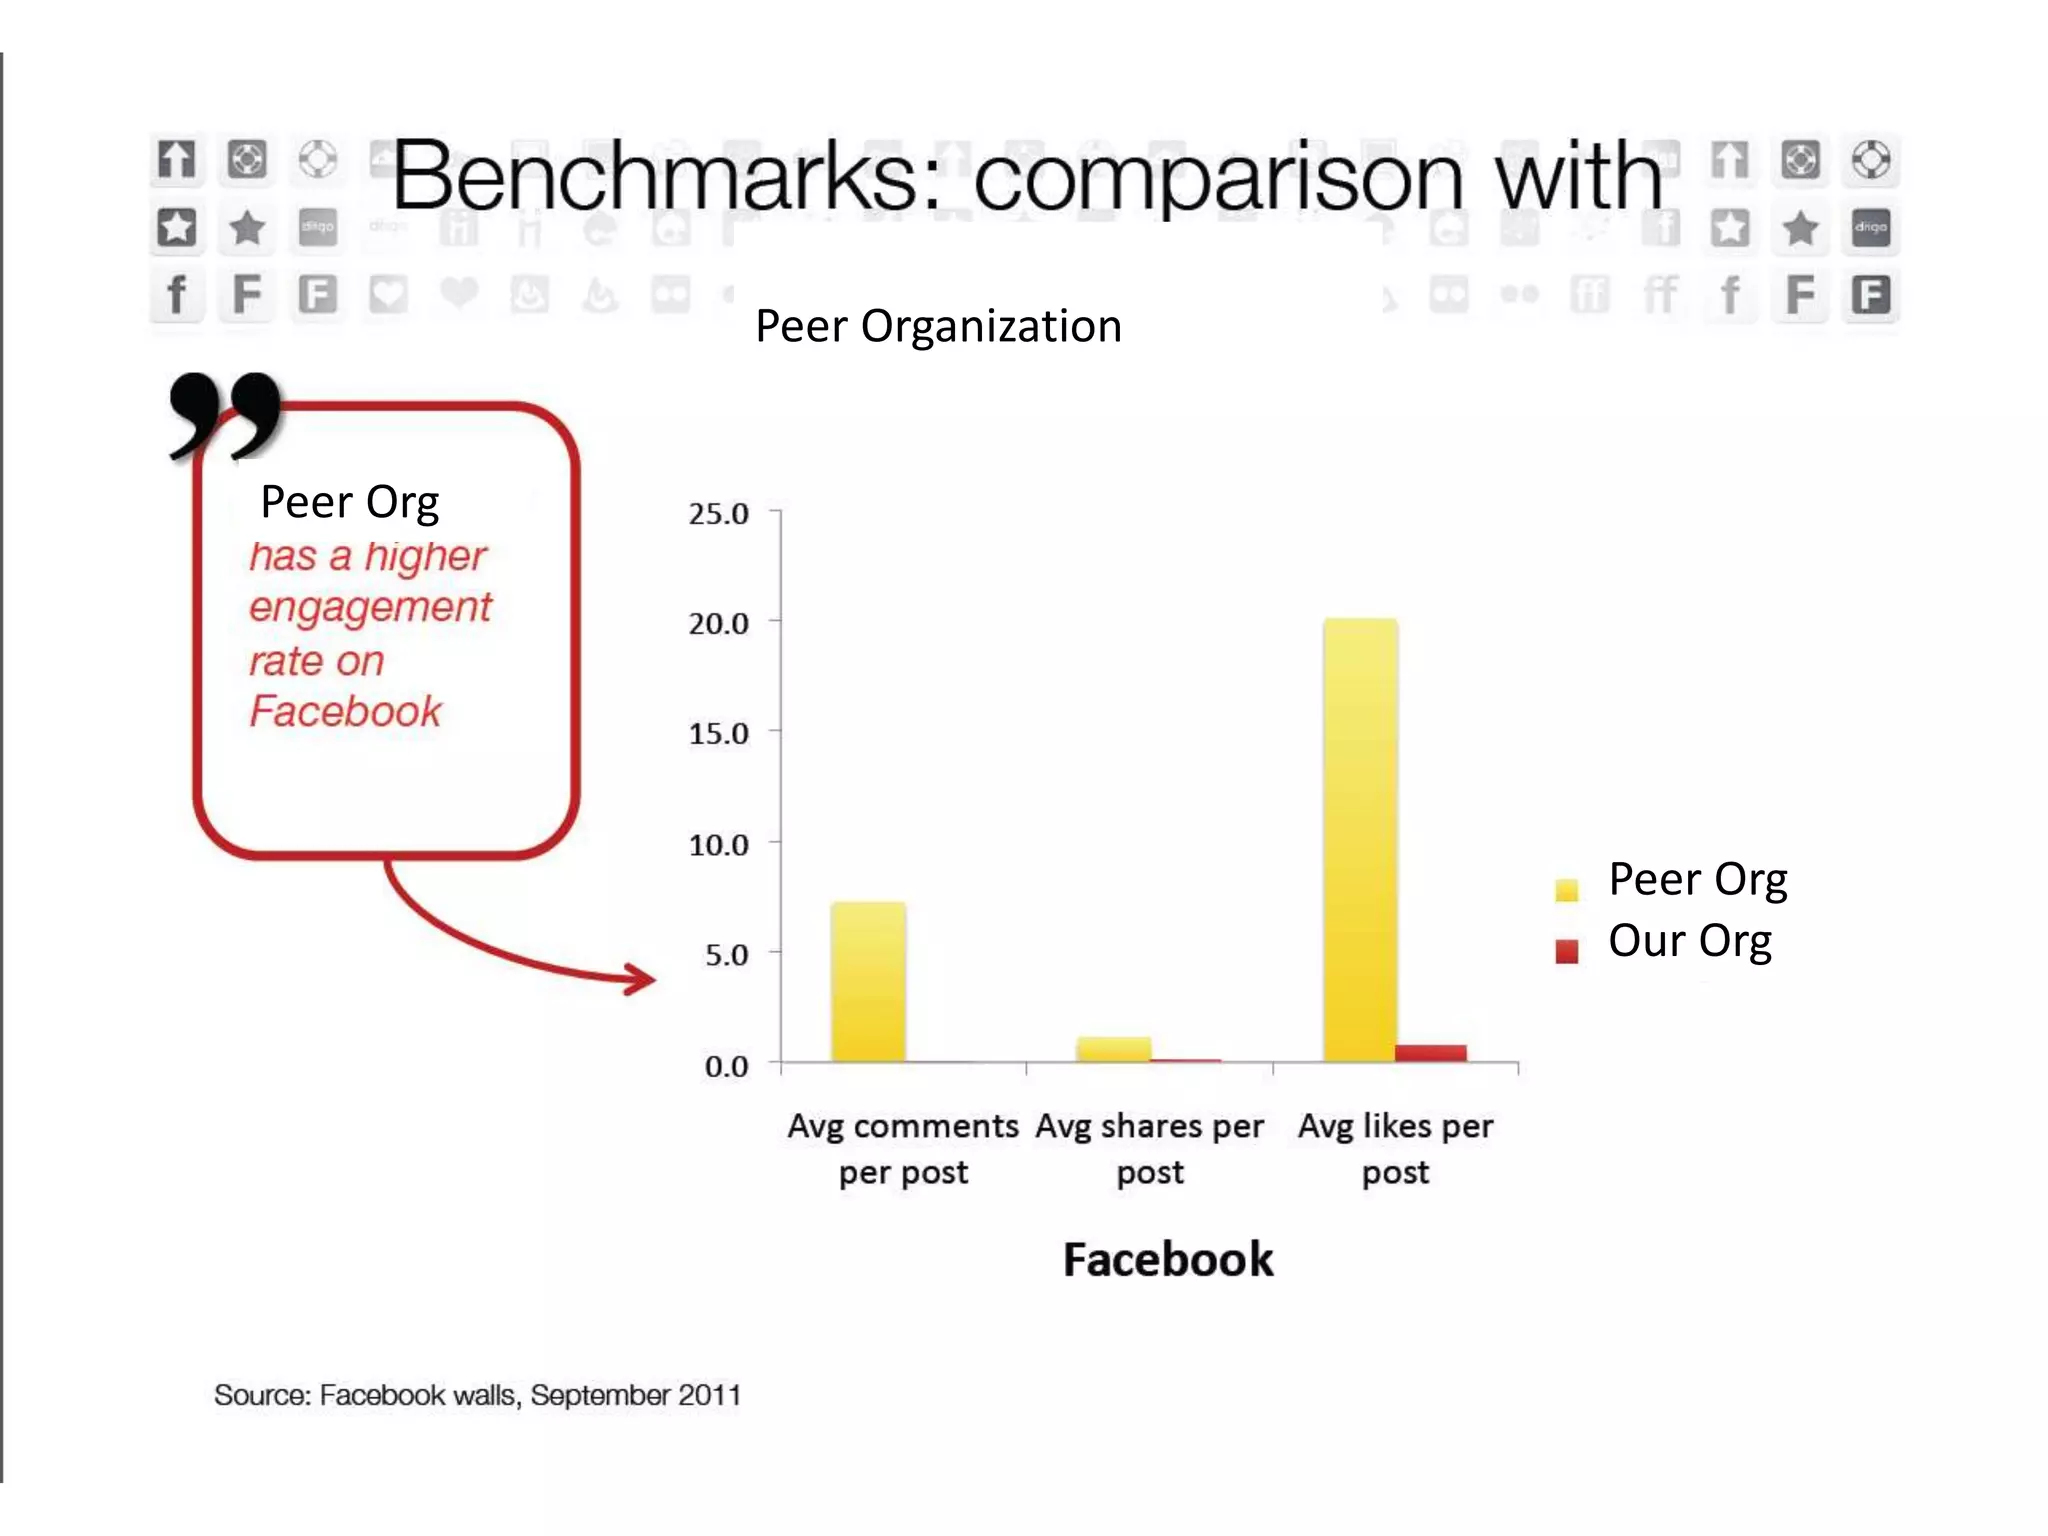
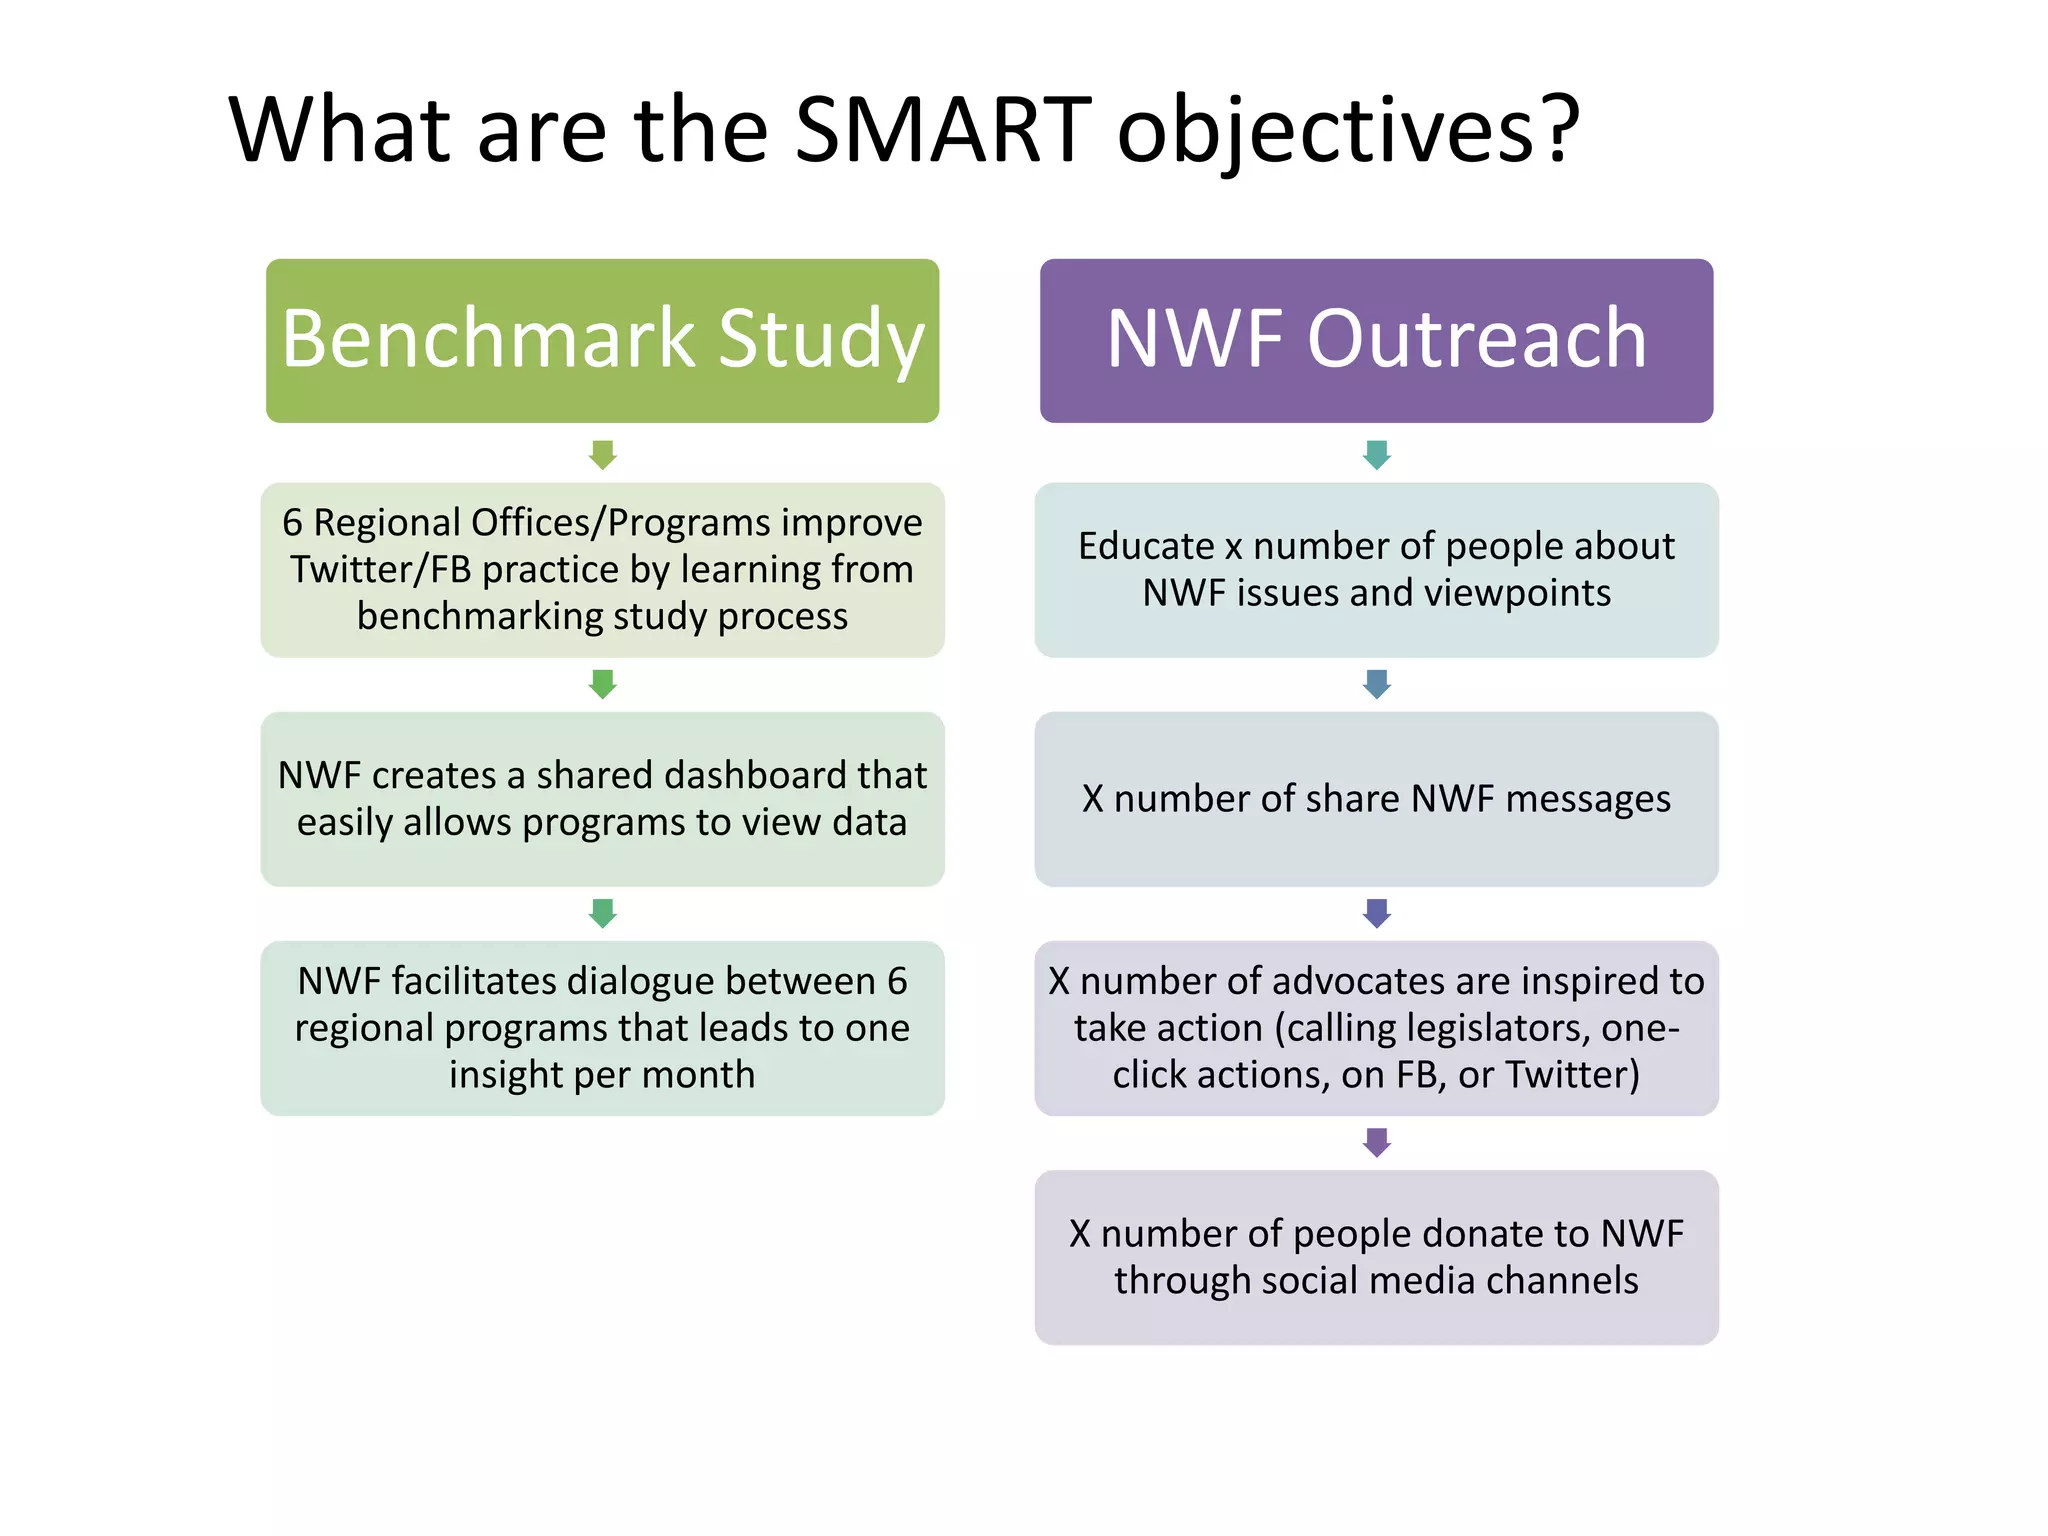
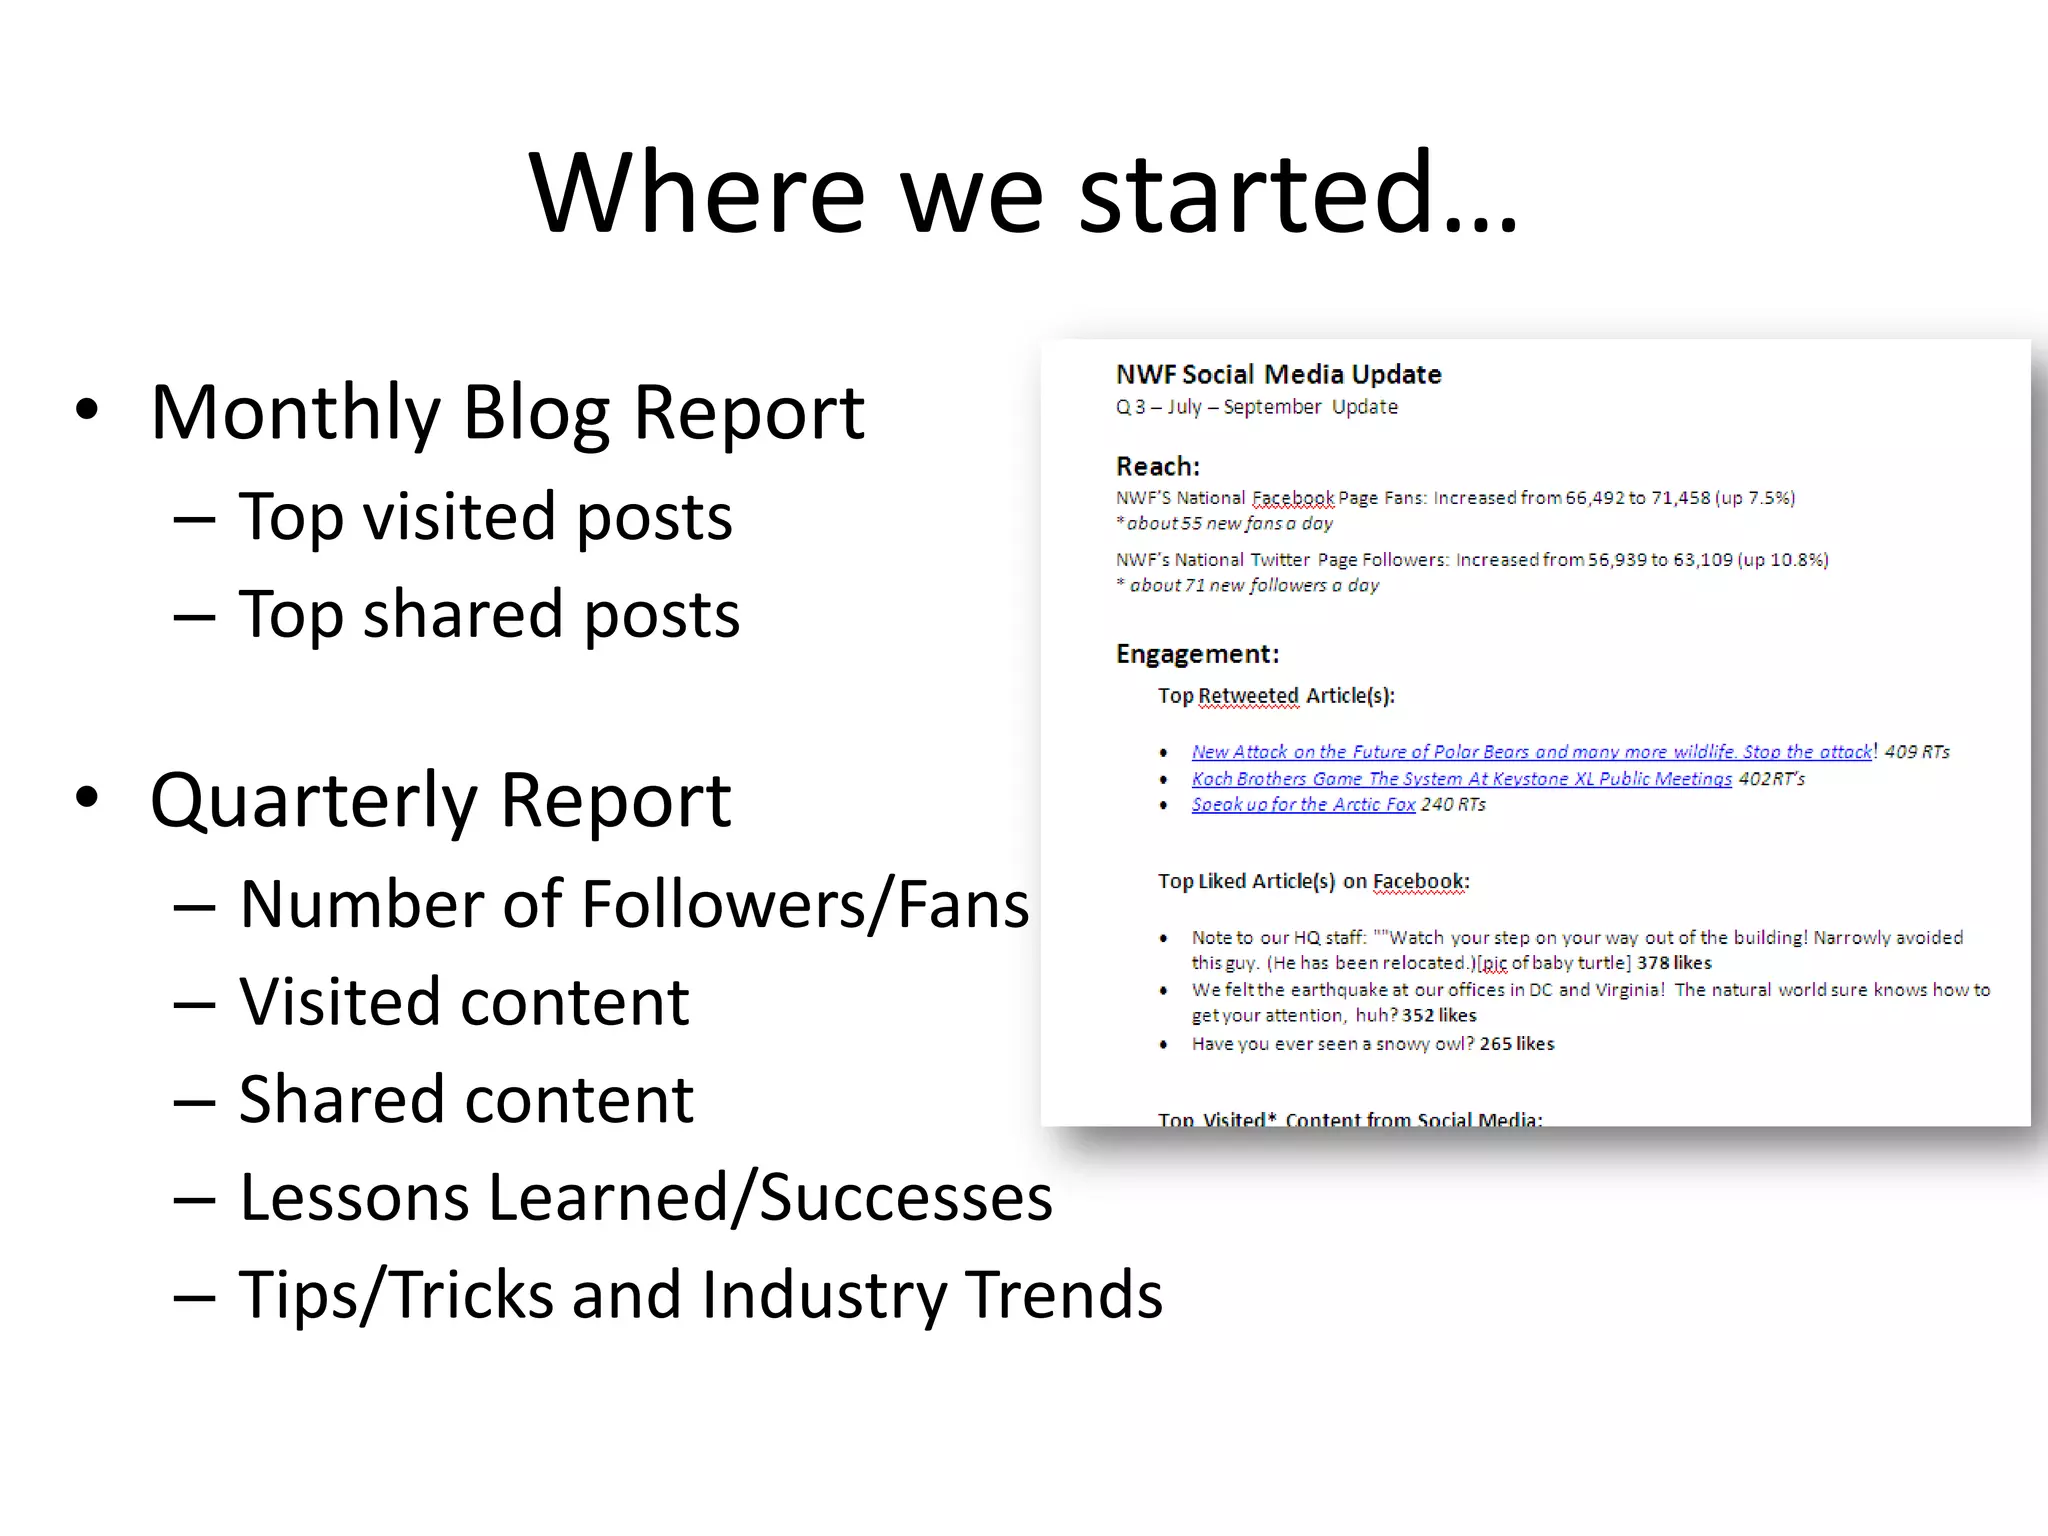
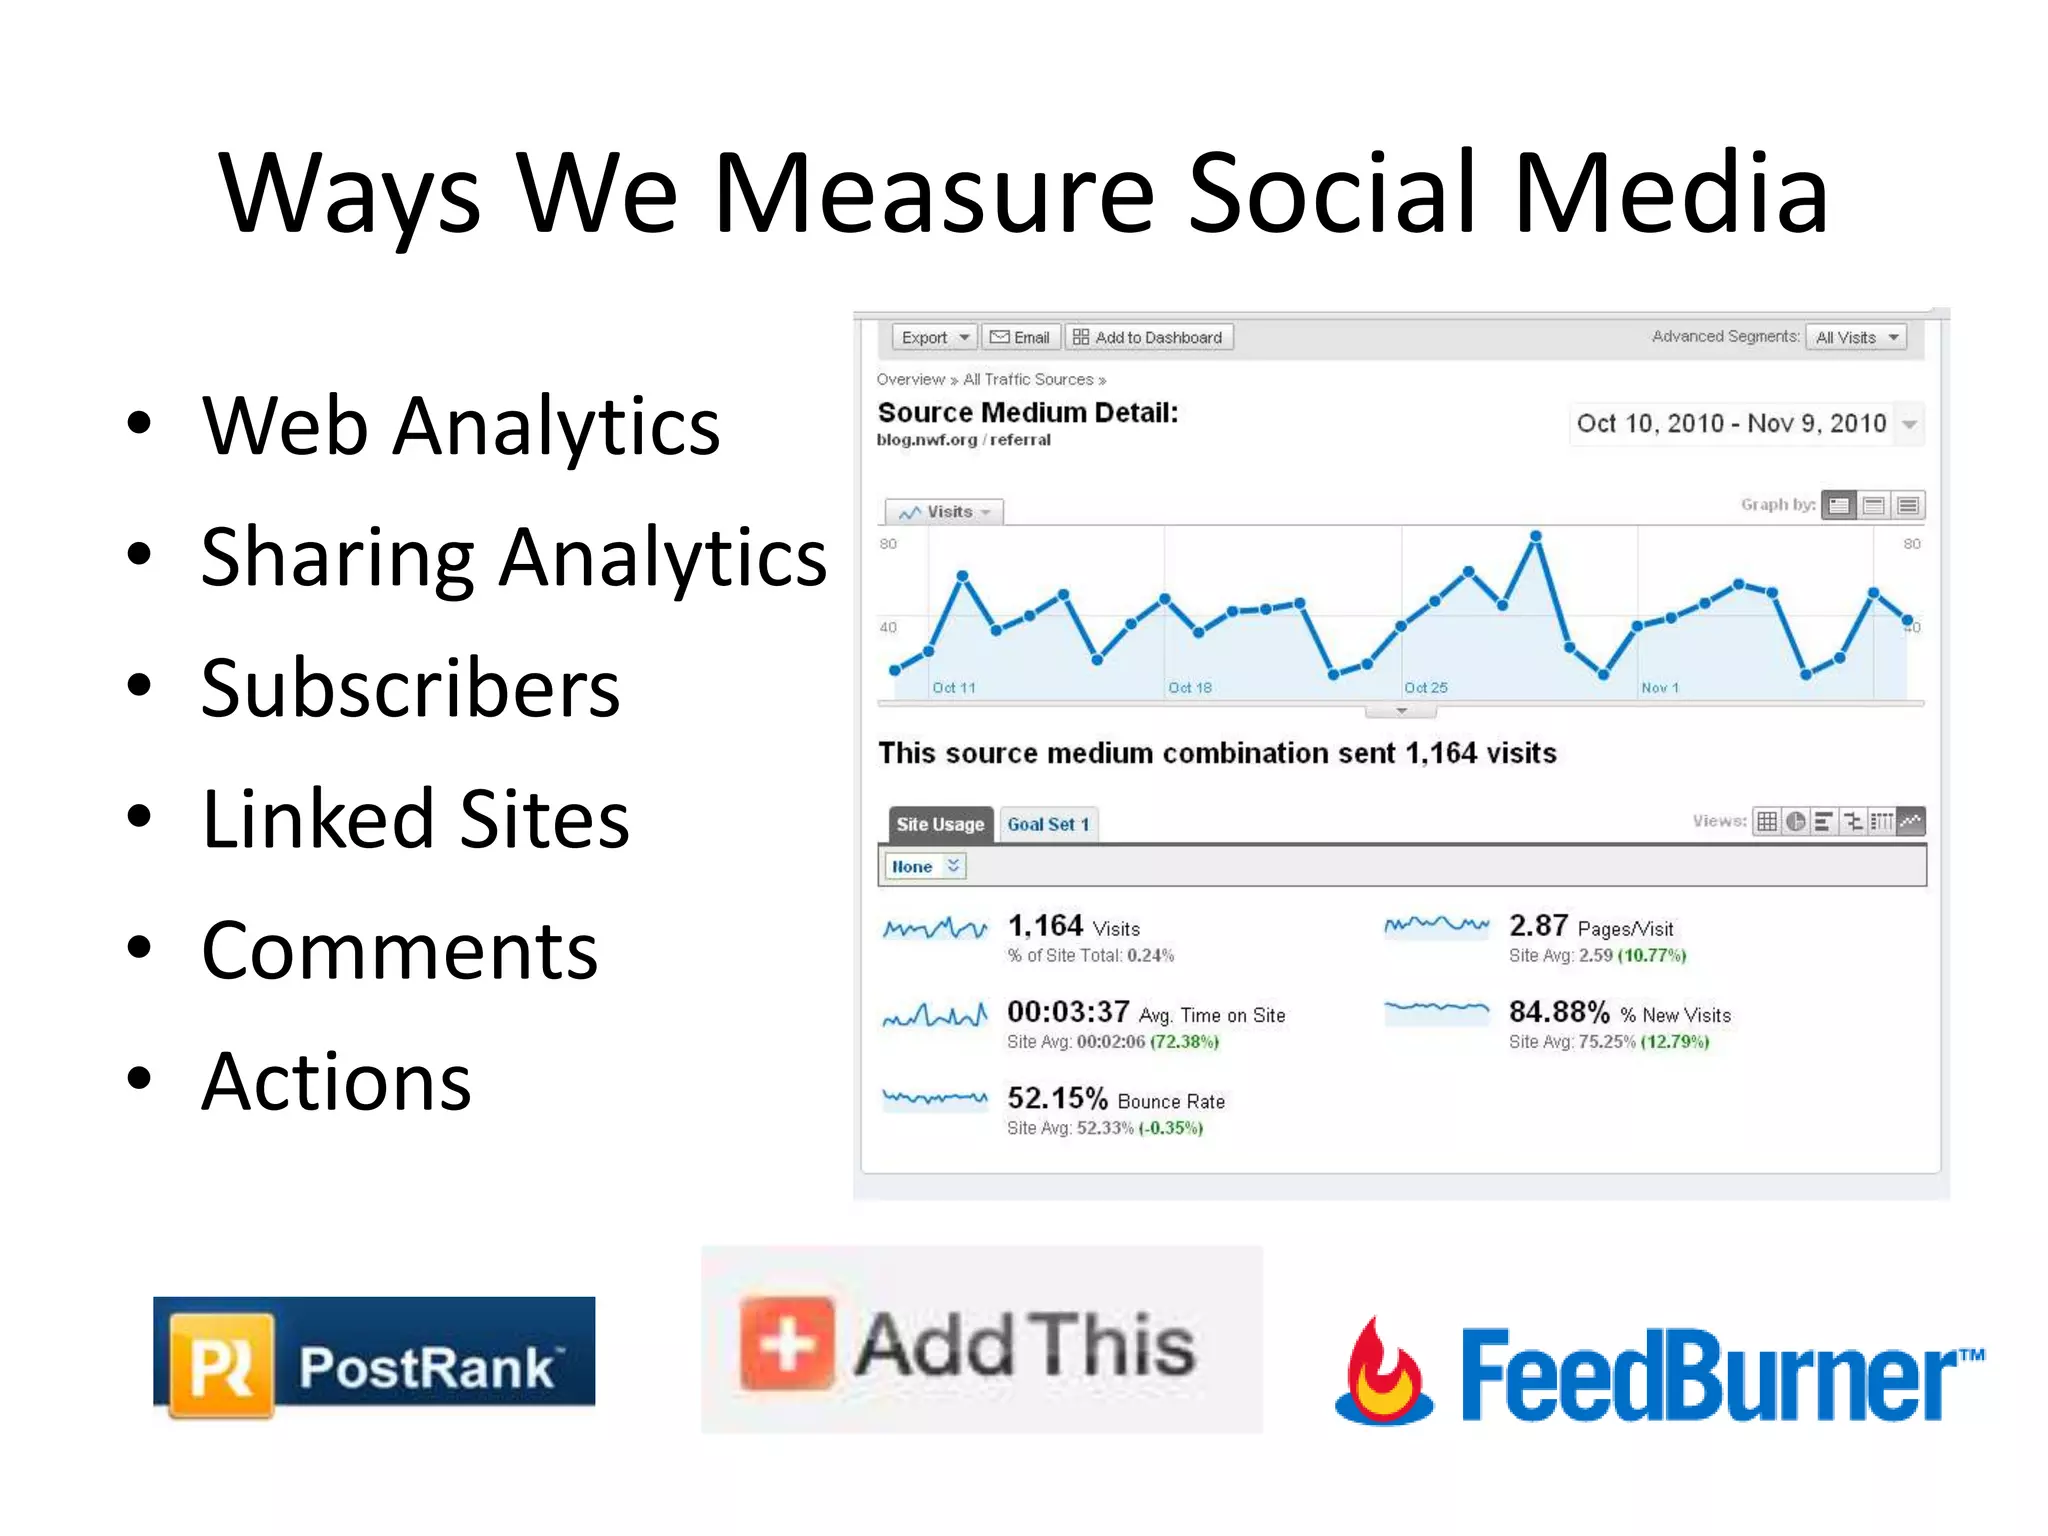
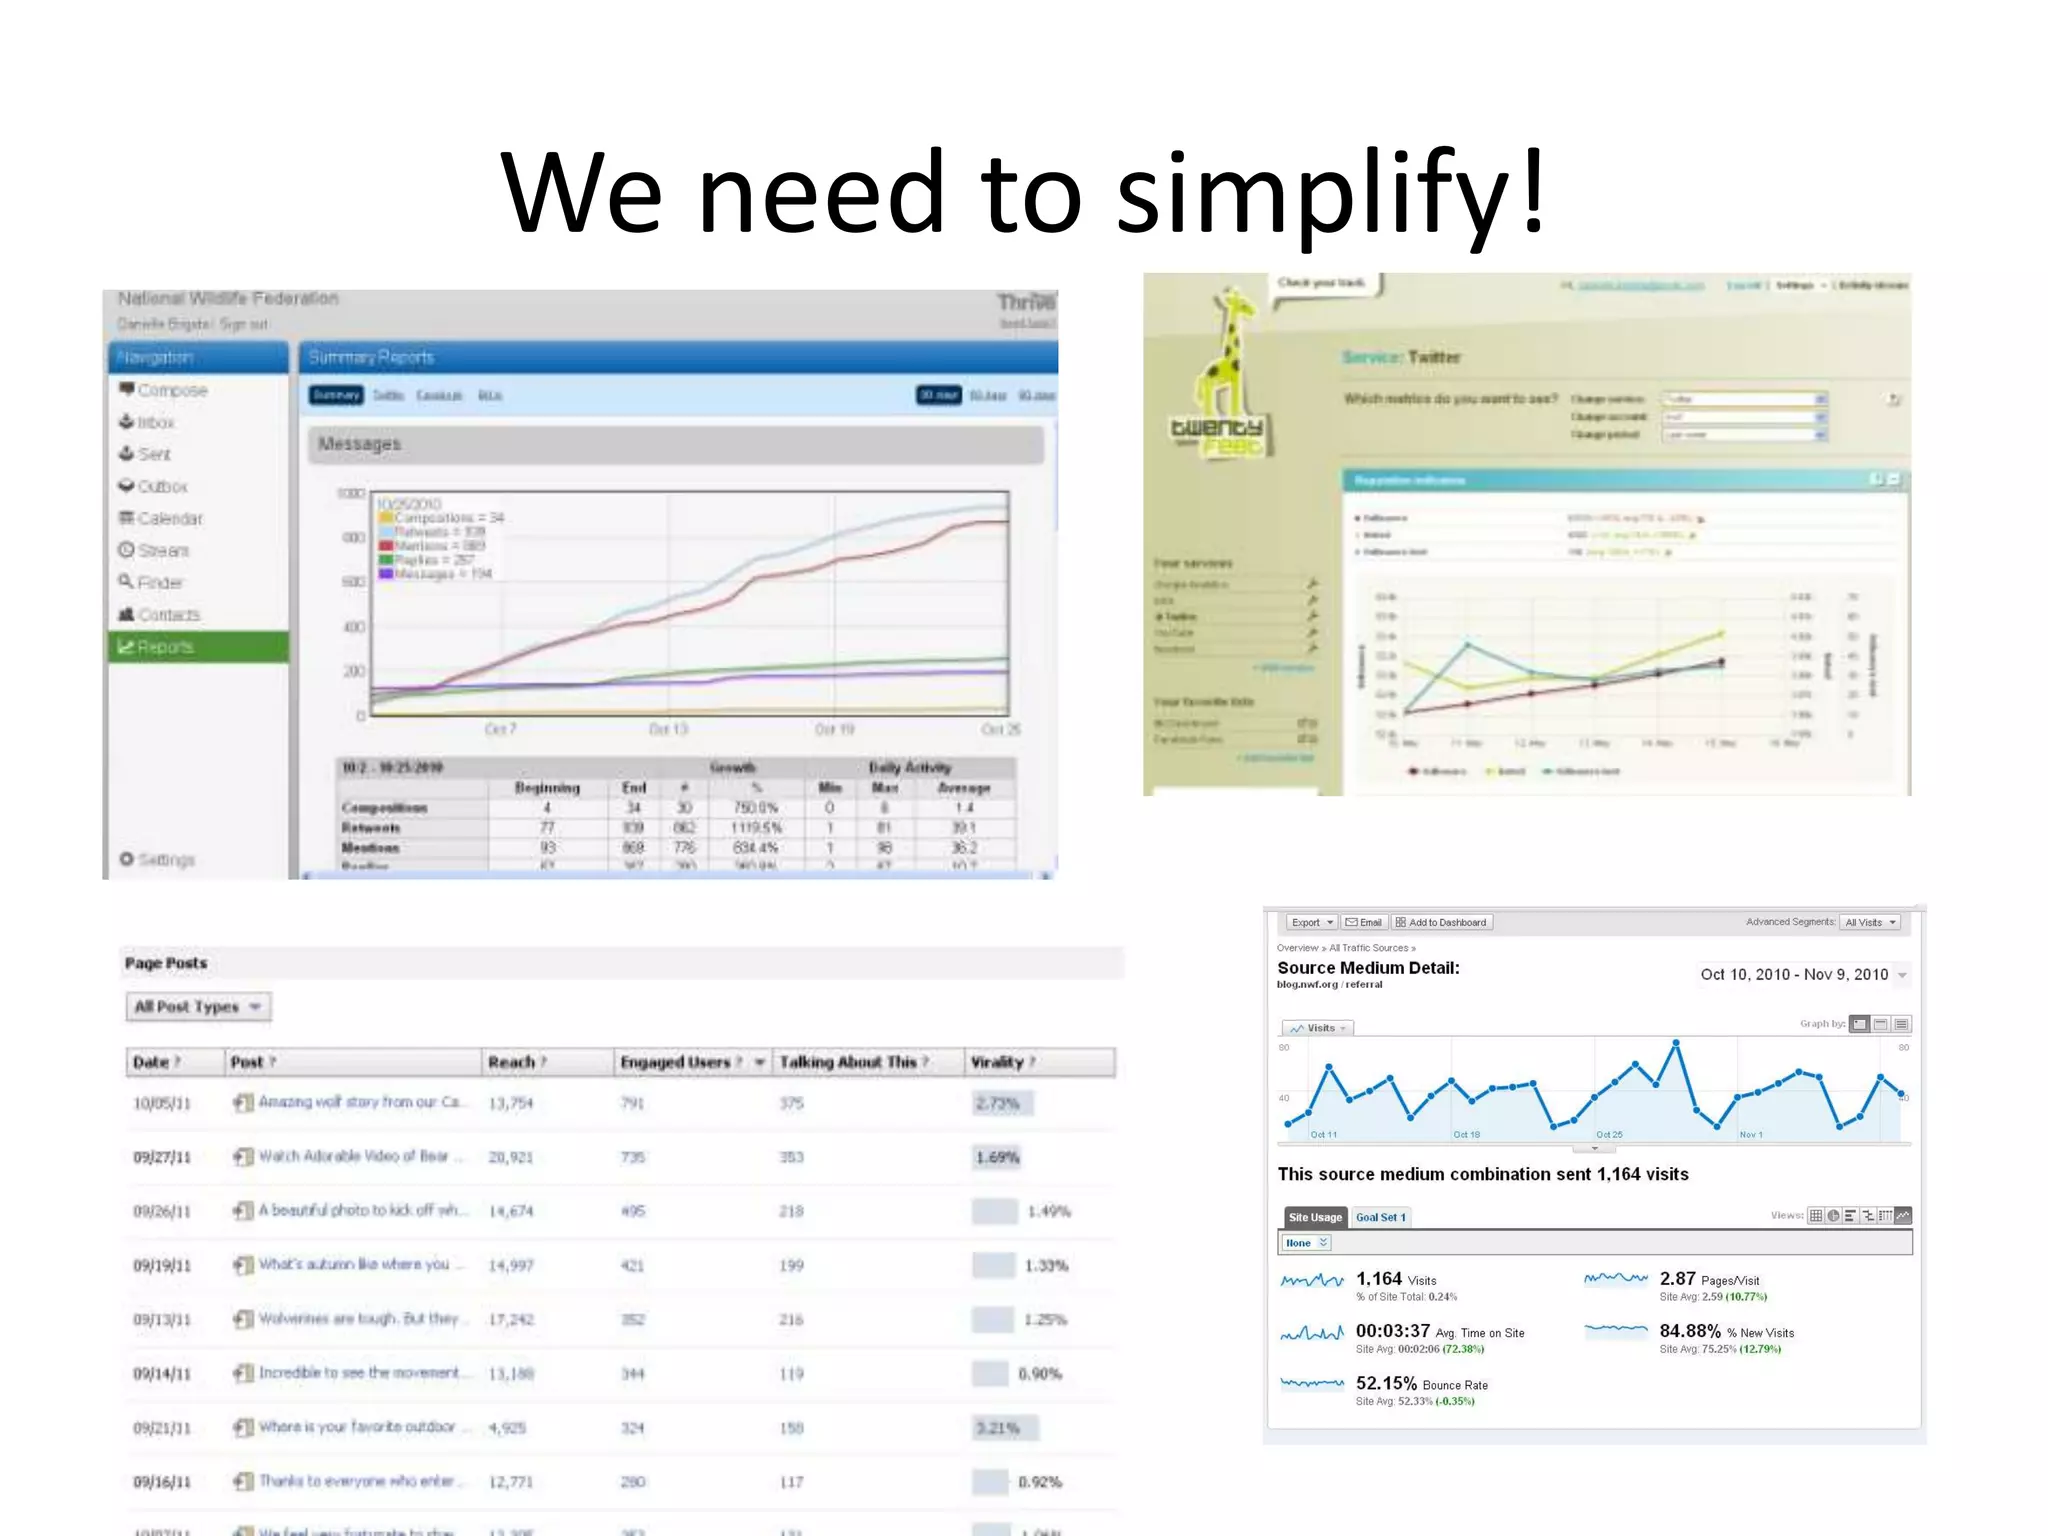
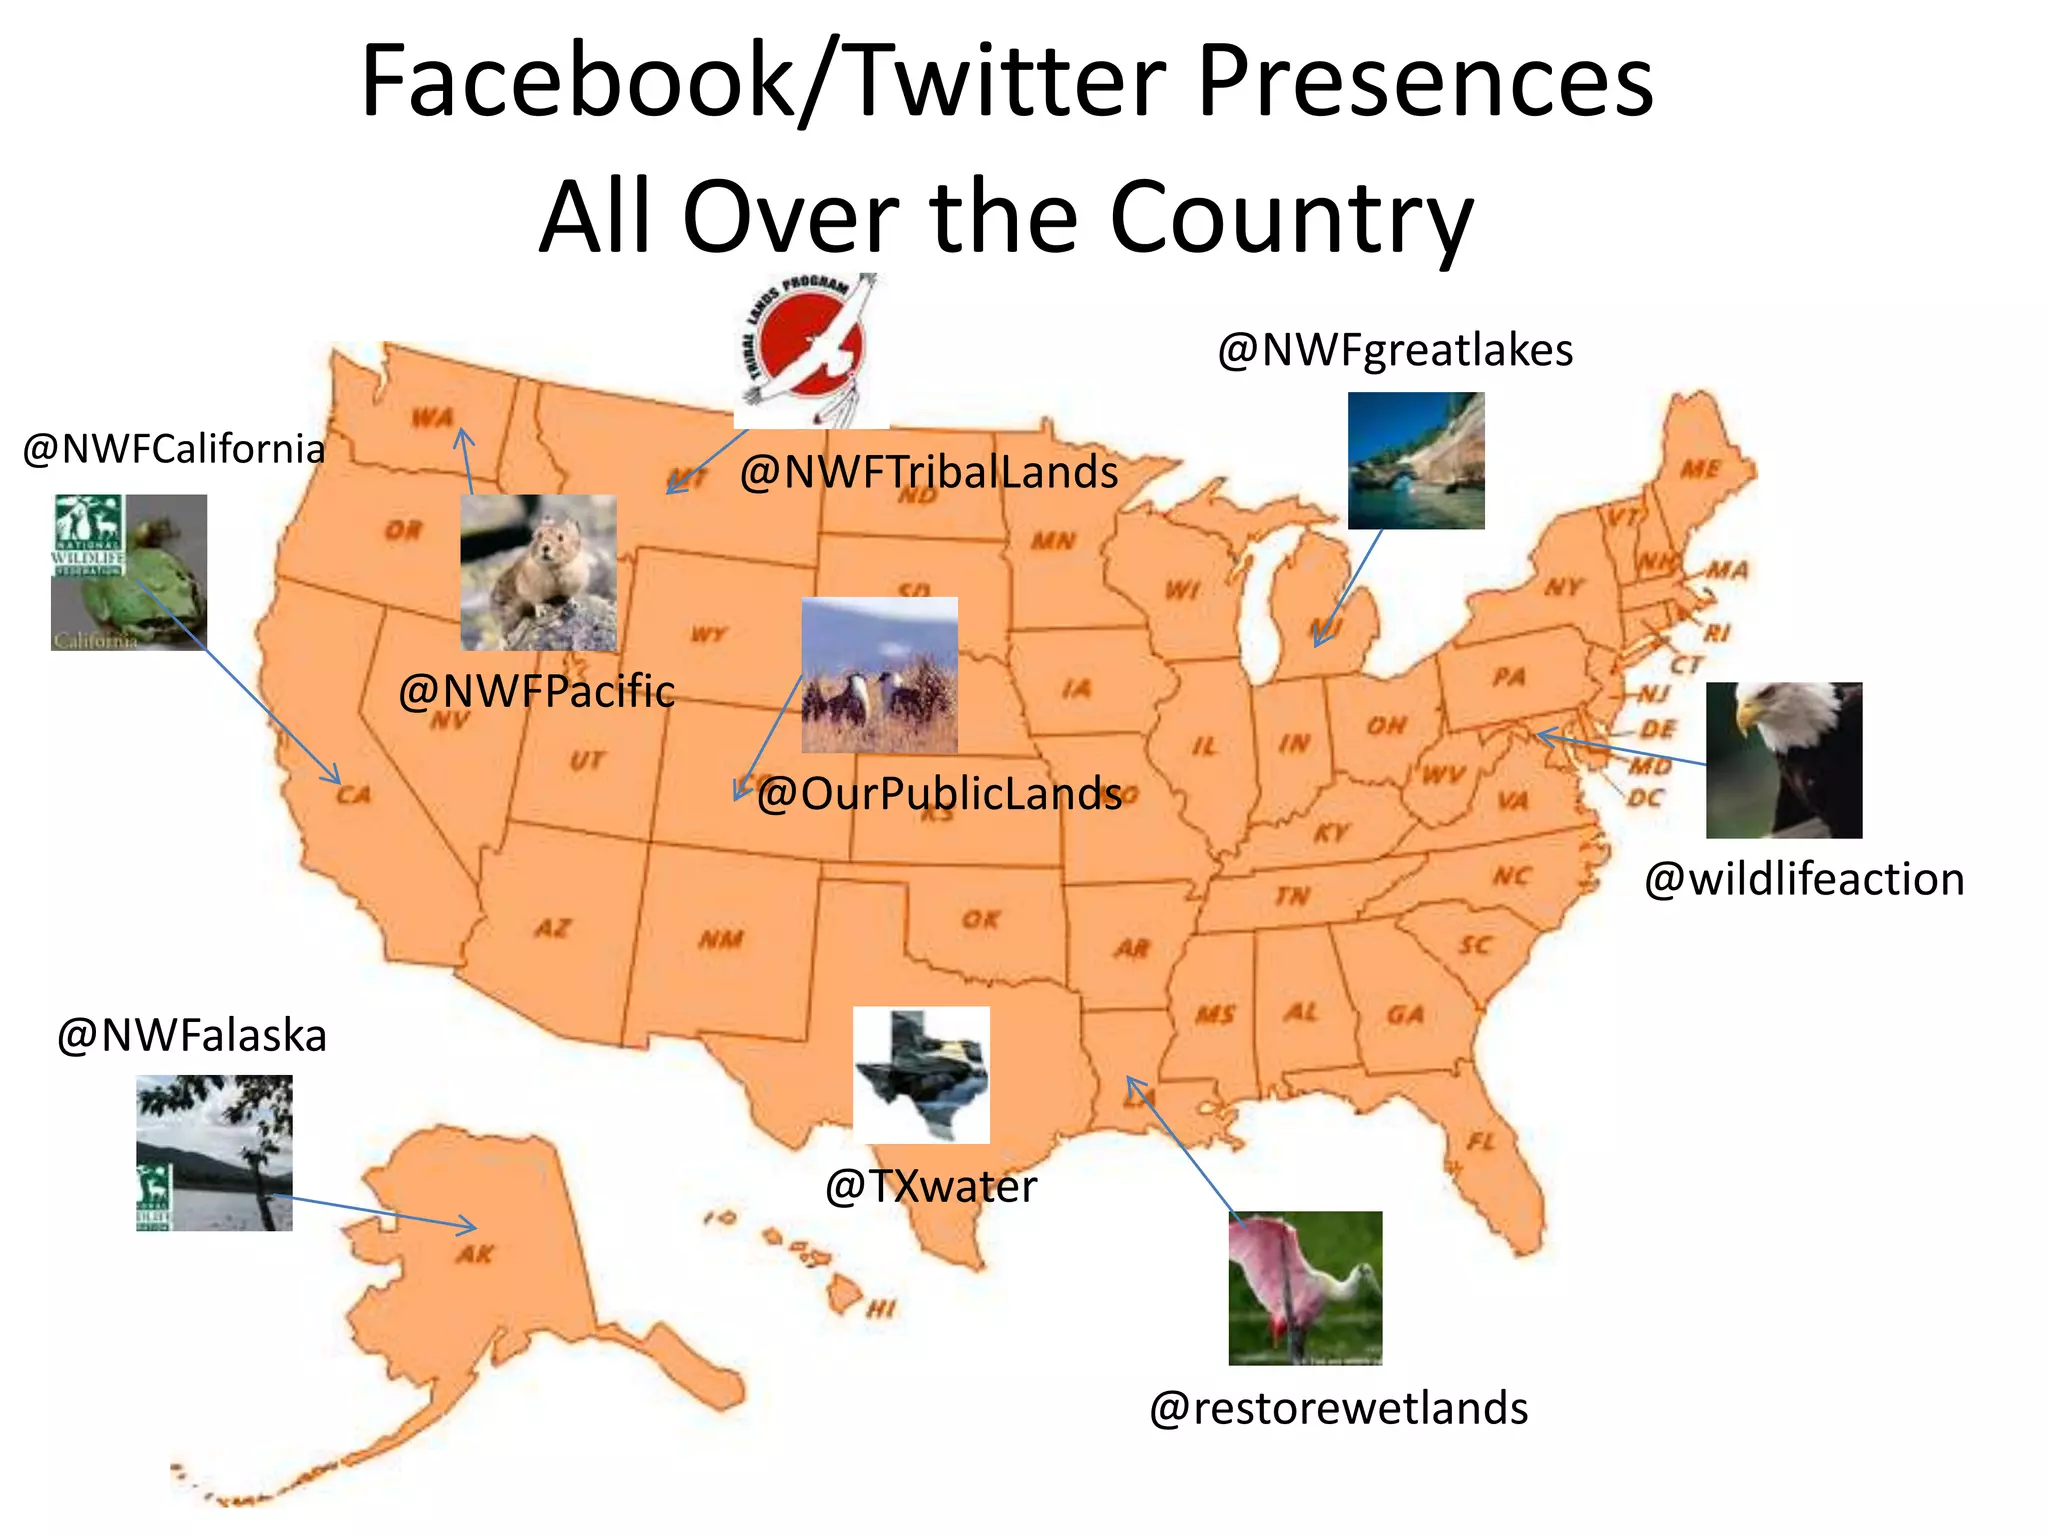
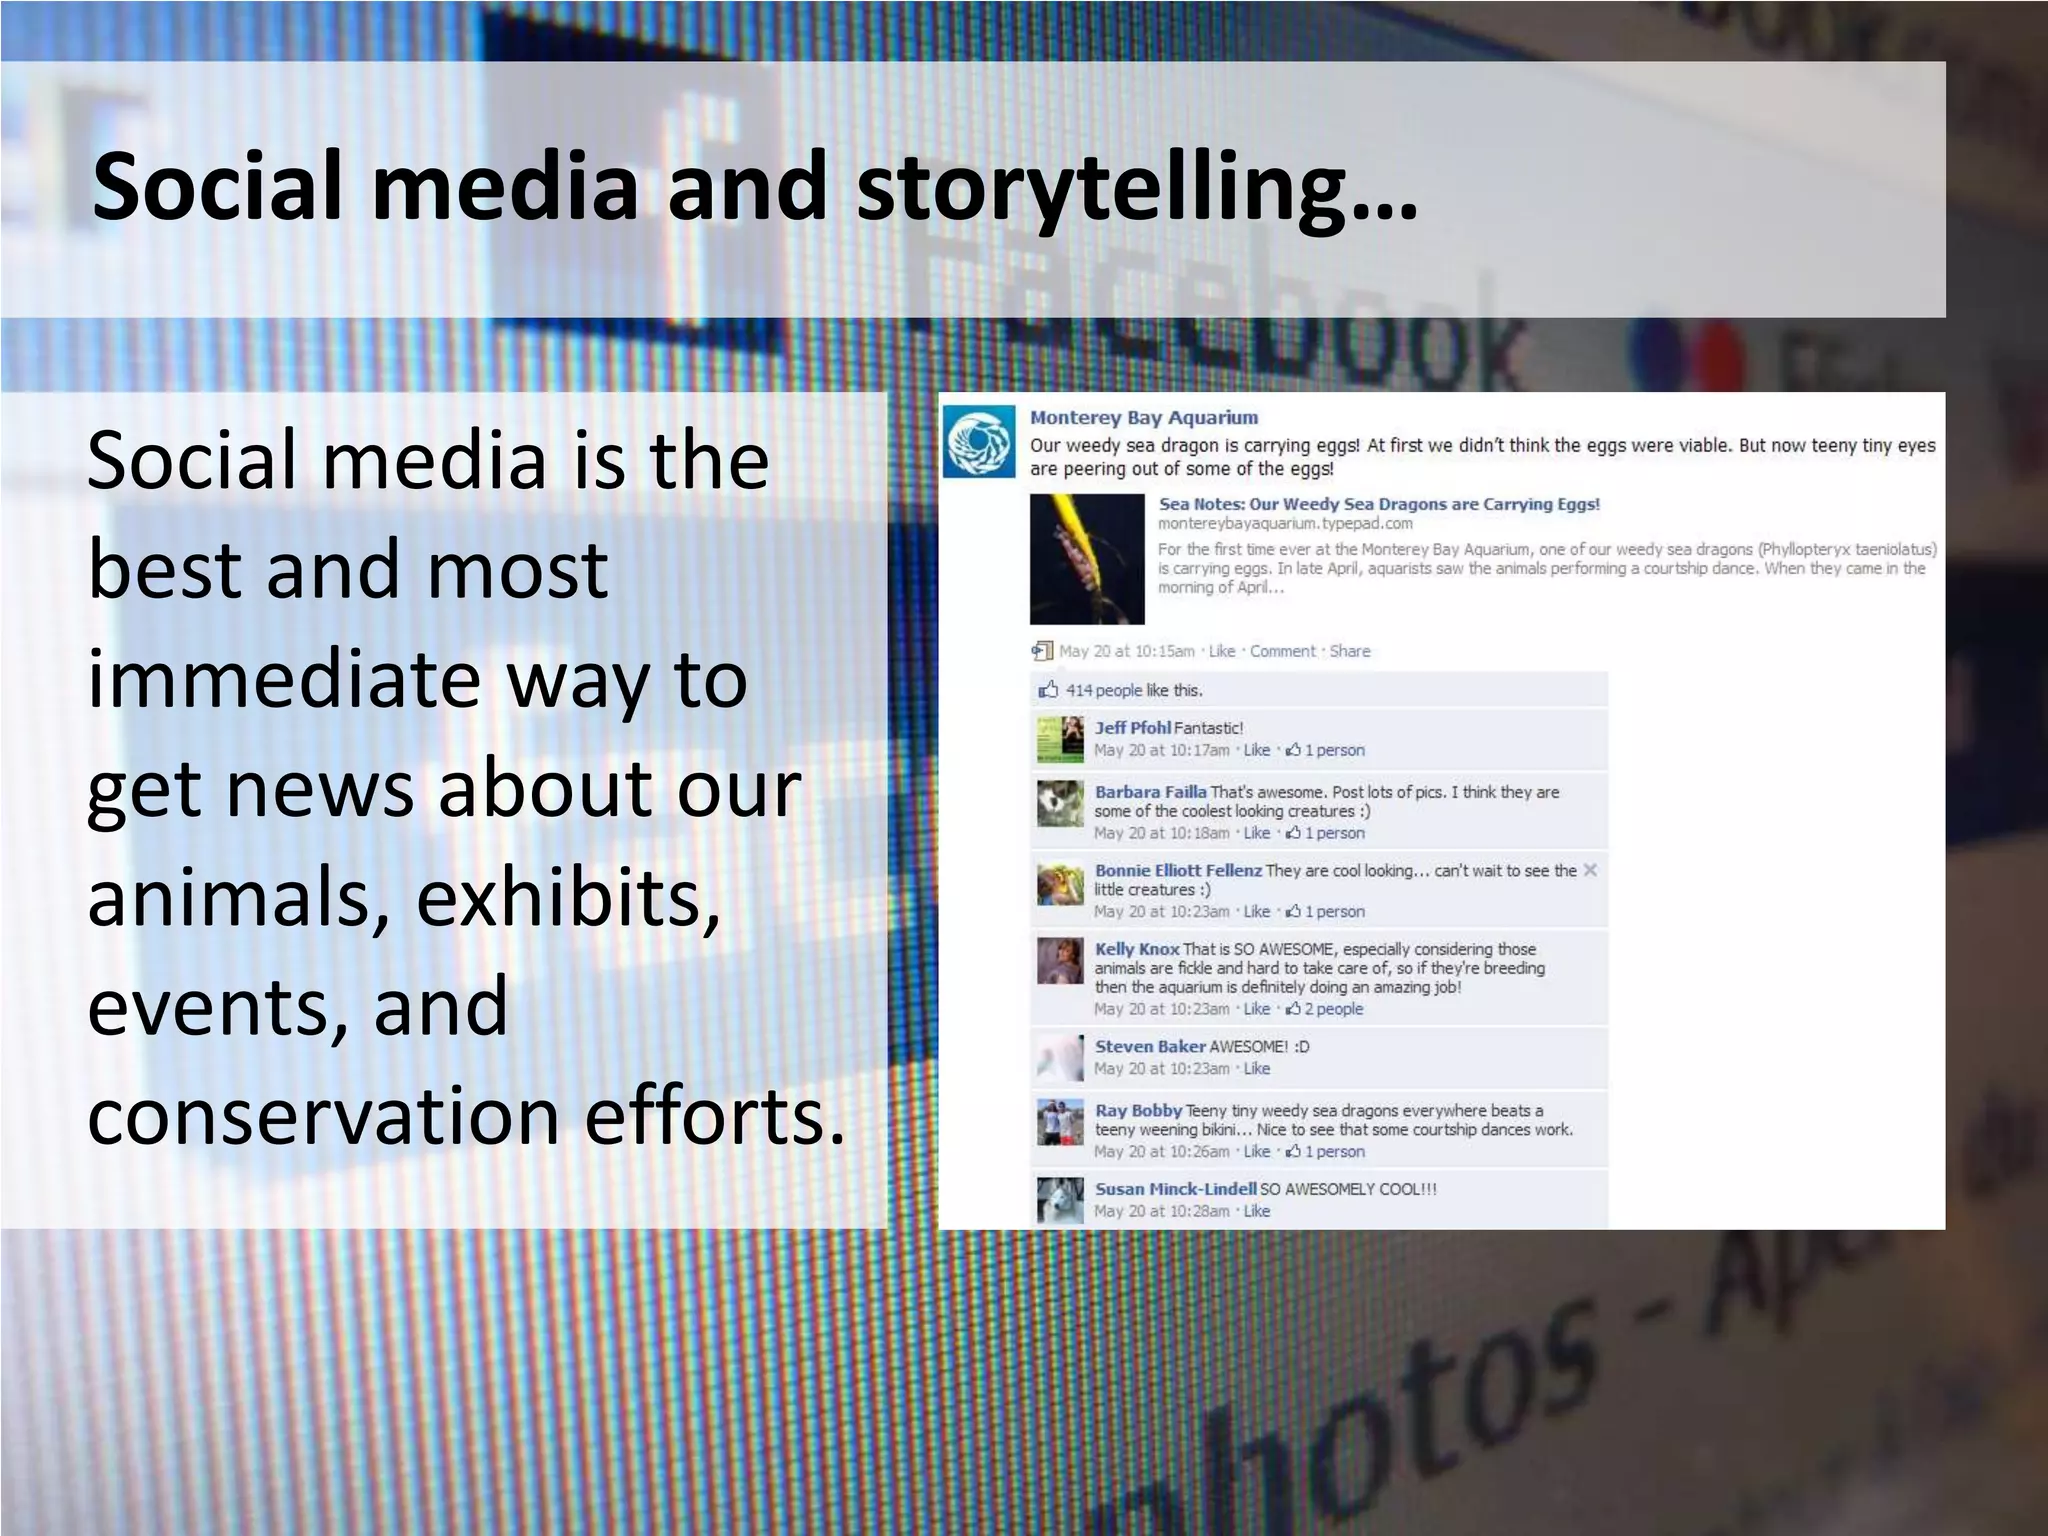
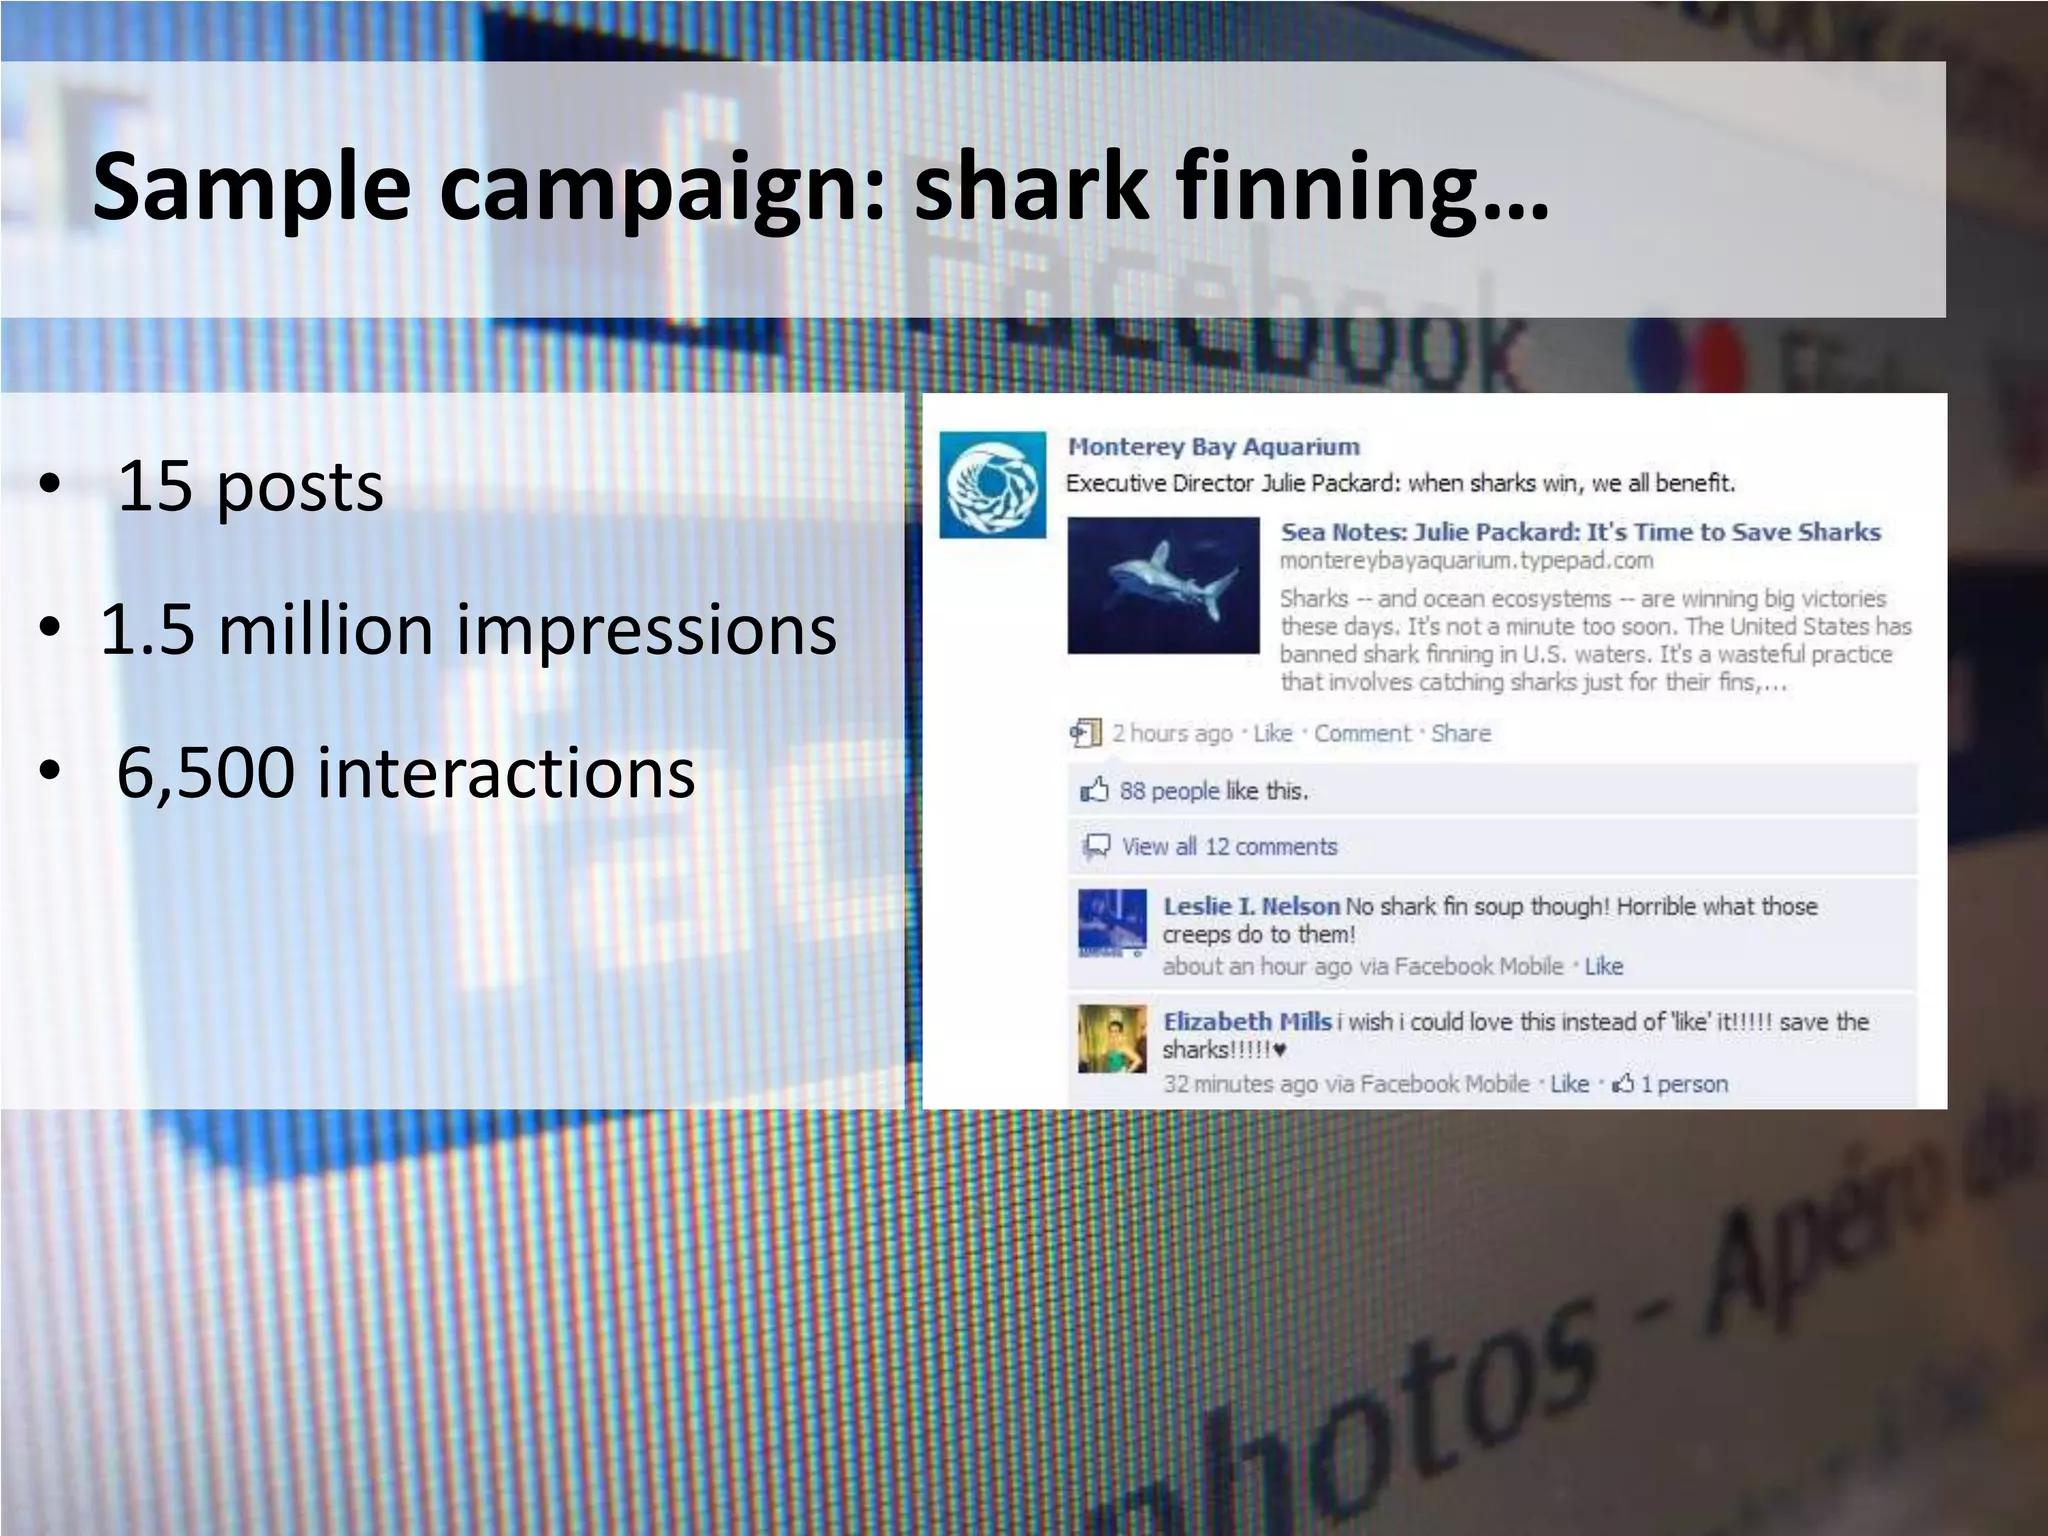
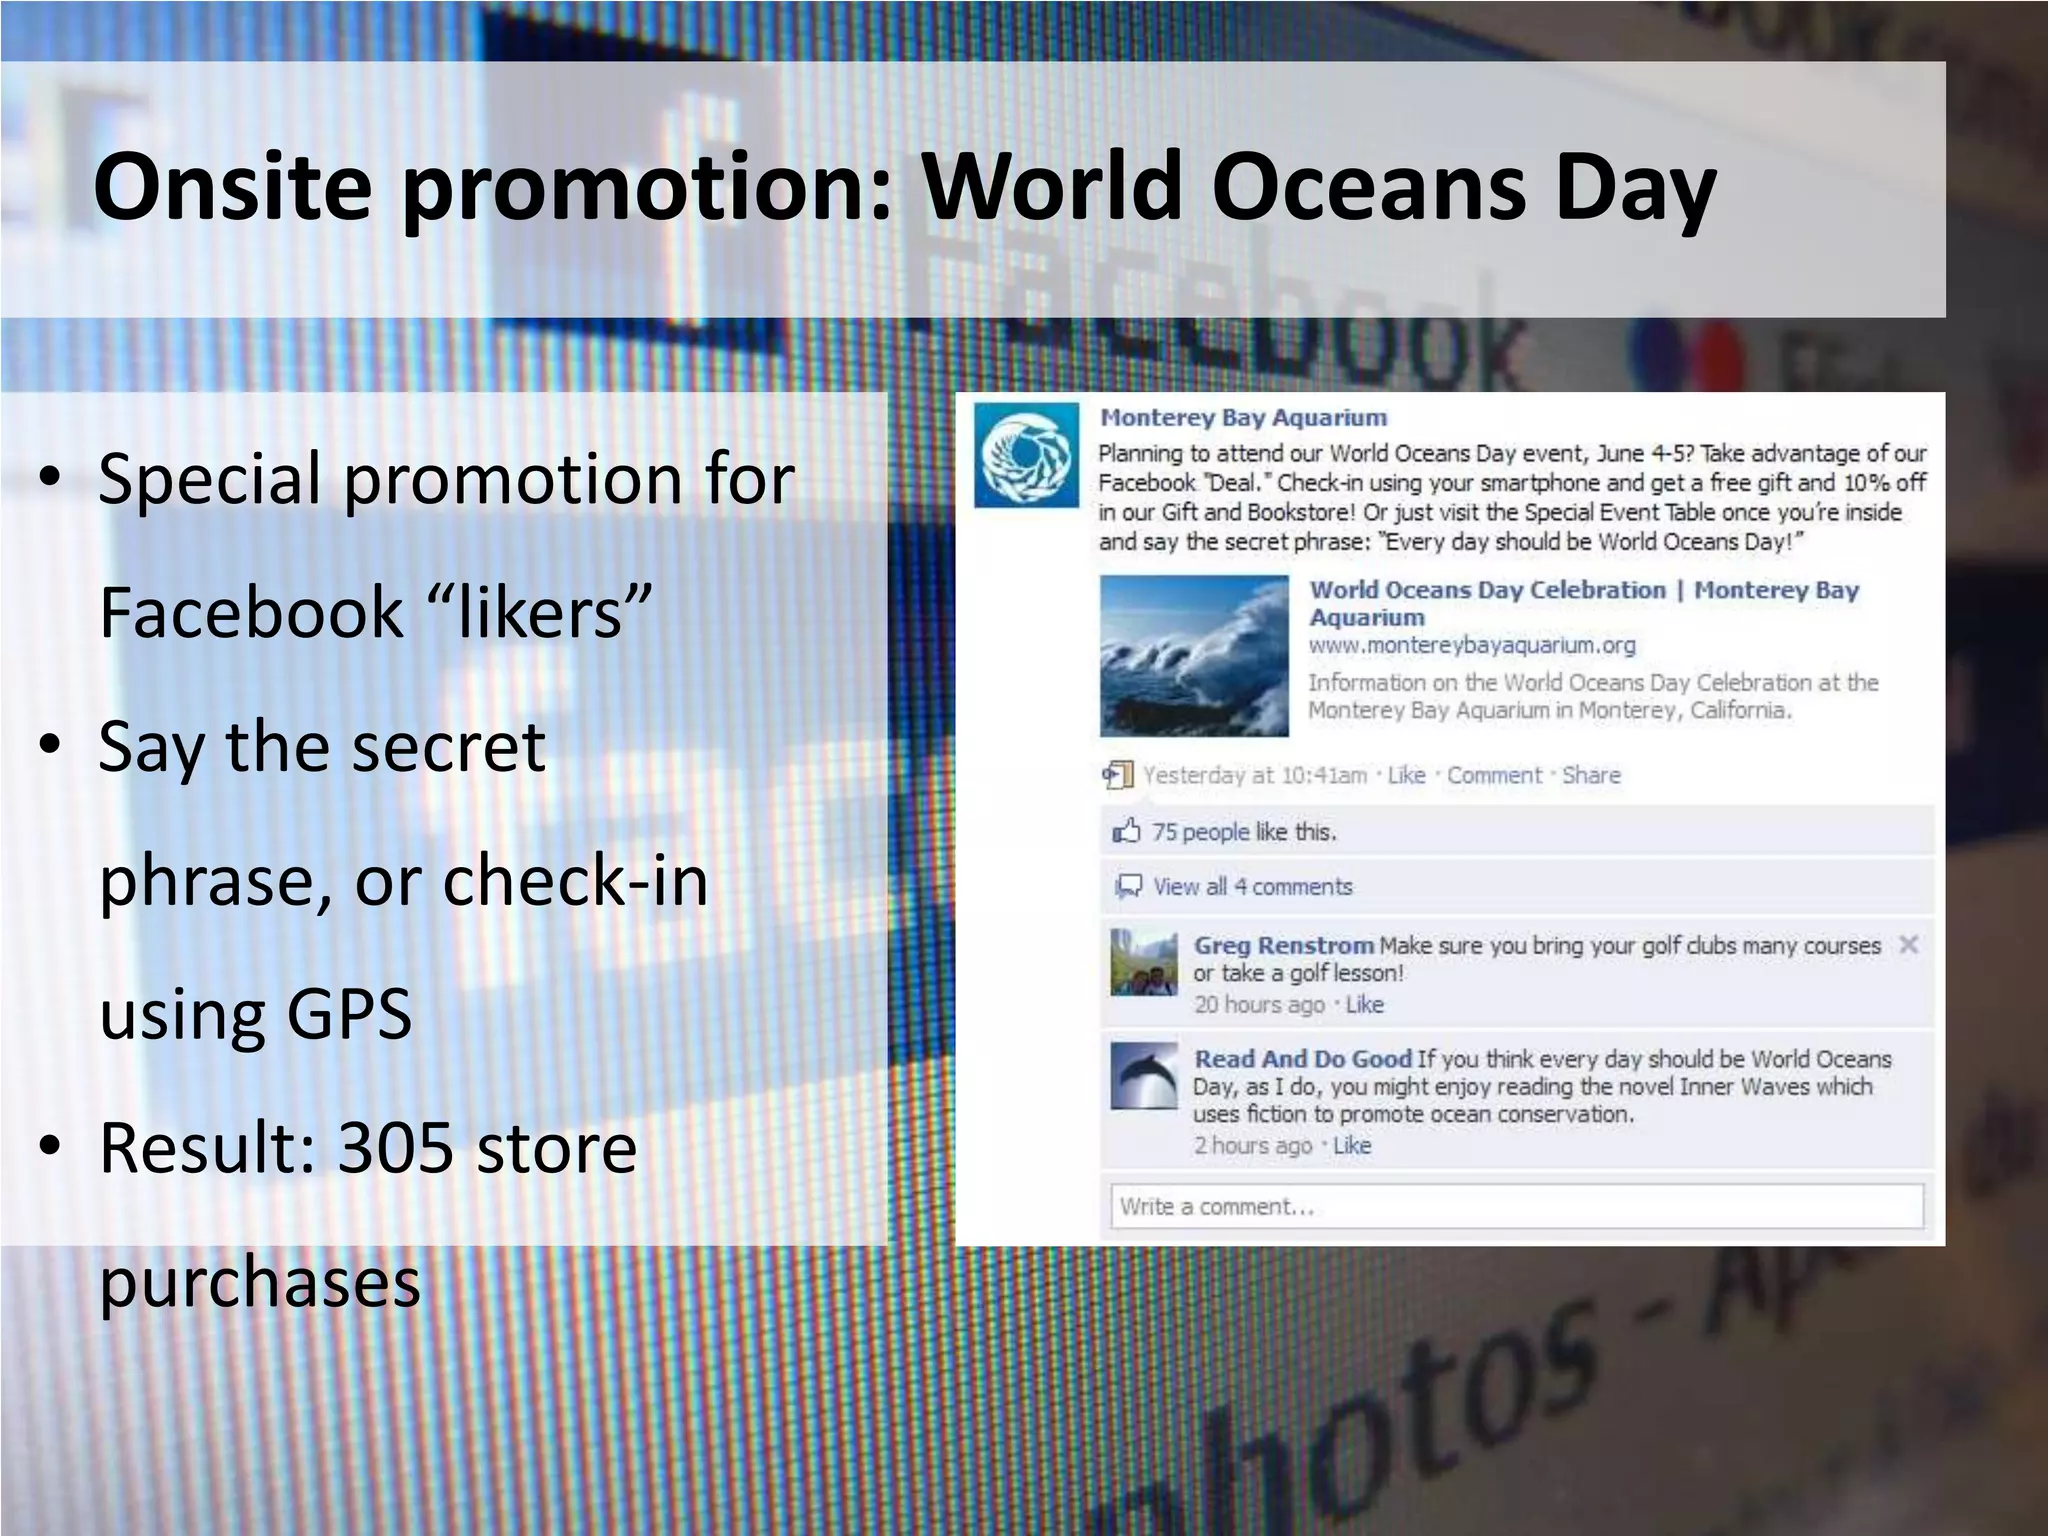
The document summarizes a session on benchmarking and key performance indicators (KPIs) for measuring social media efforts at nonprofits. Three organizations - the American Leadership Forum Silicon Valley, the National Wildlife Federation, and the Monterey Bay Aquarium - shared their experiences developing SMART objectives, identifying relevant peer organizations for benchmarking, and establishing KPIs to track performance. The session provided an overview of benchmarking and KPIs, and highlighted examples and challenges the organizations have faced in designing and implementing social media measurement pilots.
Interested in learning how to transform data or complex, hard to understand information into something more visually appealing and meaningful? Or how to use tools and techniques to more successfully communicate critical information?
In this webinar, the fourth session in the latest 21st Century New Media Series from CALPACT and CHL at UC Berkeley's School of Public Health, join Sheila Baxter and Leslie Safier from Healthy Communities Institute and Leslie Yang, from Awasu Design, as they share how they're using data visualization tools and infographics to innovatively communicate data that matters in a clear and creative way.
Enjoy these slides from the training!
Listen to the webinar here:
http://cc.readytalk.com/play?id=5pq7nu
View the webinar resources here:
http://www.slideshare.net/SPHCalpact/calpact-webinar-using-infographics-and-data-visualization-resources
To learn more about this series, please visit: http://chl.berkeley.edu/events/newmedia/2014-new-media-trainings/sessions.html
Follow Us on Twitter: @CALPACT
Facebook: http://www.facebook.com/CALPACTUCB
Website: www.calpact.org
In the Know II: Creating Your Social Media PlanCDC NPIN
This presentation was used in a webcast that offered public health professionals the methods to successfully create a social media plan. How do you truly connect with your target audience? Developing a plan is one of the first and most important aspects of an engagement strategy. The right plan has many facets that work together to increase the likelihood of success.
How to Measure and Benchmark your Enterprise Social NetworkRachel Happe
How do you measure, benchmark and calculate the ROI of your enterprise social network or your community? This presentation will give you a framework for understanding how to define, baseline, compare and use data in a way that educates and sells stakeholders on the costs and benefits of building a community.
In the Know: LinkedIn & SlideShare for Public Health Webcast PresentationCDC NPIN
This is the second of six interactive webcasts in the series, In the Know: Social Media for Public Health. Each webcast focuses on a different social media channel and provides basic information, tips, success stories, and discussion on how best to use social media to promote public health and expand outreach initiatives.
Using What You Know about Social Media: How to Conduct a Twitter ChatCDC NPIN
This is the 1st in our newest online training opportunity for public health professionals: Using What You Know about Social Media - How to Conduct a Successful Twitter Chat!
This webinar is designed for the nonprofit organization that wants to understand a social media strategy, and what goes into developing one. During the webinar, we’ll discuss the following:
- Benefits of creating a strategy
- How a social media strategy supports overall organizational goals
- Research needed to before you create your strategy
- The major components of a social media strategy
- Tying the social media strategy into the website
- How a social media strategy supports fundraising
Evaluating community projects
These guidelines were initially developed as part of the JRF Neighbourhood Programme. This programme is made up of 20 community or voluntary organisations all wanting to exercise a more strategic influence in their neighbourhood. The guidelines were originally written to help these organisations evaluate their work. They provide step-by-step advice on how to evaluate a community project which will be of interest to a wider audience.
What is evaluation?
Put simply, evaluation by members of a project or organisation will help people to learn from their day-to-day work. It can be used by a group of people, or by individuals working alone. It assesses the effectiveness of a piece of work, a project or a programme. It can also highlight whether your project is moving steadily and successfully towards achieving what it set out to do, or whether it is moving in a different direction. You can then celebrate and build on successes as well as learn from what has not worked so well.
Why evaluate?
Although evaluation may seem like an unnecessary additional task if you are already short of time and resources, it can save you both time and resources by keeping participants focused on, and working towards, the ultimate goal of the project. If necessary, it can refocus activity away from unproductive or unnecessary work.
Build Your Community Subscription ServicesShack Co.
For Startups, Online Community Managers, Digital Teams and Brands. Organise and Grow your Online Brand Community.
Break down Analytics, Assess and Take Informed Decisions.
Epistemic Interaction - tuning interfaces to provide information for AI supportAlan Dix
Paper presented at SYNERGY workshop at AVI 2024, Genoa, Italy. 3rd June 2024
https://alandix.com/academic/papers/synergy2024-epistemic/
As machine learning integrates deeper into human-computer interactions, the concept of epistemic interaction emerges, aiming to refine these interactions to enhance system adaptability. This approach encourages minor, intentional adjustments in user behaviour to enrich the data available for system learning. This paper introduces epistemic interaction within the context of human-system communication, illustrating how deliberate interaction design can improve system understanding and adaptation. Through concrete examples, we demonstrate the potential of epistemic interaction to significantly advance human-computer interaction by leveraging intuitive human communication strategies to inform system design and functionality, offering a novel pathway for enriching user-system engagements.
JMeter webinar - integration with InfluxDB and GrafanaRTTS
Watch this recorded webinar about real-time monitoring of application performance. See how to integrate Apache JMeter, the open-source leader in performance testing, with InfluxDB, the open-source time-series database, and Grafana, the open-source analytics and visualization application.
In this webinar, we will review the benefits of leveraging InfluxDB and Grafana when executing load tests and demonstrate how these tools are used to visualize performance metrics.
Length: 30 minutes
Session Overview
-------------------------------------------
During this webinar, we will cover the following topics while demonstrating the integrations of JMeter, InfluxDB and Grafana:
- What out-of-the-box solutions are available for real-time monitoring JMeter tests?
- What are the benefits of integrating InfluxDB and Grafana into the load testing stack?
- Which features are provided by Grafana?
- Demonstration of InfluxDB and Grafana using a practice web application
To view the webinar recording, go to:
https://www.rttsweb.com/jmeter-integration-webinar
Key Trends Shaping the Future of Infrastructure.pdfCheryl Hung
Keynote at DIGIT West Expo, Glasgow on 29 May 2024.
Cheryl Hung, ochery.com
Sr Director, Infrastructure Ecosystem, Arm.
The key trends across hardware, cloud and open-source; exploring how these areas are likely to mature and develop over the short and long-term, and then considering how organisations can position themselves to adapt and thrive.
Essentials of Automations: Optimizing FME Workflows with ParametersSafe Software
Are you looking to streamline your workflows and boost your projects’ efficiency? Do you find yourself searching for ways to add flexibility and control over your FME workflows? If so, you’re in the right place.
Join us for an insightful dive into the world of FME parameters, a critical element in optimizing workflow efficiency. This webinar marks the beginning of our three-part “Essentials of Automation” series. This first webinar is designed to equip you with the knowledge and skills to utilize parameters effectively: enhancing the flexibility, maintainability, and user control of your FME projects.
Here’s what you’ll gain:
- Essentials of FME Parameters: Understand the pivotal role of parameters, including Reader/Writer, Transformer, User, and FME Flow categories. Discover how they are the key to unlocking automation and optimization within your workflows.
- Practical Applications in FME Form: Delve into key user parameter types including choice, connections, and file URLs. Allow users to control how a workflow runs, making your workflows more reusable. Learn to import values and deliver the best user experience for your workflows while enhancing accuracy.
- Optimization Strategies in FME Flow: Explore the creation and strategic deployment of parameters in FME Flow, including the use of deployment and geometry parameters, to maximize workflow efficiency.
- Pro Tips for Success: Gain insights on parameterizing connections and leveraging new features like Conditional Visibility for clarity and simplicity.
We’ll wrap up with a glimpse into future webinars, followed by a Q&A session to address your specific questions surrounding this topic.
Don’t miss this opportunity to elevate your FME expertise and drive your projects to new heights of efficiency.
Transcript: Selling digital books in 2024: Insights from industry leaders - T...BookNet Canada
The publishing industry has been selling digital audiobooks and ebooks for over a decade and has found its groove. What’s changed? What has stayed the same? Where do we go from here? Join a group of leading sales peers from across the industry for a conversation about the lessons learned since the popularization of digital books, best practices, digital book supply chain management, and more.
Link to video recording: https://bnctechforum.ca/sessions/selling-digital-books-in-2024-insights-from-industry-leaders/
Presented by BookNet Canada on May 28, 2024, with support from the Department of Canadian Heritage.
Builder.ai Founder Sachin Dev Duggal's Strategic Approach to Create an Innova...Ramesh Iyer
In today's fast-changing business world, Companies that adapt and embrace new ideas often need help to keep up with the competition. However, fostering a culture of innovation takes much work. It takes vision, leadership and willingness to take risks in the right proportion. Sachin Dev Duggal, co-founder of Builder.ai, has perfected the art of this balance, creating a company culture where creativity and growth are nurtured at each stage.
Dev Dives: Train smarter, not harder – active learning and UiPath LLMs for do...UiPathCommunity
💥 Speed, accuracy, and scaling – discover the superpowers of GenAI in action with UiPath Document Understanding and Communications Mining™:
See how to accelerate model training and optimize model performance with active learning
Learn about the latest enhancements to out-of-the-box document processing – with little to no training required
Get an exclusive demo of the new family of UiPath LLMs – GenAI models specialized for processing different types of documents and messages
This is a hands-on session specifically designed for automation developers and AI enthusiasts seeking to enhance their knowledge in leveraging the latest intelligent document processing capabilities offered by UiPath.
Speakers:
👨🏫 Andras Palfi, Senior Product Manager, UiPath
👩🏫 Lenka Dulovicova, Product Program Manager, UiPath
GDG Cloud Southlake #33: Boule & Rebala: Effective AppSec in SDLC using Deplo...James Anderson
Effective Application Security in Software Delivery lifecycle using Deployment Firewall and DBOM
The modern software delivery process (or the CI/CD process) includes many tools, distributed teams, open-source code, and cloud platforms. Constant focus on speed to release software to market, along with the traditional slow and manual security checks has caused gaps in continuous security as an important piece in the software supply chain. Today organizations feel more susceptible to external and internal cyber threats due to the vast attack surface in their applications supply chain and the lack of end-to-end governance and risk management.
The software team must secure its software delivery process to avoid vulnerability and security breaches. This needs to be achieved with existing tool chains and without extensive rework of the delivery processes. This talk will present strategies and techniques for providing visibility into the true risk of the existing vulnerabilities, preventing the introduction of security issues in the software, resolving vulnerabilities in production environments quickly, and capturing the deployment bill of materials (DBOM).
Speakers:
Bob Boule
Robert Boule is a technology enthusiast with PASSION for technology and making things work along with a knack for helping others understand how things work. He comes with around 20 years of solution engineering experience in application security, software continuous delivery, and SaaS platforms. He is known for his dynamic presentations in CI/CD and application security integrated in software delivery lifecycle.
Gopinath Rebala
Gopinath Rebala is the CTO of OpsMx, where he has overall responsibility for the machine learning and data processing architectures for Secure Software Delivery. Gopi also has a strong connection with our customers, leading design and architecture for strategic implementations. Gopi is a frequent speaker and well-known leader in continuous delivery and integrating security into software delivery.
DevOps and Testing slides at DASA ConnectKari Kakkonen
My and Rik Marselis slides at 30.5.2024 DASA Connect conference. We discuss about what is testing, then what is agile testing and finally what is Testing in DevOps. Finally we had lovely workshop with the participants trying to find out different ways to think about quality and testing in different parts of the DevOps infinity loop.
Accelerate your Kubernetes clusters with Varnish CachingThijs Feryn
A presentation about the usage and availability of Varnish on Kubernetes. This talk explores the capabilities of Varnish caching and shows how to use the Varnish Helm chart to deploy it to Kubernetes.
This presentation was delivered at K8SUG Singapore. See https://feryn.eu/presentations/accelerate-your-kubernetes-clusters-with-varnish-caching-k8sug-singapore-28-2024 for more details.
Software Delivery At the Speed of AI: Inflectra Invests In AI-Powered QualityInflectra
In this insightful webinar, Inflectra explores how artificial intelligence (AI) is transforming software development and testing. Discover how AI-powered tools are revolutionizing every stage of the software development lifecycle (SDLC), from design and prototyping to testing, deployment, and monitoring.
Learn about:
• The Future of Testing: How AI is shifting testing towards verification, analysis, and higher-level skills, while reducing repetitive tasks.
• Test Automation: How AI-powered test case generation, optimization, and self-healing tests are making testing more efficient and effective.
• Visual Testing: Explore the emerging capabilities of AI in visual testing and how it's set to revolutionize UI verification.
• Inflectra's AI Solutions: See demonstrations of Inflectra's cutting-edge AI tools like the ChatGPT plugin and Azure Open AI platform, designed to streamline your testing process.
Whether you're a developer, tester, or QA professional, this webinar will give you valuable insights into how AI is shaping the future of software delivery.
Software Delivery At the Speed of AI: Inflectra Invests In AI-Powered Quality
Measurement Peer Group #4
1. Peer Exchange Group 2:
Measuring the
Networked
Nonprofit:
Proving Results To Improve
Session 4: October 27, 2011
Benchmarking: Networked
Nonprofits Measure Social
Media in Context
Beth Kanter,
Visiting Scholar, Social Media and Nonprofits
The David and Lucile Packard Foundation
Organizational Effectiveness Program
2. Welcome!
If you experience any technical difficulties
logging into the system, please contact
Ready/Talk Customer support:
800.843.9166
Please use *6 to Mute your conference
line
While we are waiting, type into the chat:
Have you finished designing your
measurement pilot plan? What is most
exciting about it? What is most
challenging?
3. This call is being
recorded
*2
Flickr Photo
by Malinki
4. Peer Exchange Group 2:
Measuring the
Networked
Nonprofit:
Proving Results To Improve
Session 4: October 27, 2011
Benchmarking: Networked
Nonprofits Measure Social
Media in Context
Beth Kanter,
Visiting Scholar, Social Media and Nonprofits
The David and Lucile Packard Foundation
Organizational Effectiveness Program
5. On The“wikito Today your reflections
Don’t forget jot down
in your
Call
journal”
Beth Kanter Becky Jain
6. Agenda
A Few Reminders
Beth’s Reflection/Journal
Last Month: Quick Review
Definitions: Benchmarking and KPIs
Measurement Pilot: Peer Share
Debbie Ford-Scriba, ALFSV
Danielle Brigida, NWF
Geoff Drake, MBAYAQ
Next Session
Reflection
Ask Your Questions and Share Your Insights in the Chat!
Hashtag: #measurenp
7. Reminders to jot down your reflections
Don’t forget
in your “wiki journal”
Wiki Journals
Facebook Group
Office Hours
Scoop.It Resources
8. Beth’s Journal
Program Outcomes
At least 50% of 27 participants implement a
social media measurement pilot that helps
document value/results or improve social
media practice by end of the Peer Group
1/2012
At least 50% of 27 participants, generate
case studies and/or insightful quotes for the
Measuring the Networked Nonprofit book by
1/2012
http://measure-netnon.wikispaces.com/Beth-Kanter-Journal
9. Beth’s Journal
85% have written about their pilot in the
wiki journal
44% have had used the office hours
90% have joined FB group
90% attendance on calls (playbacks)
http://measure-netnon.wikispaces.com/Beth-Kanter-Journal
10. QUICK POLL
-Have not started planning/designing
-Have started planning/designing, but
not finished because stuck or have
questions
-Finished designing, haven’t started
implementation yet
-Finished designing, started
implementing
-Finished implementing
12. CHAT:
If you have started planning/designing,
but not finished - why? Are you stuck?
Do you have questions? What do you
need to move forward?
13. Strategy
Plan
Research
Refine
Do
Adapt KD Paine’s Basic
Steps
Measurement
STEPS
Analyze Measure
14. KD Paine’s Basic Steps
Define Results
Strategy
Benchmarks
Metrics – KPI
Costs
Select Right Tool To Collect Data
Turn Data in Action
15. How will I
know if I got
taller next
year?
Measurement is a Comparable Tool
16. Benchmark: a point of reference from
which measurements may be made
The most effective comparisons are to peer organizations or
to your organization’s past performance over time.
What is important is to benchmark against what matters to
your organization.. essentially whatever keeps the board and
the executive director up at night.
17. Benchmark Study: Looks at larger group of
organizations or departments using a metric and also
learning about strategy and tactics. Prelude to
measurement process, part of strategy formation and
ongoing learning.
18. Key Peformance Indicators:
Most important metrics based on data that you can collect to measure your progress
towards reaching your SMART objectives.
No more than 7!
You become what you measure, so they have to be meaningful, actionable and relevant.
Fundraising
% increase in donations
% increase in new donors or members
% reduction in cost per member acquired
Social Media
% increase in share of desirable coverage (desirable can mean positive tone, favorable
positioning,
% increase in share of conversation
% increase in number of supporting conversations (expressing support for the cause)
% increase in conversation that contains our key messages
19. Linking Benchmarks and KPIs to SMART Objectives
for Social Media
Debbie Ford-Scriba, American Leadership Forum Silicon Valley
29. What are the SMART objectives?
Benchmark Study NWF Outreach
6 Regional Offices/Programs improve
Educate x number of people about
Twitter/FB practice by learning from
NWF issues and viewpoints
benchmarking study process
NWF creates a shared dashboard that
X number of share NWF messages
easily allows programs to view data
NWF facilitates dialogue between 6 X number of advocates are inspired to
regional programs that leads to one take action (calling legislators, one-
insight per month click actions, on FB, or Twitter)
X number of people donate to NWF
through social media channels
30. Where we started…
• Monthly Blog Report
– Top visited posts
– Top shared posts
• Quarterly Report
– Number of Followers/Fans
– Visited content
– Shared content
– Lessons Learned/Successes
– Tips/Tricks and Industry Trends
31. Ways We Measure Social Media
• Web Analytics
• Sharing Analytics
• Subscribers
• Linked Sites
• Comments
• Actions
33. Facebook/Twitter Presences
All Over the Country
@NWFgreatlakes
@NWFCalifornia
@NWFTribalLands
@NWFPacific
@OurPublicLands
@wildlifeaction
@NWFalaska
@TXwater
@restorewetlands
34. Goals
Benchmarking Study:
Create a process for collecting
data across the organization and learning from it
Design: Use our social KPI’s and create
a dashboard that’s online and easily accessed.
35. Gathering Input
Facebook Twitter Klout
# of Fans # of Followers Klout Score
# of People Talking # of Mentions/RTs N/A
About This
# of Posts # of Posts N/A
39. Our Objectives:
-To drive attendance to exhibits, programs, and activities at
the Aquarium
-To keep people connected to the Aquarium before, during,
and after visit regardless of geography
Key Facebook Measurements:
- Facebook check-ins
- Facebook Deal redemptions
- Growth in Likes
- Growth in Interactions (now “Talking About”)
- Comparison of content types (photos vs. videos, subject
matter)
42. Social media and storytelling…
Social media is the
best and most
immediate way to
get news about our
animals, exhibits,
events, and
conservation efforts.
43. How often and when we post…
• Facebook: 10 am and 2 pm
• Twitter:
– All Facebook posts
– Conservation and other news
throughout day (no limit)
– Use scheduling tool such as
Tweetdeck
44. What we measure: overall fan growth…
MBA Facebook
120,000
100,000
80,000
60,000
40,000
20,000
0
4/13/09 8/11/09 12/9/09 4/8/10 8/6/10 12/4/10 4/3/11
45. What we measure: Facebook
interactions, (now “Talking About”)…
MBA Facebook Interactions
3,500
3,000
2,500
2,000
1,500
1,000
500
0
2/8/10 5/9/10 8/7/10 11/5/10 2/3/11 5/4/11
47. Our strategy…
• Translate social media success into onsite activity and
conservation action
• Work with departments throughout the Aquarium to
implement goals
• Measure, improve, measure some more!
48. Onsite promotion: World Oceans Day
• Special promotion for
Facebook “likers”
• Say the secret
phrase, or check-in
using GPS
• Result: 305 store
purchases
49. What’s next?
• We’re working on the appropriate level of
engagement for individuals at the Aquarium
• Social media policy soon to be rolled out
• We’re making social media part of how we do
business!
50. CHAT:
Reflection Questions:
What do you need to benchmark to put
your SMART objectives in a context?
What is an easy and simple way to
implement benchmarking?
What are your KPIs?
51. Next Session: Overview of
Measurement Tools
November 17th 11:00 am PST/ 2:00 EST
Tool Share: Five Minute Presentations
from participants
Homework: Complete the description
of your project using worksheet from
Session 2. Start benchmarking and
identifying KPIs
Identify what you need to move forward
– what’s keeping you back
Office Hours
Editor's Notes
What are benchmarks? What are KPIs?How to define the perfect KPINetworked learning with benchmarksReflection Questions:What do you need to benchmark to put your SMART objectives in a context?What is an easy and simple way to implement benchmarking?What are your KPIs?
Remind people to call for tech support*6 to mute conference line*7 unmuteFinish the plan for measurement pilot. Take the first steps. Figure out what's holding you back and do it. Set up an office session if you need it!
http://www.flickr.com/photos/malinki/2621920871/sizes/o/Start recording about 2 minutes late to let people join *2
What are benchmarks? What are KPIs?How to define the perfect KPINetworked learning with benchmarksReflection Questions:What do you need to benchmark to put your SMART objectives in a context?What is an easy and simple way to implement benchmarking?What are your KPIs?
Beth will read list of participantsBeth will introduce herself“The last few calls I realized that it was hard for me to moderate, work the software, take notes, read the chat and present. So, I’m lucky to have recruited a fabulous co-moderator, Becky Jain. She is going to help me with the back channel – the chat.Becky is a blogger and active on many social media communities. After studying at Wesleyan and the London School of Economics, she came to India to live with her husband, and to work in the development sector. Say hello!
This is our agenda – we’ll pause along the way for questions.Use this #measurenp on Twitter
If you haven’t started keeping your wiki journal, please try to spend a few minutes on the site.If you haven’t joined the Facebook Group, please do so https://www.facebook.com/groups/193416010707686?ap=1Remember, office hours if you’re feeling stuck. I’ve added some more optionshttp://measure-netnon.wikispaces.com/Office+Hours_Group+2As soon as we get the pilot projects organized, I’ll add some small group cohort coaching time
I’m keeping a public journal too – about the program and using it to reflect on what I’m learning about tracking the program against the SMART objectives. I will be tweaking as we go to get better results …. And welcome you to add your reflectionshttp://measure-netnon.wikispaces.com/Beth-Kanter-Journal
In KD Paine’s decades of experience, the measurement process looks like this – no matter what you’re measuring to get at measuring what matters … The strategy piece includes creating a plan, it might include research (audience research or benchmarking w/peers). For some of you, your pilot might be “prospective” – as part of planning a future campaign or program. Or it might be analyzing the past – something you’ve already implemented but want to go back and measure results/value for planning next reiteration or to do present to senior management to pave the way for more incorporating social media into your program delivery or communications channel. The do part – your tactics, tools – The measure is your data collection – as part of your strategy you define this – it includes analysis – you don’t just collect data, you figure out what it means in terms of improving your results – and then you adapt your plan/strategy and the cycle continues.Make sense? Does this sound familiar? Is this way you measure other programs or communications efforts that do not include social media?
These are the basic steps that you will follow for your measurement pilot …. Or any project that involves social media ..The challenge here is that you are not just measuring, but measuring around your practice or strategy.The pilot is making it very simple.What are benchmarks? What are KPIs?How to define the perfect KPINetworked learning with benchmarksReflection Questions:What do you need to benchmark to put your SMART objectives in a context?What is an easy and simple way to implement benchmarking?What are your KPIs?
http://www.flickr.com/photos/kevlar/2636361561/sizes/o/in/faves-cambodia4kidsorg/Measurement is a comparable tool. One of the most common question that many nonprofits ask when crafting SMART objectives is, “How do you know that we’ve identified the right how many number?” You always want to know not just the number of the month or the quarter, but whether that number is bigger or smaller than something else. Last month, or last quarter, or the peer organizations. So the next step in this process is to decide what you are going to compare yourself to. The most effective comparisons are to peer organizations or to your organization’s past performance over time. Sometimes the latter is difficult because social media is relatively new for many nonprofits. So most organizations begin by measuring over time, and then add in peer institutions or organizations with whom you might collaborate with … for share of volunteer hours or share of wallet. Again, what is important is to benchmark against what matters to your organization.. essentially whatever keeps the board and the executive director up at night. Doing a benchmark study of similar organizations doesn’t have to be an elaborate time consuming burden. Pang HouaMoua is the first communications director hired for SEARAC, a national organization that advances the interests of Cambodian, Laotian, and Vietnamese Americans by empowering communities through advocacy, leadership development, and capacity building to create a socially just and equitable society.“I didn’t want to pick a number of out of the air – or one that was too high and created unrealistic expectations or a number that was so low that we easily made it.”
Measurement is a comparable tool. “I didn’t want to pick a number of out of the air – or one that was too high and created unrealistic expectations or a number that was so low that we easily made it.” Key Performance Indicators are numbers based on data points that you can collect to measure your progress towards reaching your SMART objectives. There are hundreds if not thousands of metrics you could collect. But since the average human can pay attention and remember at most about 7 things at a time, you have to whittle that list down to a couple of “Key Performance Indicators” or the most important metrics that you need to know that you’re on track to reach to your results. The formal term is Key Performance Indicators, but a more accurate term is “Kick Butt Index” -- in other words, if the boss comes in and says, “Damn it, we’re getting our butt kicked out there” what does that mean? And if he/she says “ congratulations, you’re really kicking butt,” what does that mean? So the fourth step in the process is to get broad agreement on what those metrics are. Typical KPIs are The important thing to remember about KPIs is that you become what you measure, so they have to be meaningful, actionable and relevant. And, in fact, if you’ve completed steps 1-3 your KPIs should fall naturally out of the earlier conversations about goals and stakeholder groups. It is just a question of translating the priorities and goals into a number you can calculate like: % increase in donations% increase in new donors or members % reduction in cost per member acquired For social media, typical KPIs are: % increase in share of desirable coverage (desirable can mean positive tone, favorable positioning, % increase in share of conversation% increase in number of supporting conversations (expressing support for the cause) % increase in conversation that contains our key messages http://www.mediapost.com/publications/?fa=Articles.showArticle&art_aid=117581
There are hundreds if not thousands of metrics you could collect. But since the average human can pay attention and remember at most about 7 things at a time, you have to whittle that list down to a couple of “Key Performance Indicators” or the most important metrics that you need to know that you’re on track to reach to your results.
Share our experience in developing our measurement project ..
http://www.webanalyticsdemystified.com/ae/index.aspWe got help from the Analytics Exchange which provides volunteers who will help your nonprofit make better use of analyticsWe got a mentor and a “student” who the work of helping us think through the design of the project
These were the project objectives …..
Describe how you came up with these .. Were these in your communications plan?
Can you describe how you came up with this? Overview ..It would be fantastic if she would share the PPT – this could be a great template for folks.
For each of the objectives, the mentor/volunteer – helped us identify a SMART Goal and KPIs for each of the objectivesDescribe the first one around awareness
We didn’t set the numbers in isolated – we did some benchmarking with peer organizations … describe
We also looked at our past data ..Talk about what you collect hereWould you be willing to share this spreadsheet?
We also talked about matching tools for the job, but I’m going to share what we come up and use in November – that’s the session on tools
work with 6-10 regional offices and programs to pick specific goals within the next six monthsa social media presence and network that educates an increasingly large group of people about our issues and viewpoints and ultimately drives more people to take action by passing on our message, acting as an advocate for the environment by responding to action requests, and donating money to NWF. To do that, we believe we need a suite of tools that, with personalized and compelling content, work together to increase traffic to our regional websites. We also need regional websites that provides visitors a fulfilling experience that allows them to support NWF in a variety of ways, including giving regionally.The fundamental premises of this plan are: 1) that social media provides an opportunity to reach people now and move them to action to protect wildlife now; 2) that social media will be a much more powerful and standard way to communicate in five years if not two years; 3) that people will increasingly make decisions to take action and to support non-profit organizations based on their social media relationships with organizations, and with friends and family who have social media relationships with organizations; and 4) that establishing a much stronger social media presence now will allow us to increase our reach and raise more money now, but is most important because it allows us to position ourselves for the future.
With blogging, there are several ways to track your “success” and follow how your posts are performing. These are some of the ways we look at, at the NWF. The most basic is Web Analytics, and while you may not be the people tracking the information, it will be useful for you to know what a well-received blog post looks like.
Show of hands: how many on FB?Twitter? Tweet what had for breakfast?Two primary vehicles: Facebook and TwitterWe also are strongly represented on: SeaNotes blog, YouTube, Flickr, Yelp—plus now tumblr and Google+. Dizzying!SFW also has a strong presence; administration delegated to that team, with input/coordination from us
Learned a few things over timeMore I learn the less I know….!
Vicarious experience; a way to connect to a national audience
Snapshot of where we’re atGrown sixtimes over since mid ’09; now over 125,000Second overall, top tier in our competitive set
Even more important: people are engaging with us, often over 1,000 times per weekThis is the real work of social media: listening and responding
Session 3: Why Does Bad Measurement Practice Happen To Good Nonprofits?September 22 at 11:00 am PST/ 2:00 ESThttp://measure-netnon.wikispaces.com/Grp+2+Session+3+Bad+Measurement