Downloaded 2,075 times


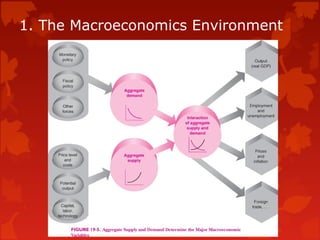

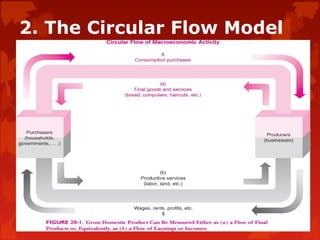
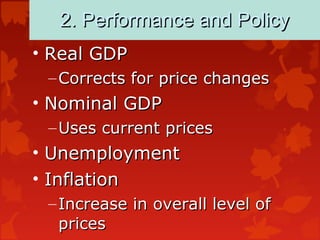


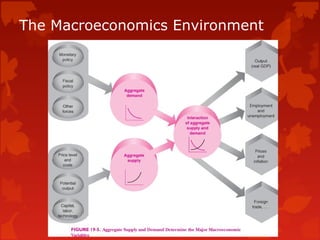
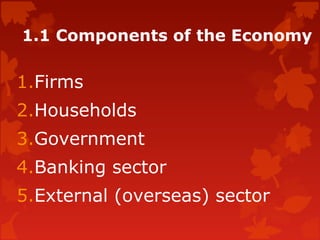
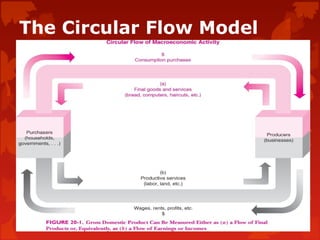
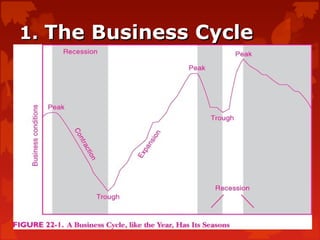
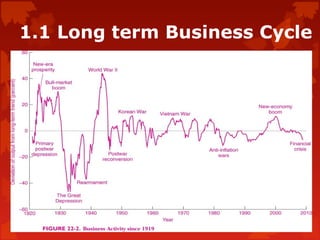
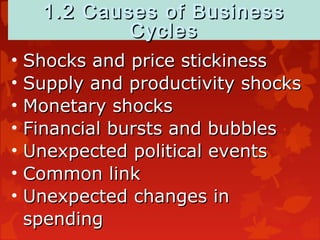


This document provides an overview of macroeconomics and the macroeconomic environment. It discusses key topics such as the components of the economy, economic growth, productivity, and macroeconomic performance measures. The circular flow model and factors that influence economic growth like savings, investment, expectations and shocks are also examined. Macroeconomic objectives and how performance is measured using indicators like GDP, unemployment and inflation are outlined.