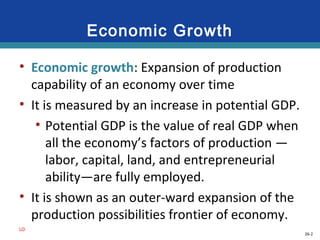
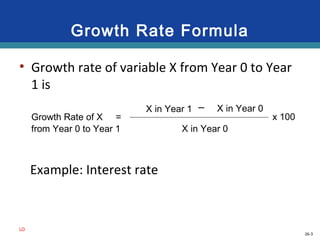
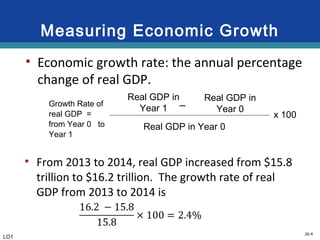
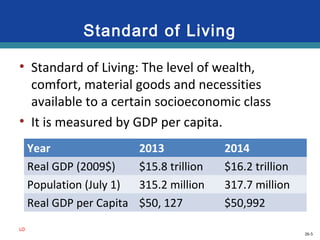
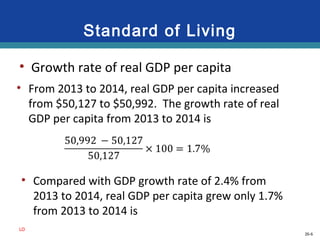
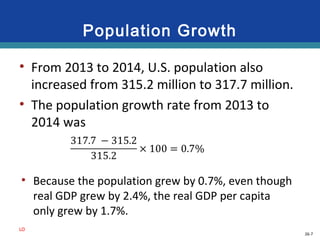
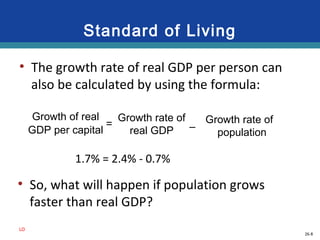
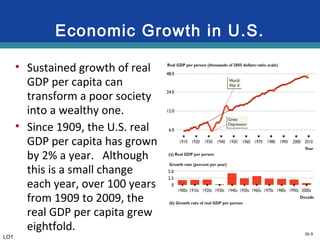
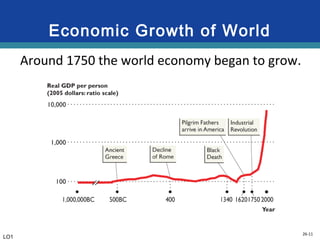
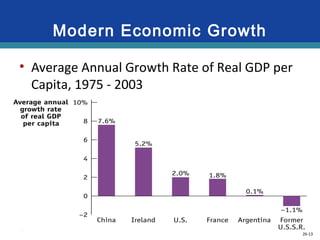
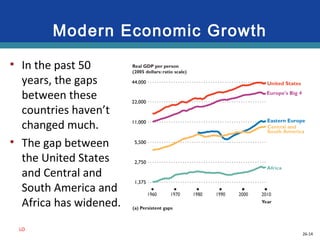
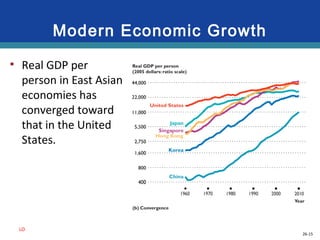
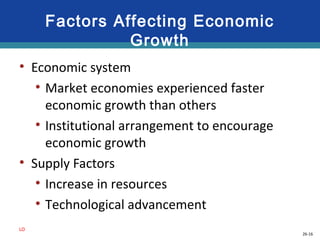
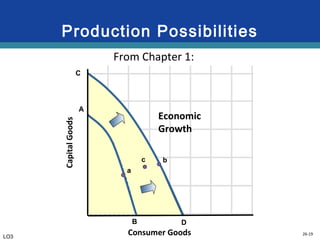
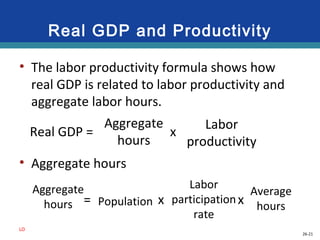
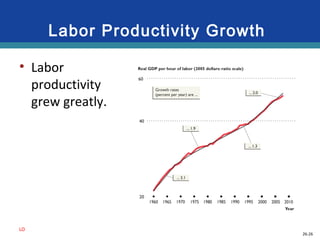
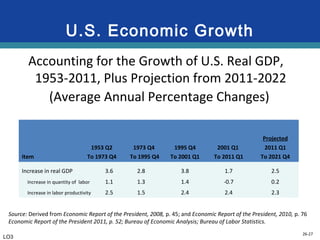
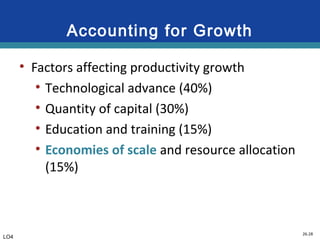
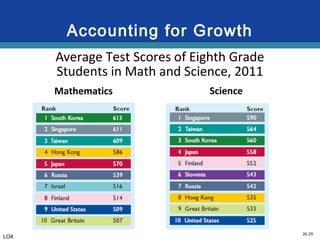
Chapter 26
Economic Growth
Copyright © 2015 McGraw-Hill Education. All rights reserved. No reproduction or distribution without the prior written consent of McGraw-Hill Education.
26-2
Economic Growth
• Economic growth: Expansion of production
capability of an economy over time
• It is measured by an increase in potential GDP.
• Potential GDP is the value of real GDP when
all the economy’s factors of production —
labor, capital, land, and entrepreneurial
ability—are fully employed.
• It is shown as an outer-ward expansion of the
production possibilities frontier of economy.
LO
26-3
Growth Rate Formula
• Growth rate of variable X from Year 0 to Year
1 is
LO
Growth Rate of X =
from Year 0 to Year 1
X in Year 1
X in Year 0
x 100
X in Year 0–
Example: Interest rate
26-4
Measuring Economic Growth
• Economic growth rate: the annual percentage
change of real GDP.
LO1
Growth Rate of
real GDP =
from Year 0 to
Year 1
Real GDP in
Year 1
Real GDP in Year 0
x 100
Real GDP in
Year 0–
• From 2013 to 2014, real GDP increased from $15.8
trillion to $16.2 trillion. The growth rate of real
GDP from 2013 to 2014 is
26-5
Standard of Living
• Standard of Living: The level of wealth,
comfort, material goods and necessities
available to a certain socioeconomic class
• It is measured by GDP per capita.
LO
Year 2013 2014
Real GDP (2009$) $15.8 trillion $16.2 trillion
Population (July 1) 315.2 million 317.7 million
Real GDP per Capita $50, 127 $50,992
26-6
Standard of Living
• Growth rate of real GDP per capita
LO
• From 2013 to 2014, real GDP per capita increased
from $50,127 to $50,992. The growth rate of real
GDP per capita from 2013 to 2014 is
• Compared with GDP growth rate of 2.4% from
2013 to 2014, real GDP per capita grew only 1.7%
from 2013 to 2014 is
26-7
Population Growth
• From 2013 to 2014, U.S. population also
increased from 315.2 million to 317.7 million.
• The population growth rate from 2013 to
2014 was
LOLO
• Because the population grew by 0.7%, even though
real GDP grew by 2.4%, the real GDP per capita
only grew by 1.7%.
26-8
Standard of Living
• The growth rate of real GDP per person can
also be calculated by using the formula:
LO
Growth of real
GDP per capital
Growth rate of
real GDP
Growth rate of
population
–=
1.7% = 2.4% - 0.7%
• So, what will happen if population grows
faster than real GDP?
26-9
Economic Growth in U.S.
• Sustained growth of real
GDP per capita can
transform a poor society
into a wealthy one.
• Since 1909, the U.S. real
GDP per capita has grown
by 2% a year. Although
this is a small change
each year, over 100 years
from 1909 to 2009, the
real GDP per capita grew
eightfold.
LO1
26-10
Economic Growth
• In addition to real GDP per capita growth,
the U.S. households benefited from
• Improved products and services
• Added leisure (less work time)
• Other impacts (Environment, Social
justice)
LO1
26-11
Economic Growth of World
Around 1750 the world economy began to grow.
LO1
26-12
Modern Economic Growth
• Economic growth is not even among nations.
• Some countries started earlier
• Leader countries invent technology
• U.K. in 18-19th
centuries, U.S. in 20th
century
• Other countries catch up
• Follower countries adopt technology
• Japan in 1950-90, Korea in 1960-2000, China
in 1980-current
• But, not all countries grew fast enough
LO2
26-13
Modern Economic Growth
• Average Annual Growth Rate of Real GDP per
Capita, 1975 - 2003
LO
26-14
Modern Economic Growth
• In the past 50
years, the gaps
between these
countries haven’t
changed much.
• The gap between
the United States
and Central and
South America and
Africa has widened.
LO
26-15
Modern Economic Growth
• Real GDP per
person in East Asian
economies has
converged toward
that in the United
States.
LO
26-16
Factors Affecting Economic
Growth
• Economic system
• Market economies experienced faster
economic growth than others
• Institutional arrangement to encourage
economic growth
• Supply Factors
• Increase in resources
• Technological advancement
LO
26-17
Institutional Structures of Growth
• Strong property rights
• Patents and copyrights
• Efficient financial institutions
• Literacy and widespread education
• Free trade
• Competitive market system
LO2
26-18
Determinants of Growth
• Supply factors
• Production of capital goods leads to
economic growth
• Investment in technology leads to higher
productivity of resources
LO3
26-19
a
Economic
Growth
b
D
LO3
B
A
C
Consumer Goods
CapitalGoods
c
From Chapter 1:
Production Possibilities
26-20
Labor Productivity
• Labor productivity is the quantity of real GDP
produced by one hour of labor.
• Aggregate hours is total number of hours that
all labor in economy worked in a year.
LO
Aggregate hours
Labor productivity =
Real GDP
26-21
Real GDP and Productivity
• The labor productivity formula shows how
real GDP is related to labor productivity and
aggregate labor hours.
• Aggregate hours
LO
Real GDP = x
Aggregate
hours
Labor
productivity
= x x
Aggregate
hours
Labor
participation
rate
Population
Average
hours
26-22
Labor, Productivity, and GDP
hours of work x labor productivity = Real GDP
LO3
26-23
Aggregate Hours in the U.S.
• Between 1967
and 2007,
aggregate
hours increased
by 75%.
• U.S. Population
grew,
LO
26-24
Average Weekly Hours in the
U.S.
• Average
weekly hours
decreased,
LO
26-25
Labor Participation Rate
• The average
labor force
participation
rate
increased,
LO
26-26
Labor Productivity Growth
• Labor
productivity
grew greatly.
LO
26-27
U.S. Economic Growth
Item
1953 Q2
To 1973 Q4
1973 Q4
To 1995 Q4
1995 Q4
To 2001 Q1
2001 Q1
To 2011 Q1
Projected
2011 Q1
To 2021 Q4
Increase in real GDP 3.6 2.8 3.8 1.7 2.5
Increase in quantity of labor 1.1 1.3 1.4 -0.7 0.2
Increase in labor productivity 2.5 1.5 2.4 2.4 2.3
Accounting for the Growth of U.S. Real GDP,
1953-2011, Plus Projection from 2011-2022
(Average Annual Percentage Changes)
Source: Derived from Economic Report of the President, 2008, p. 45; and Economic Report of the President, 2010, p. 76
Economic Report of the President 2011, p. 52; Bureau of Economic Analysis; Bureau of Labor Statistics.
LO3
26-28
Accounting for Growth
• Factors affecting productivity growth
• Technological advance (40%)
• Quantity of capital (30%)
• Education and training (15%)
• Economies of scale and resource allocation
(15%)
LO4
26-29
Accounting for Growth
Average Test Scores of Eighth Grade
Students in Math and Science, 2011
Mathematics Science
LO4
26-30
Productivity Growth
LO5
26-31
Productivity Growth
• Average rate of growth
• 1.5% per year 1973-1995
• 2.4% per year 1995-2012
• Information technology revolution
• Start-up firms
• Economies of scale through network effects
• Global competition & Trade (outsourcing)
LO5
26-32
Global Perspective
LO6
26-33
Economic Growth
• Is economic growth desirable and
sustainable?
• The antigrowth view
• Environmental and resource issues
• In defense of economic growth
• Higher standard of living
• Human imagination can solve
environmental and resource issues
LO6
26-34
Can Economic Growth Survive
Population Decline?
• As nations industrialize, their economies shift
from agriculture to industry
• Fertility rates fall
• Decrease in population
• Each generation smaller than the one
before
• Inverse dependency ratio
• Social security issues
• Innovation and productivity

Econ789 chapter026

  • 1.
    Chapter 26 Economic Growth Copyright© 2015 McGraw-Hill Education. All rights reserved. No reproduction or distribution without the prior written consent of McGraw-Hill Education.
  • 2.
    26-2 Economic Growth • Economicgrowth: Expansion of production capability of an economy over time • It is measured by an increase in potential GDP. • Potential GDP is the value of real GDP when all the economy’s factors of production — labor, capital, land, and entrepreneurial ability—are fully employed. • It is shown as an outer-ward expansion of the production possibilities frontier of economy. LO
  • 3.
    26-3 Growth Rate Formula •Growth rate of variable X from Year 0 to Year 1 is LO Growth Rate of X = from Year 0 to Year 1 X in Year 1 X in Year 0 x 100 X in Year 0– Example: Interest rate
  • 4.
    26-4 Measuring Economic Growth •Economic growth rate: the annual percentage change of real GDP. LO1 Growth Rate of real GDP = from Year 0 to Year 1 Real GDP in Year 1 Real GDP in Year 0 x 100 Real GDP in Year 0– • From 2013 to 2014, real GDP increased from $15.8 trillion to $16.2 trillion. The growth rate of real GDP from 2013 to 2014 is
  • 5.
    26-5 Standard of Living •Standard of Living: The level of wealth, comfort, material goods and necessities available to a certain socioeconomic class • It is measured by GDP per capita. LO Year 2013 2014 Real GDP (2009$) $15.8 trillion $16.2 trillion Population (July 1) 315.2 million 317.7 million Real GDP per Capita $50, 127 $50,992
  • 6.
    26-6 Standard of Living •Growth rate of real GDP per capita LO • From 2013 to 2014, real GDP per capita increased from $50,127 to $50,992. The growth rate of real GDP per capita from 2013 to 2014 is • Compared with GDP growth rate of 2.4% from 2013 to 2014, real GDP per capita grew only 1.7% from 2013 to 2014 is
  • 7.
    26-7 Population Growth • From2013 to 2014, U.S. population also increased from 315.2 million to 317.7 million. • The population growth rate from 2013 to 2014 was LOLO • Because the population grew by 0.7%, even though real GDP grew by 2.4%, the real GDP per capita only grew by 1.7%.
  • 8.
    26-8 Standard of Living •The growth rate of real GDP per person can also be calculated by using the formula: LO Growth of real GDP per capital Growth rate of real GDP Growth rate of population –= 1.7% = 2.4% - 0.7% • So, what will happen if population grows faster than real GDP?
  • 9.
    26-9 Economic Growth inU.S. • Sustained growth of real GDP per capita can transform a poor society into a wealthy one. • Since 1909, the U.S. real GDP per capita has grown by 2% a year. Although this is a small change each year, over 100 years from 1909 to 2009, the real GDP per capita grew eightfold. LO1
  • 10.
    26-10 Economic Growth • Inaddition to real GDP per capita growth, the U.S. households benefited from • Improved products and services • Added leisure (less work time) • Other impacts (Environment, Social justice) LO1
  • 11.
    26-11 Economic Growth ofWorld Around 1750 the world economy began to grow. LO1
  • 12.
    26-12 Modern Economic Growth •Economic growth is not even among nations. • Some countries started earlier • Leader countries invent technology • U.K. in 18-19th centuries, U.S. in 20th century • Other countries catch up • Follower countries adopt technology • Japan in 1950-90, Korea in 1960-2000, China in 1980-current • But, not all countries grew fast enough LO2
  • 13.
    26-13 Modern Economic Growth •Average Annual Growth Rate of Real GDP per Capita, 1975 - 2003 LO
  • 14.
    26-14 Modern Economic Growth •In the past 50 years, the gaps between these countries haven’t changed much. • The gap between the United States and Central and South America and Africa has widened. LO
  • 15.
    26-15 Modern Economic Growth •Real GDP per person in East Asian economies has converged toward that in the United States. LO
  • 16.
    26-16 Factors Affecting Economic Growth •Economic system • Market economies experienced faster economic growth than others • Institutional arrangement to encourage economic growth • Supply Factors • Increase in resources • Technological advancement LO
  • 17.
    26-17 Institutional Structures ofGrowth • Strong property rights • Patents and copyrights • Efficient financial institutions • Literacy and widespread education • Free trade • Competitive market system LO2
  • 18.
    26-18 Determinants of Growth •Supply factors • Production of capital goods leads to economic growth • Investment in technology leads to higher productivity of resources LO3
  • 19.
  • 20.
    26-20 Labor Productivity • Laborproductivity is the quantity of real GDP produced by one hour of labor. • Aggregate hours is total number of hours that all labor in economy worked in a year. LO Aggregate hours Labor productivity = Real GDP
  • 21.
    26-21 Real GDP andProductivity • The labor productivity formula shows how real GDP is related to labor productivity and aggregate labor hours. • Aggregate hours LO Real GDP = x Aggregate hours Labor productivity = x x Aggregate hours Labor participation rate Population Average hours
  • 22.
    26-22 Labor, Productivity, andGDP hours of work x labor productivity = Real GDP LO3
  • 23.
    26-23 Aggregate Hours inthe U.S. • Between 1967 and 2007, aggregate hours increased by 75%. • U.S. Population grew, LO
  • 24.
    26-24 Average Weekly Hoursin the U.S. • Average weekly hours decreased, LO
  • 25.
    26-25 Labor Participation Rate •The average labor force participation rate increased, LO
  • 26.
    26-26 Labor Productivity Growth •Labor productivity grew greatly. LO
  • 27.
    26-27 U.S. Economic Growth Item 1953Q2 To 1973 Q4 1973 Q4 To 1995 Q4 1995 Q4 To 2001 Q1 2001 Q1 To 2011 Q1 Projected 2011 Q1 To 2021 Q4 Increase in real GDP 3.6 2.8 3.8 1.7 2.5 Increase in quantity of labor 1.1 1.3 1.4 -0.7 0.2 Increase in labor productivity 2.5 1.5 2.4 2.4 2.3 Accounting for the Growth of U.S. Real GDP, 1953-2011, Plus Projection from 2011-2022 (Average Annual Percentage Changes) Source: Derived from Economic Report of the President, 2008, p. 45; and Economic Report of the President, 2010, p. 76 Economic Report of the President 2011, p. 52; Bureau of Economic Analysis; Bureau of Labor Statistics. LO3
  • 28.
    26-28 Accounting for Growth •Factors affecting productivity growth • Technological advance (40%) • Quantity of capital (30%) • Education and training (15%) • Economies of scale and resource allocation (15%) LO4
  • 29.
    26-29 Accounting for Growth AverageTest Scores of Eighth Grade Students in Math and Science, 2011 Mathematics Science LO4
  • 30.
  • 31.
    26-31 Productivity Growth • Averagerate of growth • 1.5% per year 1973-1995 • 2.4% per year 1995-2012 • Information technology revolution • Start-up firms • Economies of scale through network effects • Global competition & Trade (outsourcing) LO5
  • 32.
  • 33.
    26-33 Economic Growth • Iseconomic growth desirable and sustainable? • The antigrowth view • Environmental and resource issues • In defense of economic growth • Higher standard of living • Human imagination can solve environmental and resource issues LO6
  • 34.
    26-34 Can Economic GrowthSurvive Population Decline? • As nations industrialize, their economies shift from agriculture to industry • Fertility rates fall • Decrease in population • Each generation smaller than the one before • Inverse dependency ratio • Social security issues • Innovation and productivity

Editor's Notes

  • #2 We begin by defining ways that economic growth can be measured and the reasons that economic growth is desirable. Then we look at differences in economic growth across countries and examine the factors that have led to such varied growth. Standards of living can be quite different, but we will find that a country is not always destined to have high or low standards of living. Using a production possibilities curve, we look at the demand, supply, and efficiency factors that contribute to economic growth. Lastly we will look at variables that have led to productivity growth and discuss whether not economic growth is sustainable.
  • #5 Economists define and measure economic growth two different ways. The first is as an increase in real GDP over some time period and the second is as an increase in real GDP per capita over some time period. It typically is measured as a percentage rate of growth either on a quarterly or yearly basis. During periods of recession, the growth rate will be negative instead of positive. Whether the first or second measure of determining growth is used depends on the circumstances. Looking at GDP per capita allows one to compare countries of different sizes. For country-to-country comparisons, real GDP is more useful. Generally speaking, growth in GDP is considered an economic goal. The expansion of total output relative to population results in higher standards of living. It lessens the burden of scarcity.
  • #10 While both real GDP and real GDP per capita have increased over the past 60 years, this must be qualified in several ways. Because the numbers do not fully account for improvements in products and services, they tend to understate the growth of economic well-being. They also do not take into account that growth has occurred at the same time as there has been an increase in the amount of leisure time, so economic well-being is even further understated. The numbers fail to account for any environmental or quality of life impacts as well.
  • #11 While both real GDP and real GDP per capita have increased over the past 60 years, this must be qualified in several ways. Because the numbers do not fully account for improvements in products and services, they tend to understate the growth of economic well-being. They also do not take into account that growth has occurred at the same time as there has been an increase in the amount of leisure time, so economic well-being is even further understated. The numbers fail to account for any environmental or quality of life impacts as well.
  • #12 This table presents the growth in real GDP and real GDP per capita in the United States since 1950. Due to the population increase, real GDP per capita has increased at a slower pace than real GDP. Since the population has doubled, the rate of increase in real GDP per capita has been about half that of real GDP.
  • #13 Modern economic growth has been slow to spread from its British birthplace. While much of the Western world began to experience growth in the early 1800s, most of Asia did not experience it until the early 1900s. It has only been in the last few decades that nations in Africa have begun to see modern economic growth. These discrepancies in the growth rates have led to a great difference between the wealth of nations who have experienced modern economic growth and those that have not. While it is possible for those poorer nations to catch up, they typically must rely upon the help of the wealthier nations. The follower countries must copy the technological advances pioneered in the leader nations.
  • #18 There are several institutional structures that promote and sustain modern economic growth. Strong property rights are absolutely essential as people will not invest if they believe their investments are not safe from theft or an unscrupulous government. Patent and copyright laws are also necessary if a society wants a constant flow of innovative new technologies and sophisticated new ideas. Efficient financial institutions, literacy and education, free trade, and a competitive market system are other key factors in ensuring a nation’s ability to sustain growth.
  • #19 Four of the determinants of growth relate to the physical ability of the economy to expand. Any increases or improvements in these supply factors will increase the potential size of an economy’s GDP.
  • #20 Economic growth is made possible by the four supply factors that shift the production possibilities curve outward, as from AB to CD. Economic growth is realized when the demand factor and the efficiency factor move the economy from points such as a and c that are inside CD to the optimal output point, which is assumed to be point b in this figure. Point c represents situations in which real output falls below what it should have been if the economy was operating at full employment. This situation occurred during the severe recession of 2007-2009.
  • #23 Society can increase its real output and income in one of two ways: (1) by increasing its inputs of resources and (2) by raising the productivity of those inputs. By focusing on the labor input, we can build a framework for discussing the role of supply factors in growth. In this illustration, a nation’s economic growth from one year to the next depends on its increase in labor inputs and its increase in labor productivity.
  • #28 By looking at these numbers, it is clear that both increases in the quantity of labor and increases in labor productivity are important sources of economic growth. Between 1953 and 2012, the labor force increased from 63 million to 155 million workers. Productivity growth has usually been the more significant factor.
  • #29 There are five factors that, when combined, appear to explain changes in productivity growth rates. The largest contributor is technological advance which accounts for approximately 40% of productivity growth. It is generated by the discovery of new knowledge. The quantity of capital explains roughly 30% of productivity growth. More and better plant and equipment make workers more productive. Education and training, economies of scale, and resource allocation account for the remaining productivity growth. Investment in human capital is an important means of increasing labor productivity. By 2012, 88% of the U.S. population had at least a high school education and 31% had a college or post-secondary education, both representing substantial increases over the past several decades. Economies of scale are the reductions in per-unit production costs that result from increases in output levels. Improved resource allocation means workers over time have moved from low-productivity employment to high-productivity employment. The long-run movement toward liberalized international trade through international agreements has improved the allocation of resources, increased labor productivity, and expanded real output, both here and abroad.
  • #30 The test performance of U.S. eighth-grade students did not compare favorably with that of eighth-graders in several other nations in the Fourth International Math and Science Study from 2011. In mathematics, the United States came in 9th and in Science, 10th.
  • #31 This graph reflects the growth in U.S. productivity between 1973 and 2012. Average productivity was 1.5% until 1995, but after 1995 the average productivity growth rate increased to 2.4%.
  • #32 As measured by changes in the index of labor productivity, the growth rate doubled in the period of 1995-2012 as compared to the period of 1973-1995. Economists relate the increase to the significant wave of new technology coupled with global competition. The increase in productivity growth is important as real output, real income, and real wages are all linked to it. It is the main route for improving the standards of living for a nation’s workers. So what are some of the reasons for the increased productivity growth? A core element was the explosion of entrepreneurship and innovation based on the development of the microchip. Microchips have found their way into thousands of products and changed the way business is conducted. Hundreds of new start-up firms aided in the advancement of the new information technology. These new firms took advantage of increasing returns and economies of scale as they helped to increase labor productivity. Global competition fueled by the collapse of the socialist economies was another key factor in the increasing rate of labor productivity growth.
  • #33 The Global Perspective lists the top 10 countries based on the global competitiveness index. The index uses factors like innovativeness, the capability to transfer technology among sectors, efficiency of the financial system, rates of investment, and the degree of integration with the rest of the world.
  • #34 While most economists usually agree that economic growth is both desirable and sustainable, not everyone agrees. Critics say industrialization and growth come with pollution, climate changes, ozone depletion, and other environmental problems. They also argue that there is little compelling evidence that economic growth has solved sociological problems such as poverty, homelessness, and discrimination. While growth has led to higher standards of living, it does not necessarily translate to a better life. There is also concern about whether the growth is sustainable. The earth only has a limited number of resources which are being consumed at alarming rates.
  • #35 As nations shift from agriculture to industry, fertility levels plummet and birthrates are falling dramatically. So, the labor force is shrinking while the population swells; resulting in each generation being smaller than the one before. This trend is known as the inverse dependency ratio. If productivity does not keep up with fall of this ratio, some economists believe that living standards will have to decline. The place where this problem will show up first if Social Security. There may also be less innovation and slower productivity growth. Other economists are more hopeful, and believe that productivity growth and living standards could keep on rising at the rates we have come to expect.