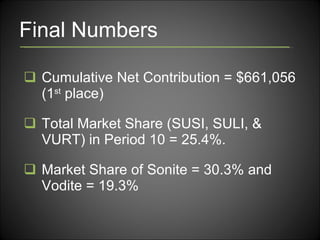
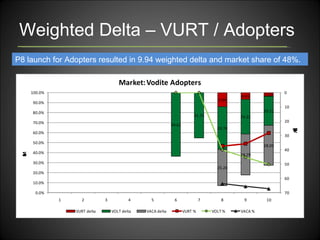
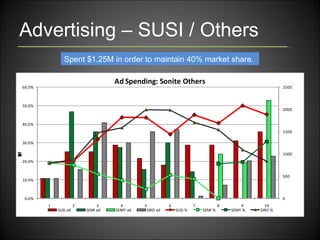
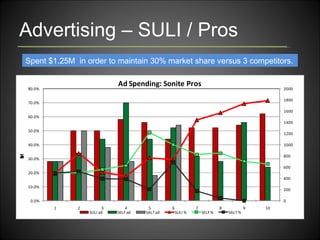
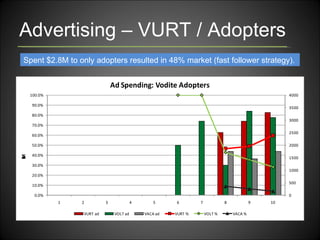
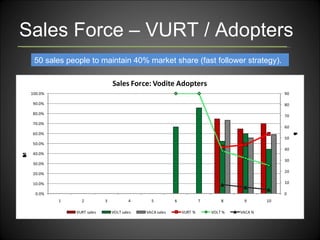
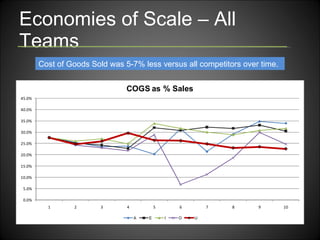
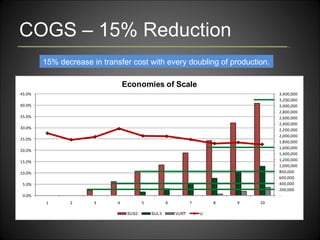
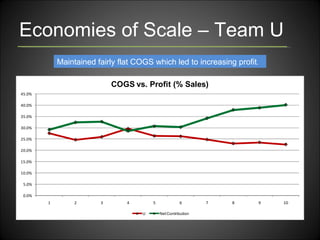
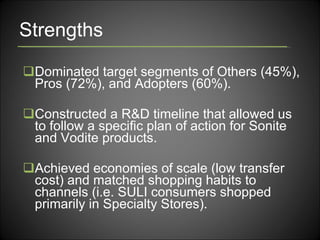
MARKSTRAT Industry 1 Team U Erica Kreer Jeremy Fletcher Joseph Avila Francis Marantal
Final Numbers Cumulative Net Contribution = $661,056 (1 st  place) Total Market Share (SUSI, SULI, & VURT) in Period 10 = 25.4%. Market Share of Sonite = 30.3% and Vodite = 19.3%
Table of Contents Overview Goals Target Segments R&D Timelines Analysis Weighted Delta’s Advertising Sales Force Conclusion SWOT Marketing Objectives Takeaways
Goals Focus on two (Others and Pros) and possibly three (Vodite) target segments plus maintain at least 40% market share. Meet ideal characteristics of target segments as defined by overall weighted deltas. Leverage production economies of scale and optimize Advertising / Sales Force spending.
Target Markets Others: largest Sonite in P1 with a 5-period growth rate at 135%. Pros: high margin Sonite and P1 weighted delta of 6.94 requiring less R&D for modification. Hi-Earners: unsuccessful, reactionary move resulted in 1.6% market share (discontinued product). Adopters: high margin Vodite exploited by fast follower strategy (R&D spread over P6-8).
R&D Timelines
Weighted Delta – SUSI / Others P3 modification resulted in a 6.97 weighted delta and market share of 43%.
Weighted Delta – SULI / Pros P2 & P5 modification resulted in a 2.55 weighted delta and market share of 30%.
Weighted Delta – VURT / Adopters P8 launch for Adopters resulted in 9.94 weighted delta and market share of 48%.
Advertising – SUSI / Others Spent $1.25M in order to maintain 40% market share .
Advertising – SULI / Pros Spent $1.25M  in order to maintain 30% market share versus 3 competitors.
Advertising – VURT / Adopters Spent $2.8M to only adopters resulted in 48% market (fast follower strategy).
Optimal Sales Force Size – Sonite
Sales Force – SUSI / Others 40 sales people to maintain 40% market share.
Sales Force – SULI / Pros 50 sales people to maintain 50% market share.
Optimal Sales Force Size – Vodite
Sales Force – VURT / Adopters 50 sales people to maintain 40% market share (fast follower strategy).
Economies of Scale – All Teams Cost of Goods Sold was 5-7% less versus all competitors over time.
COGS – 15% Reduction  15% decrease in transfer cost with every doubling of production.
Economies of Scale – Team U Maintained fairly flat COGS which led to increasing profit .
Strengths Dominated target segments of Others (45%), Pros (72%), and Adopters (60%). Constructed a R&D timeline that allowed us to follow a specific plan of action for Sonite and Vodite products.  Achieved economies of scale (low transfer cost) and matched shopping habits to channels (i.e. SULI consumers shopped primarily in Specialty Stores).
Weaknesses Consistent under production limited sales and profit. Manufacturing of SURF led to 1.6% of total market (Advertising and Sales Force resources spread too thin). Confusion on Sales Force spending until Period 8.
Opportunities Forecasted growth of Singles (33%) and Followers (95%) in the next 5 periods. Modification of SUSI, SULI, and VURT to maintain single digit weighted delta. Increase budget for Advertising and Sales Force spending.
Threats Team O’s Advertising Spend of $11,250 and Sale Force Size of 110 in Vodite market. Team E’s Advertising Spend of $9,300 and Sale Force Size of 180 in Sonite market. Trade off of modifications to current products in exchange for economies of scale.
Marketing Objectives Purchase Team A (Market Cap of $543M) for $600M because of SAKI / Hi Earners and VACA / Followers products Allocate 20% of budget over the next 3 periods of SUSI, SULI, and VURT feasibility studies and modification to meet needs as ideal values shift. Match 2 nd  highest competitor Advertising and Sale Force spend for each target segment.
Takeaways Joey: utilization of weighted deltas Francis: prioritization of spending Jeremy: product quality vs. marketing Erica: unpredictability of competitors

Team Project #1

  • 1.
    MARKSTRAT Industry 1Team U Erica Kreer Jeremy Fletcher Joseph Avila Francis Marantal
  • 2.
    Final Numbers CumulativeNet Contribution = $661,056 (1 st place) Total Market Share (SUSI, SULI, & VURT) in Period 10 = 25.4%. Market Share of Sonite = 30.3% and Vodite = 19.3%
  • 3.
    Table of ContentsOverview Goals Target Segments R&D Timelines Analysis Weighted Delta’s Advertising Sales Force Conclusion SWOT Marketing Objectives Takeaways
  • 4.
    Goals Focus ontwo (Others and Pros) and possibly three (Vodite) target segments plus maintain at least 40% market share. Meet ideal characteristics of target segments as defined by overall weighted deltas. Leverage production economies of scale and optimize Advertising / Sales Force spending.
  • 5.
    Target Markets Others:largest Sonite in P1 with a 5-period growth rate at 135%. Pros: high margin Sonite and P1 weighted delta of 6.94 requiring less R&D for modification. Hi-Earners: unsuccessful, reactionary move resulted in 1.6% market share (discontinued product). Adopters: high margin Vodite exploited by fast follower strategy (R&D spread over P6-8).
  • 6.
  • 7.
    Weighted Delta –SUSI / Others P3 modification resulted in a 6.97 weighted delta and market share of 43%.
  • 8.
    Weighted Delta –SULI / Pros P2 & P5 modification resulted in a 2.55 weighted delta and market share of 30%.
  • 9.
    Weighted Delta –VURT / Adopters P8 launch for Adopters resulted in 9.94 weighted delta and market share of 48%.
  • 10.
    Advertising – SUSI/ Others Spent $1.25M in order to maintain 40% market share .
  • 11.
    Advertising – SULI/ Pros Spent $1.25M in order to maintain 30% market share versus 3 competitors.
  • 12.
    Advertising – VURT/ Adopters Spent $2.8M to only adopters resulted in 48% market (fast follower strategy).
  • 13.
    Optimal Sales ForceSize – Sonite
  • 14.
    Sales Force –SUSI / Others 40 sales people to maintain 40% market share.
  • 15.
    Sales Force –SULI / Pros 50 sales people to maintain 50% market share.
  • 16.
    Optimal Sales ForceSize – Vodite
  • 17.
    Sales Force –VURT / Adopters 50 sales people to maintain 40% market share (fast follower strategy).
  • 18.
    Economies of Scale– All Teams Cost of Goods Sold was 5-7% less versus all competitors over time.
  • 19.
    COGS – 15%Reduction 15% decrease in transfer cost with every doubling of production.
  • 20.
    Economies of Scale– Team U Maintained fairly flat COGS which led to increasing profit .
  • 21.
    Strengths Dominated targetsegments of Others (45%), Pros (72%), and Adopters (60%). Constructed a R&D timeline that allowed us to follow a specific plan of action for Sonite and Vodite products. Achieved economies of scale (low transfer cost) and matched shopping habits to channels (i.e. SULI consumers shopped primarily in Specialty Stores).
  • 22.
    Weaknesses Consistent underproduction limited sales and profit. Manufacturing of SURF led to 1.6% of total market (Advertising and Sales Force resources spread too thin). Confusion on Sales Force spending until Period 8.
  • 23.
    Opportunities Forecasted growthof Singles (33%) and Followers (95%) in the next 5 periods. Modification of SUSI, SULI, and VURT to maintain single digit weighted delta. Increase budget for Advertising and Sales Force spending.
  • 24.
    Threats Team O’sAdvertising Spend of $11,250 and Sale Force Size of 110 in Vodite market. Team E’s Advertising Spend of $9,300 and Sale Force Size of 180 in Sonite market. Trade off of modifications to current products in exchange for economies of scale.
  • 25.
    Marketing Objectives PurchaseTeam A (Market Cap of $543M) for $600M because of SAKI / Hi Earners and VACA / Followers products Allocate 20% of budget over the next 3 periods of SUSI, SULI, and VURT feasibility studies and modification to meet needs as ideal values shift. Match 2 nd highest competitor Advertising and Sale Force spend for each target segment.
  • 26.
    Takeaways Joey: utilizationof weighted deltas Francis: prioritization of spending Jeremy: product quality vs. marketing Erica: unpredictability of competitors

Editor's Notes