1. A single map can be analyzed using summary statistics, measurements of feature aspects, and buffers.
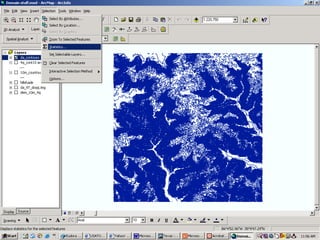
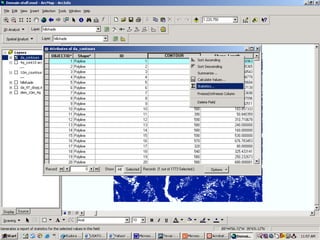
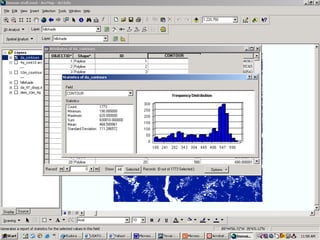
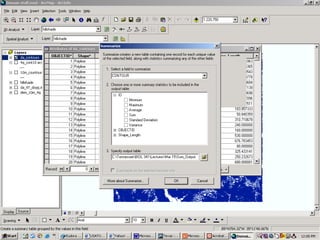
2. There are several ways to calculate summary statistics in ArcGIS including selection statistics, attribute table statistics, and summarization.
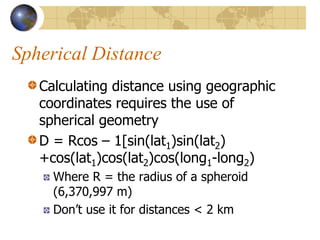
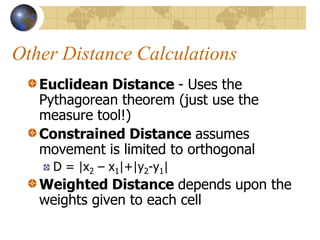
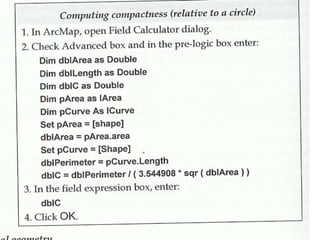
3. Measurements that can be made on geographic features include number, area, length, shape, fragmentation, and distance calculations.
![Zonal Geometry
Zonal Geometry can be calculated for
rasters using the raster calculator
ZonalGeometery (<GRID>, [Geometry-
Type], {MaxThickness})
Calculates an aspect of the geometry of
zones, based on the GeometryType
keyword: AREA, PERIMETER,
THICKNESS, ELLIPSE, and ALL
See pg. 251 of Theobald](https://image.slidesharecdn.com/mar8singlemapanalysis-130218000315-phpapp02/85/Mar-8-single_map_analysis_1-13-320.jpg)