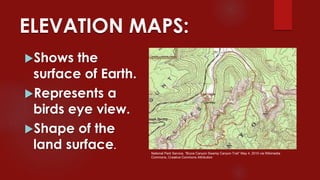
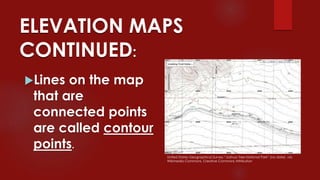
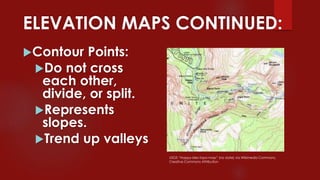
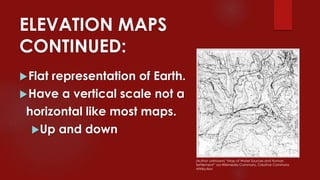
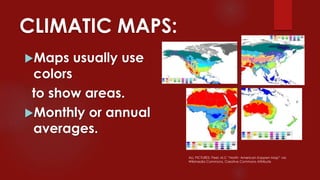
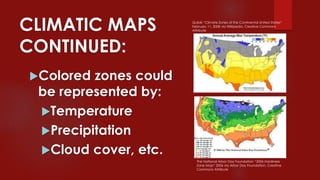
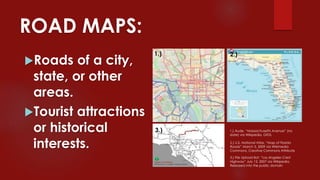
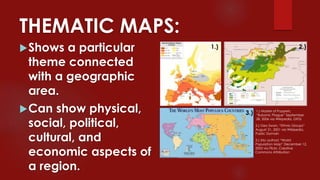
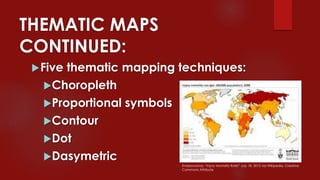
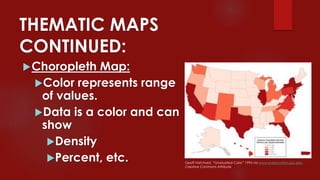
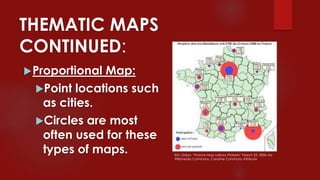
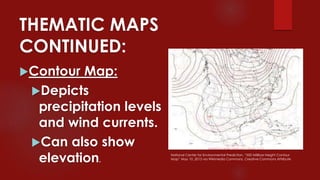
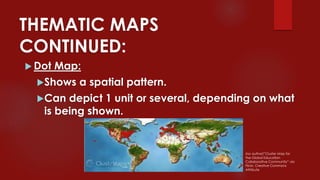
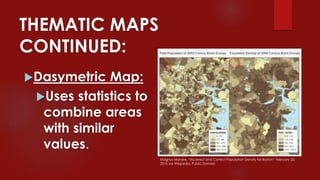
MAPS
:BASICS OF GEOGRAPHY:
4th Grade Social Studies
ELEVATION MAPS:
Shows the
surface of Earth.
Represents a
birds eye view.
Shape of the
land surface.
National Park Service, “Bryce Canyon Swamp Canyon Trail” May 4, 2010 via Wikimedia
Commons, Creative Commons Attribution
ELEVATION MAPS
CONTINUED:
Lines on the map
that are
connected points
are called contour
points.
United States Geographical Survey “Joshua Tree National Park” (no date) via
Wikimedia Commons, Creative Commons Attribution
ELEVATION MAPS CONTINUED:
Contour Points:
Do not cross
each other,
divide, or split.
Represents
slopes.
Trend up valleys
USGS “Happy-Isles-topo-map” (no date) via Wikimedia Commons,
Creative Commons Attribution
ELEVATION MAPS
CONTINUED:
Flat representation of Earth.
Have a vertical scale not a
horizontal like most maps.
Up and down
(Author unknown) “Map of Water Sources and Human
Settlement” via Wikimedia Commons, Creative Commons
Attribution
CLIMATIC MAPS:
Maps usually use
colors
to show areas.
Monthly or annual
averages.
ALL PICTURES: Peel, M.C “North- American Koppen Map” via
Wikimedia Commons, Creative Commons Attribute
CLIMATIC MAPS
CONTINUED:
Colored zones could
be represented by:
Temperature
Precipitation
Cloud cover, etc.
The National Arbor Day Foundation “2006 Hardiness
Zone Map” 2006 via Arbor Day Foundation, Creative
Commons Attribute
Quibik “Climate Zones of the Continental United States“
February 11, 2008 via Wikipedia, Creative Commons
Attribute
ROAD MAPS:
Roads of a city,
state, or other
areas.
Tourist attractions
or historical
interests. 2.) U.S. National Atlas, “Map of Florida
Roads” March 5, 2009 via Wikimedia
Commons, Creative Commons Attribute
1.) Aude, “Massachusetts Avenue” (no
date) via Wikipedia, GFDL
3.) File Upload Bot, “Los Angeles Crest
Highway“ July 12, 2007 via Wikipedia,
Released into the public domain
1.) 2.)
3.)
ROAD MAPS CONTINUED:
Most widely
used and known
map.
Used for
motorists, etc.
MasterSon,“IllinoisStateHighway”
January25,2009viaWikipedia,
CreativeCommonsAttribute
Stratosphere,“WackerDrive”
January26,2008viaWikimedia
Commons,CreativeCommons
Attribution
THEMATIC MAPS:
Shows a particular
theme connected
with a geographic
area.
Can show physical,
social, political,
cultural, and
economic aspects of
a region.
1.) Master of Puppets,
“Bubonic Plague” September
28, 2006 via Wikipedia, GFDL
1.) 2.)
3.)
2.) Geo Swan, “Ethnic Groups”
August 31, 2001 via Wikipedia,
Public Domain
3.) (No author) “World
Population Map” December 12,
2005 via Flickr, Creative
Commons Attribution
THEMATIC MAPS
CONTINUED:
Five thematic mapping techniques:
Choropleth
Proportional symbols
Contour
Dot
Dasymetric
Endeavormd, “Injury Mortality Rate” July 18, 2012 via Wikipedia, Creative
Commons Attribute
THEMATIC MAPS
CONTINUED:
Choropleth Map:
Color represents range
of values.
Data is a color and can
show
Density
Percent, etc. Geoff Hatchard, “Graduated Color” 1995 via www.e-education.psu.edu,
Creative Commons Attribute
THEMATIC MAPS
CONTINUED:
Proportional Map:
Point locations such
as cities.
Circles are most
often used for these
types of maps. Eric Gaba, “France Map Labour Protests” March 23, 2006 via
Wikimedia Commons, Creative Commons Attribute
THEMATIC MAPS
CONTINUED:
Contour Map:
Depicts
precipitation levels
and wind currents.
Can also show
elevation.
National Center for Environmental Prediction, “500 Millibar Height Contour
Map” May 10, 2013 via Wikimedia Commons, Creative Commons Attribute
THEMATIC MAPS
CONTINUED:
 Dot Map:
Shows a spatial pattern.
Can depict 1 unit or several, depending on what
is being shown.
(no author)”Cluster Map for
the Global Education
Collaborative Community” via
Flickr, Creative Commons
Attribute
THEMATIC MAPS
CONTINUED:
Dasymetric Map:
Uses statistics to
combine areas
with similar
values.
Magnus Manske, “Incorrect and Correct Population Density for Boston” February 26,
2010 via Wikipedia, Public Domain
Sources & Citations:
 Imnh.isu.edu/digitalatlas/geog/basics/topos.htm
 www.britannica.com
 http:geography.about.com/od/understandmaps/a/thematicmap.htm

Maps

  • 1.
    MAPS :BASICS OF GEOGRAPHY: 4thGrade Social Studies
  • 2.
    ELEVATION MAPS: Shows the surfaceof Earth. Represents a birds eye view. Shape of the land surface. National Park Service, “Bryce Canyon Swamp Canyon Trail” May 4, 2010 via Wikimedia Commons, Creative Commons Attribution
  • 3.
    ELEVATION MAPS CONTINUED: Lines onthe map that are connected points are called contour points. United States Geographical Survey “Joshua Tree National Park” (no date) via Wikimedia Commons, Creative Commons Attribution
  • 4.
    ELEVATION MAPS CONTINUED: ContourPoints: Do not cross each other, divide, or split. Represents slopes. Trend up valleys USGS “Happy-Isles-topo-map” (no date) via Wikimedia Commons, Creative Commons Attribution
  • 5.
    ELEVATION MAPS CONTINUED: Flat representationof Earth. Have a vertical scale not a horizontal like most maps. Up and down (Author unknown) “Map of Water Sources and Human Settlement” via Wikimedia Commons, Creative Commons Attribution
  • 6.
    CLIMATIC MAPS: Maps usuallyuse colors to show areas. Monthly or annual averages. ALL PICTURES: Peel, M.C “North- American Koppen Map” via Wikimedia Commons, Creative Commons Attribute
  • 7.
    CLIMATIC MAPS CONTINUED: Colored zonescould be represented by: Temperature Precipitation Cloud cover, etc. The National Arbor Day Foundation “2006 Hardiness Zone Map” 2006 via Arbor Day Foundation, Creative Commons Attribute Quibik “Climate Zones of the Continental United States“ February 11, 2008 via Wikipedia, Creative Commons Attribute
  • 8.
    ROAD MAPS: Roads ofa city, state, or other areas. Tourist attractions or historical interests. 2.) U.S. National Atlas, “Map of Florida Roads” March 5, 2009 via Wikimedia Commons, Creative Commons Attribute 1.) Aude, “Massachusetts Avenue” (no date) via Wikipedia, GFDL 3.) File Upload Bot, “Los Angeles Crest Highway“ July 12, 2007 via Wikipedia, Released into the public domain 1.) 2.) 3.)
  • 9.
    ROAD MAPS CONTINUED: Mostwidely used and known map. Used for motorists, etc. MasterSon,“IllinoisStateHighway” January25,2009viaWikipedia, CreativeCommonsAttribute Stratosphere,“WackerDrive” January26,2008viaWikimedia Commons,CreativeCommons Attribution
  • 10.
    THEMATIC MAPS: Shows aparticular theme connected with a geographic area. Can show physical, social, political, cultural, and economic aspects of a region. 1.) Master of Puppets, “Bubonic Plague” September 28, 2006 via Wikipedia, GFDL 1.) 2.) 3.) 2.) Geo Swan, “Ethnic Groups” August 31, 2001 via Wikipedia, Public Domain 3.) (No author) “World Population Map” December 12, 2005 via Flickr, Creative Commons Attribution
  • 11.
    THEMATIC MAPS CONTINUED: Five thematicmapping techniques: Choropleth Proportional symbols Contour Dot Dasymetric Endeavormd, “Injury Mortality Rate” July 18, 2012 via Wikipedia, Creative Commons Attribute
  • 12.
    THEMATIC MAPS CONTINUED: Choropleth Map: Colorrepresents range of values. Data is a color and can show Density Percent, etc. Geoff Hatchard, “Graduated Color” 1995 via www.e-education.psu.edu, Creative Commons Attribute
  • 13.
    THEMATIC MAPS CONTINUED: Proportional Map: Pointlocations such as cities. Circles are most often used for these types of maps. Eric Gaba, “France Map Labour Protests” March 23, 2006 via Wikimedia Commons, Creative Commons Attribute
  • 14.
    THEMATIC MAPS CONTINUED: Contour Map: Depicts precipitationlevels and wind currents. Can also show elevation. National Center for Environmental Prediction, “500 Millibar Height Contour Map” May 10, 2013 via Wikimedia Commons, Creative Commons Attribute
  • 15.
    THEMATIC MAPS CONTINUED:  DotMap: Shows a spatial pattern. Can depict 1 unit or several, depending on what is being shown. (no author)”Cluster Map for the Global Education Collaborative Community” via Flickr, Creative Commons Attribute
  • 16.
    THEMATIC MAPS CONTINUED: Dasymetric Map: Usesstatistics to combine areas with similar values. Magnus Manske, “Incorrect and Correct Population Density for Boston” February 26, 2010 via Wikipedia, Public Domain
  • 17.
    Sources & Citations: Imnh.isu.edu/digitalatlas/geog/basics/topos.htm  www.britannica.com  http:geography.about.com/od/understandmaps/a/thematicmap.htm