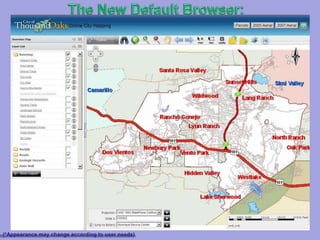
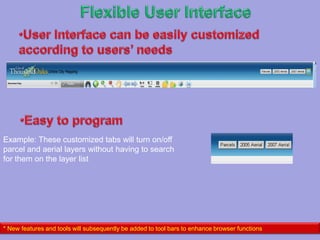
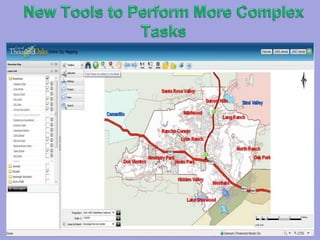
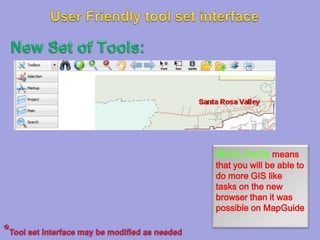
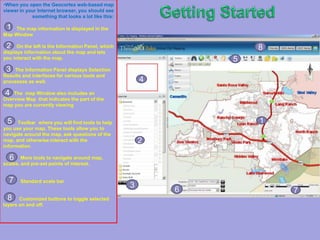
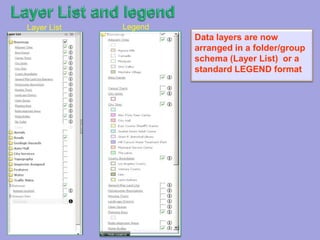
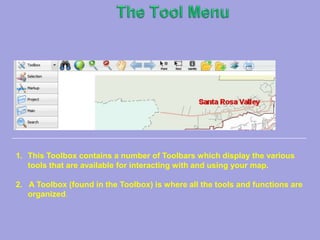
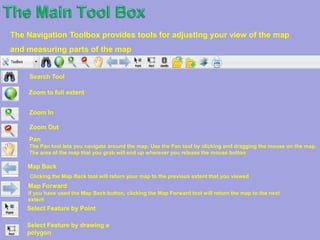
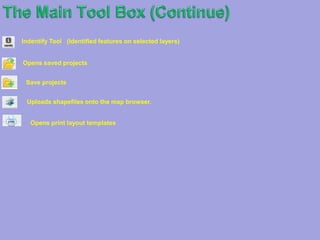
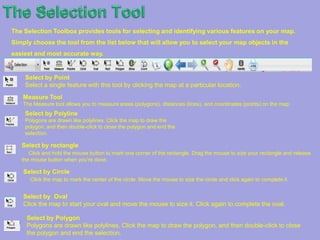
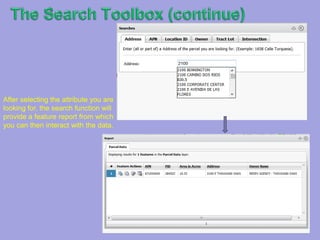
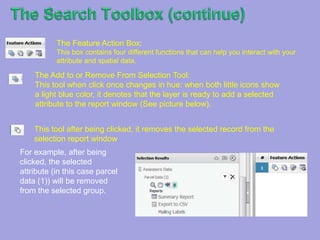
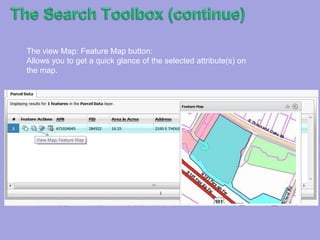
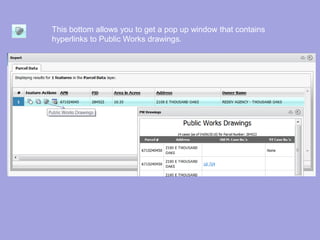
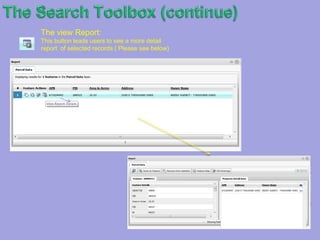
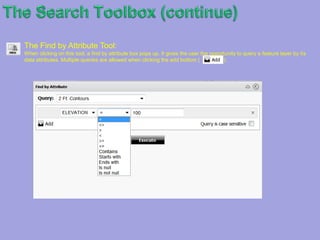
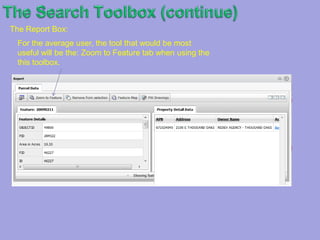
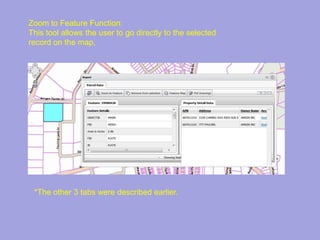
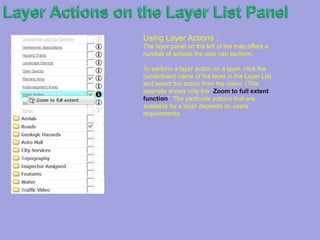
2. The New Default Browser: (*Appearance may change according to user needs)
3.
4. Easy to programExample: These customized tabs will turn on/off parcel and aerial layers without having to search for them on the layer list * New features and tools will subsequently be added to tool bars to enhance browser functions
6. User Friendly tool set interface New Set of Tools: More toolsmeans that you will be able to do more GIS like tasks on the new browser than it was possible on MapGuide *Tool set interface may be modified as needed
7.
8. Layer List and legend Legend Layer List Data layers are now arranged in a folder/group schema (Layer List) or a standard LEGEND format
9. The Tool Menu This Toolbox contains a number of Toolbars which display the various tools that are available for interacting with and using your map. 2. A Toolbox (found in the Toolbox) is where all the tools and functions are organized.
10. The Main Tool Box The Navigation Toolbox provides tools for adjusting your view of the map and measuring parts of the map Search Tool Zoom to full extent Zoom In Zoom Out Pan The Pan tool lets you navigate around the map. Use the Pan tool by clicking and dragging the mouse on the map. The area of the map that you grab will end up wherever you release the mouse button Map Back Clicking the Map Back tool will return your map to the previous extent that you viewed Map Forward If you have used the Map Back button, clicking the Map Forward tool will return the map to the next extent Select Feature by Point Select Feature by drawing a polygon
11. The Main Tool Box (Continue) Indentify Tool (Identified features on selected layers) Opens saved projects Save projects Uploads shapefiles onto the map browser. Opens print layout templates
12. The Selection Tool The Selection Toolbox provides tools for selecting and identifying various features on your map. Simply choose the tool from the list below that will allow you to select your map objects in the easiest and most accurate way. Select by Point Select a single feature with this tool by clicking the map at a particular location. Measure Tool The Measure tool allows you to measure areas (polygons), distances (lines), and coordinates (points) on the map. Select by PolylinePolygons are drawn like polylines. Click the map to draw the polygon, and then double-click to close the polygon and end the selection. Select by rectangle Click and hold the mouse button to mark one corner of the rectangle. Drag the mouse to size your rectangle and release the mouse button when you're done. Select by Circle Click the map to mark the center of the circle. Move the mouse to size the circle and click again to complete it. Select by Oval Click the map to start your oval and move the mouse to size it. Click again to complete the oval. Select by Polygon Polygons are drawn like polylines. Click the map to draw the polygon, and then double-click to close the polygon and end the selection.
13. The Selection Tool (continue) Zoom to Coordinates The Zoom to Coordinates tool allows you to zoom and center the map at particular coordinates. You can enter the coordinates as latitude and longitude; as degrees, minutes, and seconds; or as map units (x,y coordinates). Click the Zoom to Coordinates tool to open the Zoom to coordinates window and enter the coordinates. The map will zoom to and label the coordinates on the map Adds text to the map
14. TheMarkup Toolbox The Markup Toolbox: provides tools to add points, lines, areas and text to your map. Each tool has many options for changing the attributes of your markup, such as fill type, color, transparency and line width. Polyline Markup Use the Polyline Markup tool to draw lines on your map. Select the attributes of your line from the drop-down lists in the Polyline Markup area, then click the map where you want your line to start. Move the mouse to begin drawing and click wherever you want your line to change direction. Double-click to complete your line. Polygon Markup To draw a polygon, select the Polygon Markup tool and choose the attributes of your polygon from the Polygon Markup area. Click the map to mark a starting point for your polygon. Next, add at least two more points by clicking the map in the desired locations. Double-click to close the polygon. Point Markup To add points to your map, click the Point Markup tool and then select the attributes of your point in the Point Markup area of the Information panel. Click the map at the desired locations to add points. Rectangle Markup To add a rectangle to your map, select the Rectangle Markup tool and choose the attributes in the Rectangle Markup area. Click and hold the mouse button down on the desired location on the map. Drag the mouse to size the rectangle and release the mouse button to complete it.
15. TheMarkup Toolbox (continue) Oval Markup Draw an oval on your map using the Oval Markup tool. Select the tool and choose the attributes in the Oval Markup area. Click the map to position the corner of your oval and drag the mouse in any direction until the oval is the desired size. Click again to complete the oval. Circle Markup To create a circle, choose the Circle Markup tool and select attributes in the Oval Markup area. Next, click the map where you want the center of your circle. Move the mouse away from the center to enlarge the circle and back towards the center to shrink it. To complete the circle, click the mouse button again. Text Markup The Text Markup tool allows you to place text on the map, optionally contained in a callout. Specify a format for the text and callout using the options in the Text Markup panel and then click the location on the map that you want to place the markup. Type your text in the window that opens. Use the buttons to insert the location's coordinates or attributes of features that are visible at the markup location. Buffer MarkupUse the Buffer Markup tool to create buffers around any of your markup, including points and Polyline. Click the Buffer Markup tool, and then click the map and drag your mouse to draw a rectangle around any geometries you want to use for creating buffers. Specify the attributes of your buffers (including buffer distance and unit of measurement) in the Markup Buffer area. You can choose to have the original geometries displayed or removed after the buffer is created by selecting or clearing the Remove Selected Geometry check box in the Markup Buffer area. Erase MarkupThe Erase Markup tool allows you to selectively delete markup that you have made. To erase markup, select the tool and then click once on any added text or graphic. To erase multiple graphics at once, click and drag the mouse to create a box around added text or graphics. Release the mouse when the box encloses the markup you want to erase. Note that when a portion of a graphic is enclosed within the eraser box, the entire shape is deleted.
16. TheMarkup Toolbox (continue) Clear All MarkupTo quickly erase all of the existing markup from the map, select the Clear All Markup tool. Before the markup is deleted, you will be asked to confirm or cancel the operation. Swipe Markup Layer The Swipe Markup Layer tool allows you to interactively clear the contents of the Markup layer from the map, like pulling a blind. When you click the Swipe Markup Layer tool, the map redraws with a swipe window overlaying the Map Window. To swipe the layer, drag one of the overlay window's borders. You can swipe vertically or horizontally. To close the overlay window, click the in the window's upper right corner.
17. TheProject Toolbox The Project Toolbox: Offers you the option of saving your map work as a project that you can access at a later date. There are several methods of saving your work, so you can choose the one that works the best for you. Open Project: The Open Project tool allows you to open a previously saved map session. To reopen a map session, select the Open Project tool and locate your project in one of two ways. You can enter the Project ID of a saved project and hit ‘Submit,’ or you can click ‘Browse’ to search for a project that was downloaded to your computer, then press ‘Upload’ to open the file. Save Project: The Save Project tool allows you to save a mapping session for later use or reference. Click the Save Project tool to save your current map viewer extent, layer configuration, and any added markup to be accessed at a later date. You can choose to copy the Project ID for future use, or download your project file and open it later using the Open Project tool. You can also copy the hyperlink provided to open your project in a browser window, as well as use the URL for e-mailing or adding to your map browser favorites Export Map Image : The Export Map Image tool allows you to open, download or e-mail the current map image, optionally georeferenced. You can select among several image formats and resolutions for the exported image. If you select the georeferenced option, the image is exported in a ZIP file, combined with a world file containing the image's georeferenced information.
18. TheProject Toolbox (Continue) Extent Bookmarks: The Extent Bookmarks tool allows you to add custom extents to the Jump to Extent box. Click the Launch Extent Bookmarks tool to open the Extent Bookmark panel (Figure 3). Navigate the map to the desired extents, type the name that you want to appear in the Jump to Extent drop-down list, and click Add . To remove custom extents from the Jump to Extent box, click the Delete Bookmark button to the left of the extents that you want to remove. Zoom to Coordinates It allows the user to enter known coordinates to zoom in to a specific location.
19. TheSearch Toolbox The Search Toolbox : The Search Toolbox contains custom search tools developed for your mapping application. If no custom search tools were developed, you will not see the Search Toolbox. Note that the Toolbox may contain additional custom tools not related to searching. The Searches Tool : When clicking on this tool, a search box pops up. It offers the user a selection of tabs from which to choose the layers to be queried.
20. TheSearch Toolbox (continue) *The Search toolbox will probably the one tool that will be used the most Although, in general, there will be about 100 layers on a browser, only a handful of these data sets have been given priority to perform searches on (as denoted by each tab seen on the upper portion of the search box). (You could still query any layer using the layer attribute function {as exemplified later on}).
21. TheSearch Toolbox (continue) Search action uses an Autofill function similar to those found on browsers such as Google, MSN, Yahoo, and others.
22. TheSearch Toolbox (continue) After selecting the attribute you are looking for, the search function will provide a feature report from which you can then interact with the data.
23. TheSearch Toolbox (continue) The Feature Action Box: This box contains four different functions that can help you interact with your attribute and spatial data. The Add to or Remove From Selection Tool: This tool when click once changes in hue: when both little icons show a light blue color, it denotes that the layer is ready to add a selected attribute to the report window (See picture below). This tool after being clicked, it removes the selected record from the selection report window For example, after being clicked, the selected attribute (in this case parcel data (1)) will be removed from the selected group.
24. TheSearch Toolbox (continue) The view Map: Feature Map button: Allows you to get a quick glance of the selected attribute(s) on the map.
25. This bottom allows you to get a pop up window that contains hyperlinks to Public Works drawings.
26. TheSearch Toolbox (continue) The view Report: This button leads users to see a more detail report of selected records ( Please see below)
27. TheSearch Toolbox (continue) The Find by Attribute Tool: When clicking on this tool, a find by attribute box pops up. It gives the user the opportunity to query a feature layer by its data attributes. Multiple queries are allowed when clicking the add bottom ( ).
28. TheSearch Toolbox (continue) The Report Box: For the average user, the tool that would be most useful will be the: Zoom to Feature tab when using the this toolbox.
29. Zoom to Feature Function: This tool allows the user to go directly to the selected record on the map, *The other 3 tabs were described earlier.
30. Layer Actions on the Layer List Panel Using Layer Actions : The layer panel on the left of the map offers a number of actions the user can perform. To perform a layer action on a layer, click the (underlined) name of the layer in the Layer List and select the action from the menu (This example shows only the “Zoom to full extent function”. The particular actions that are available for a layer depends on users’ requirements.
31. The End Any questions please bring them to Nelson or Nick Foster
32. USING THIS TEMPLATE See the notes pane or view the full notes page (View menu or tab) for detailed help on this template.