Download as PDF, PPTX

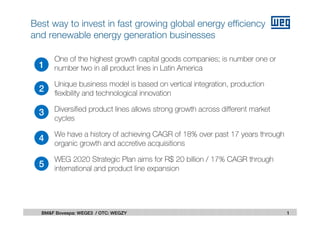
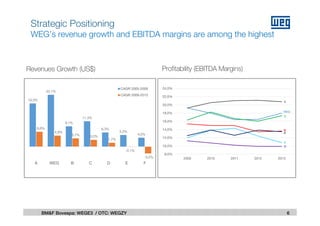
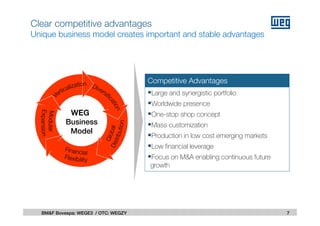
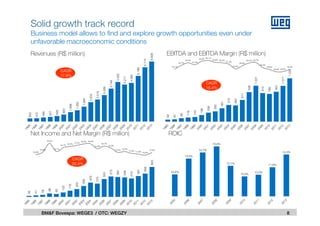

- WEG is one of the highest growth capital goods companies in Latin America and is number one or two in all of its product lines. - It has a unique vertically integrated business model based on production flexibility and technological innovation. - Its diversified product lines allow for strong growth across different market cycles through organic growth and acquisitions.


