The document provides an economic bulletin with the following key points:
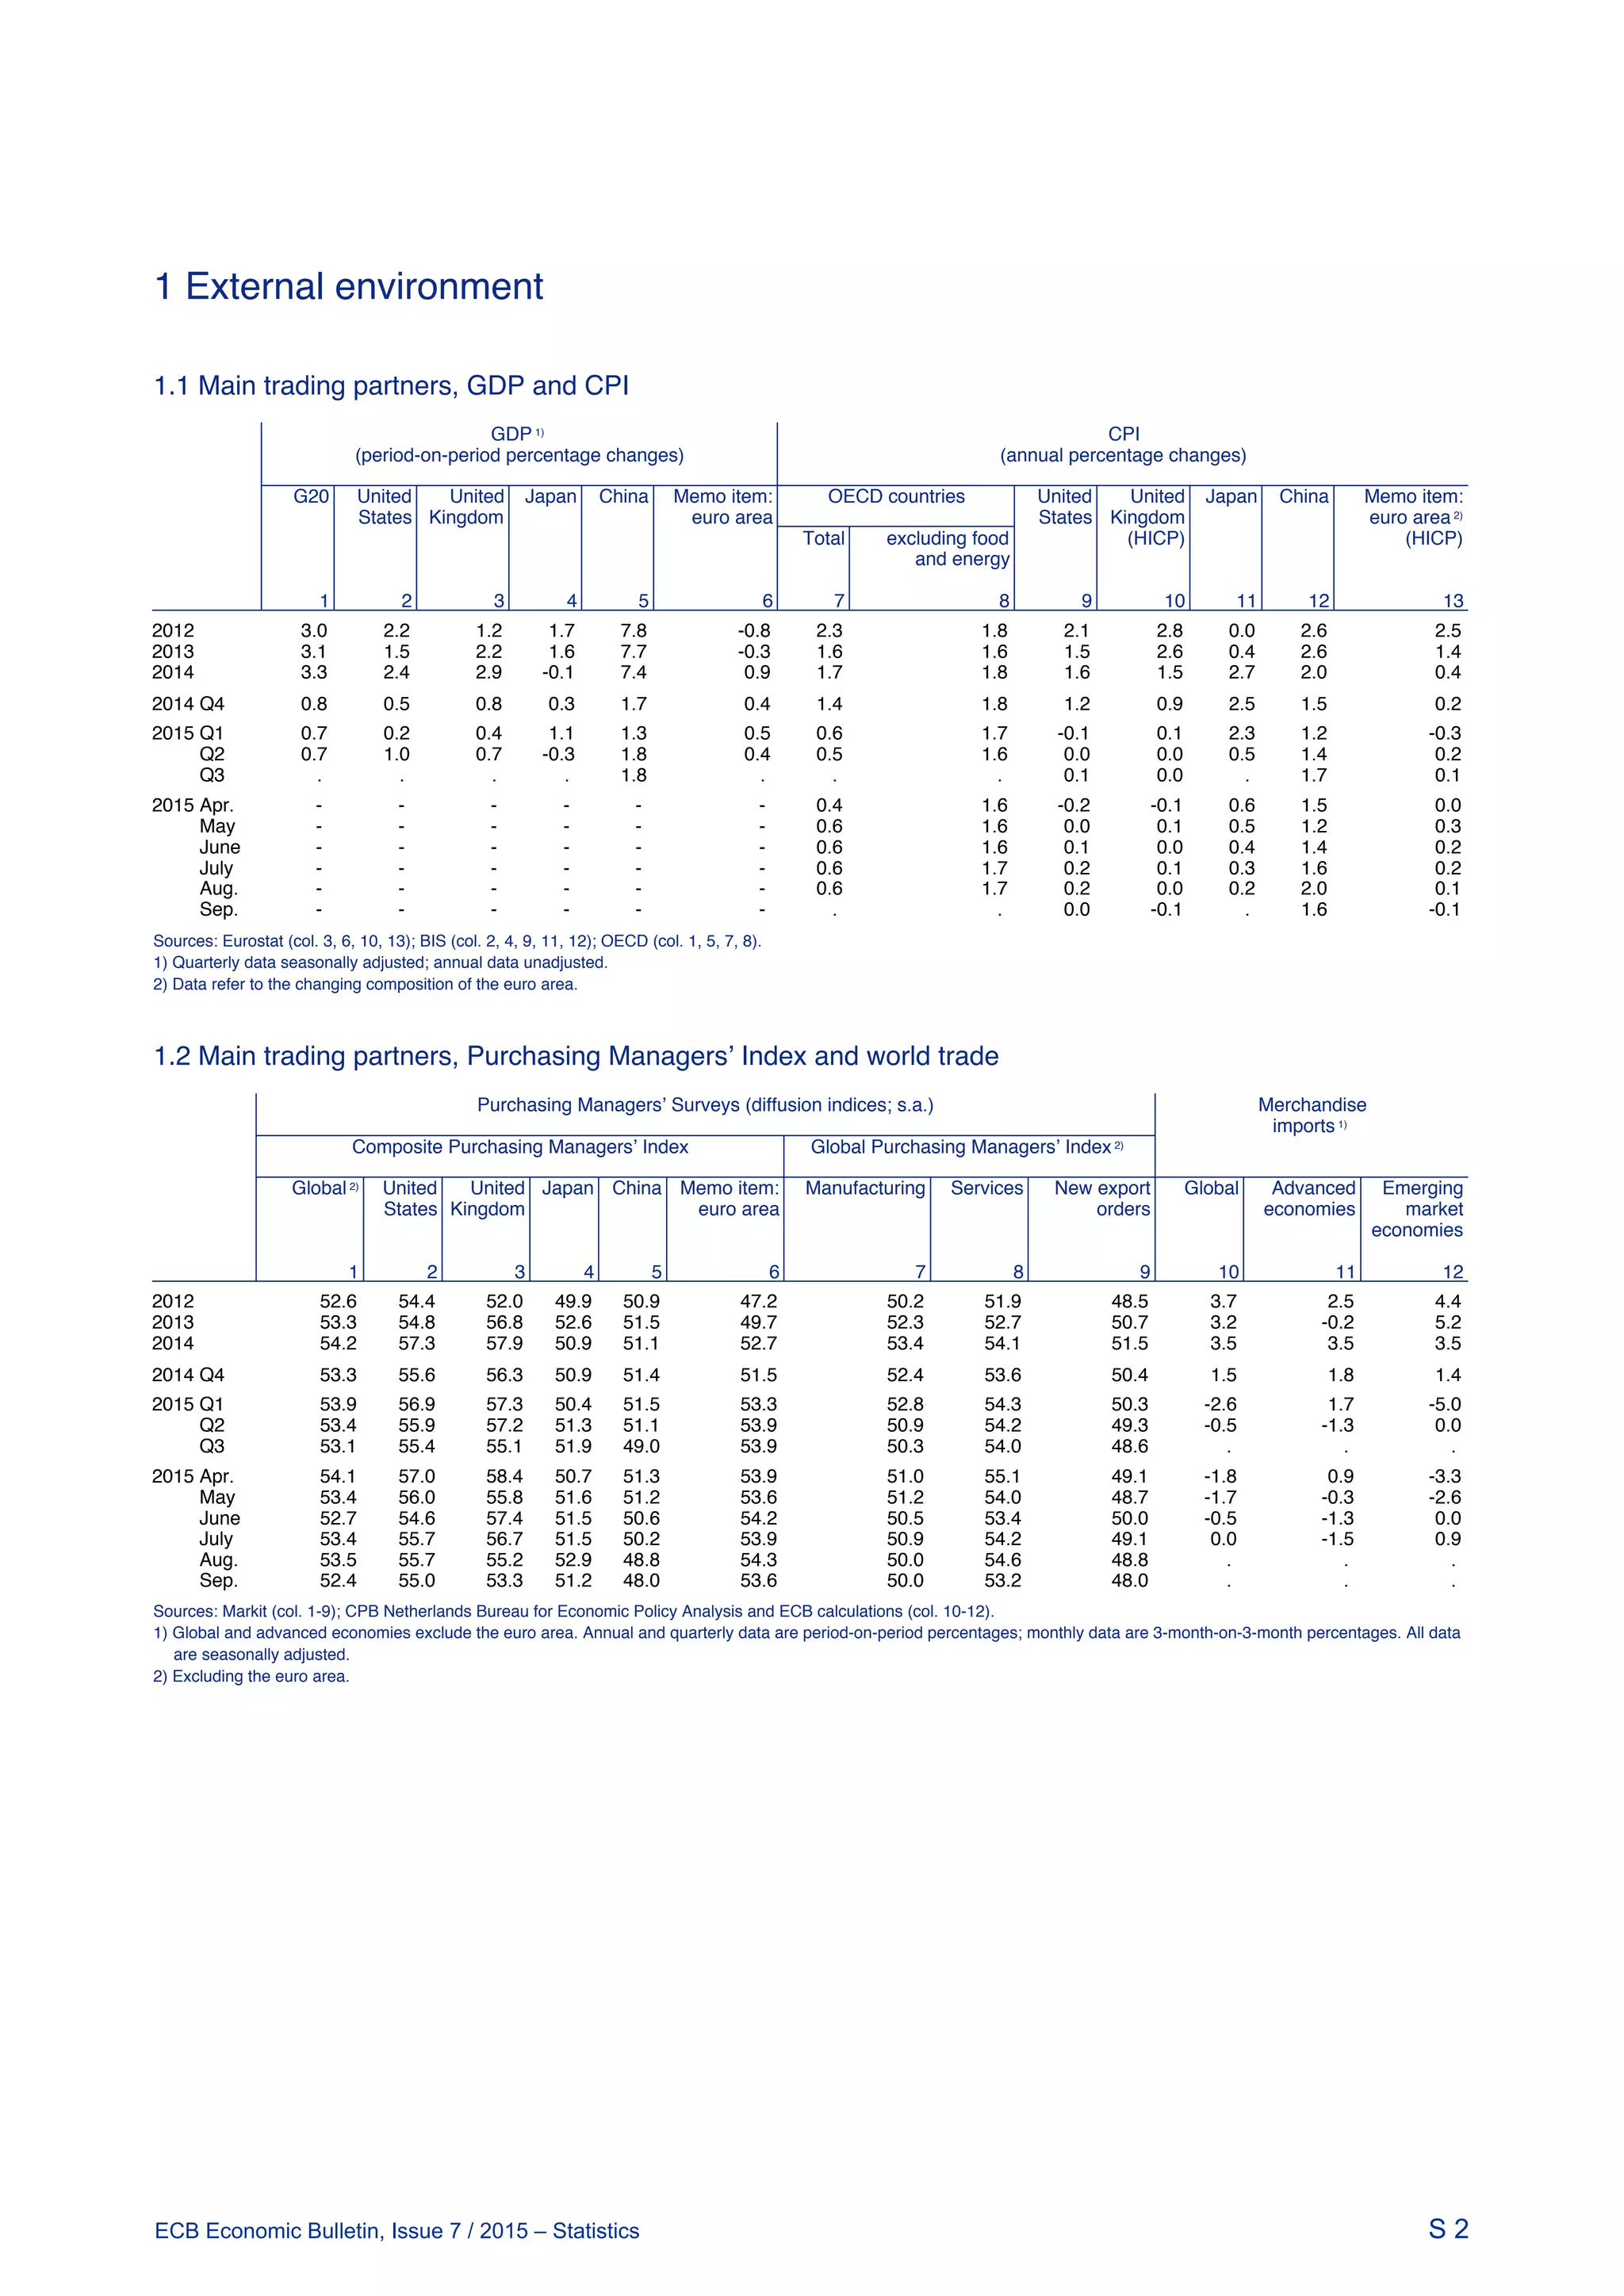
1) Global economic growth remained moderate in the third quarter of 2015, with divergence across major economies. US and UK growth appeared to slow, while Japan's growth remained subdued. China's growth showed a gradual slowdown.
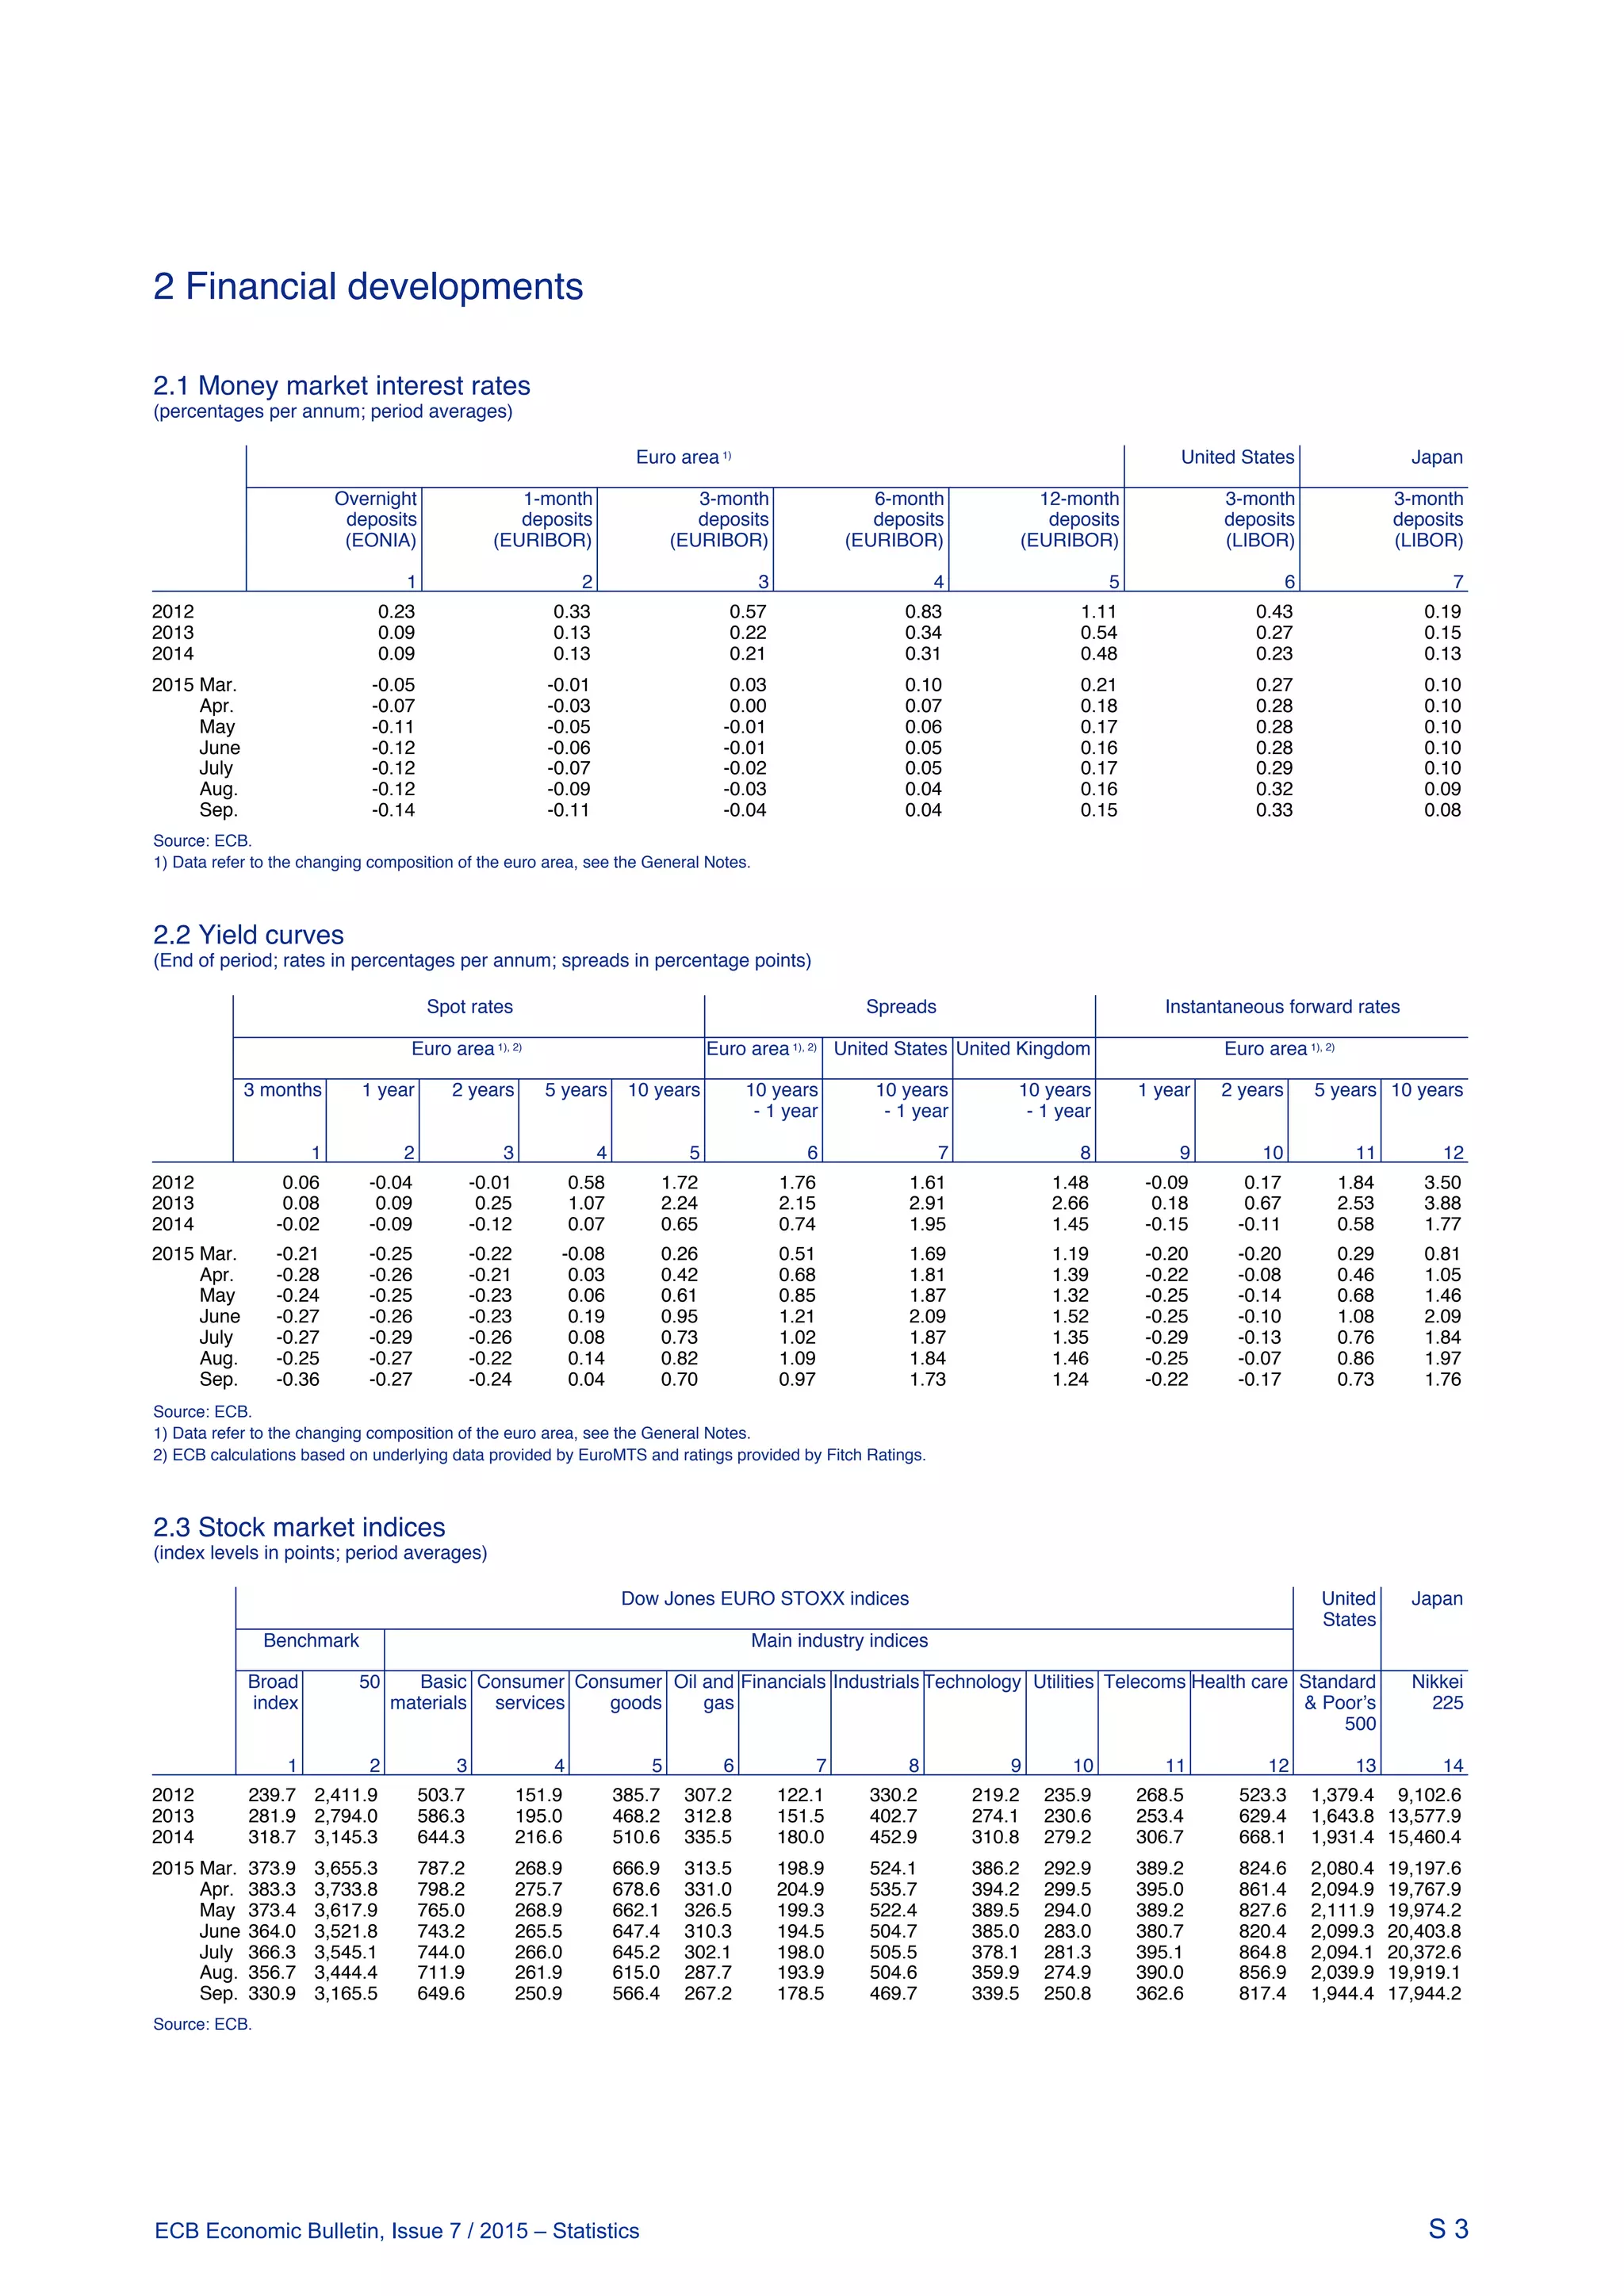
2) Euro area financial markets showed some volatility, with bond yields declining and stock prices rising slightly. The euro remained stable.
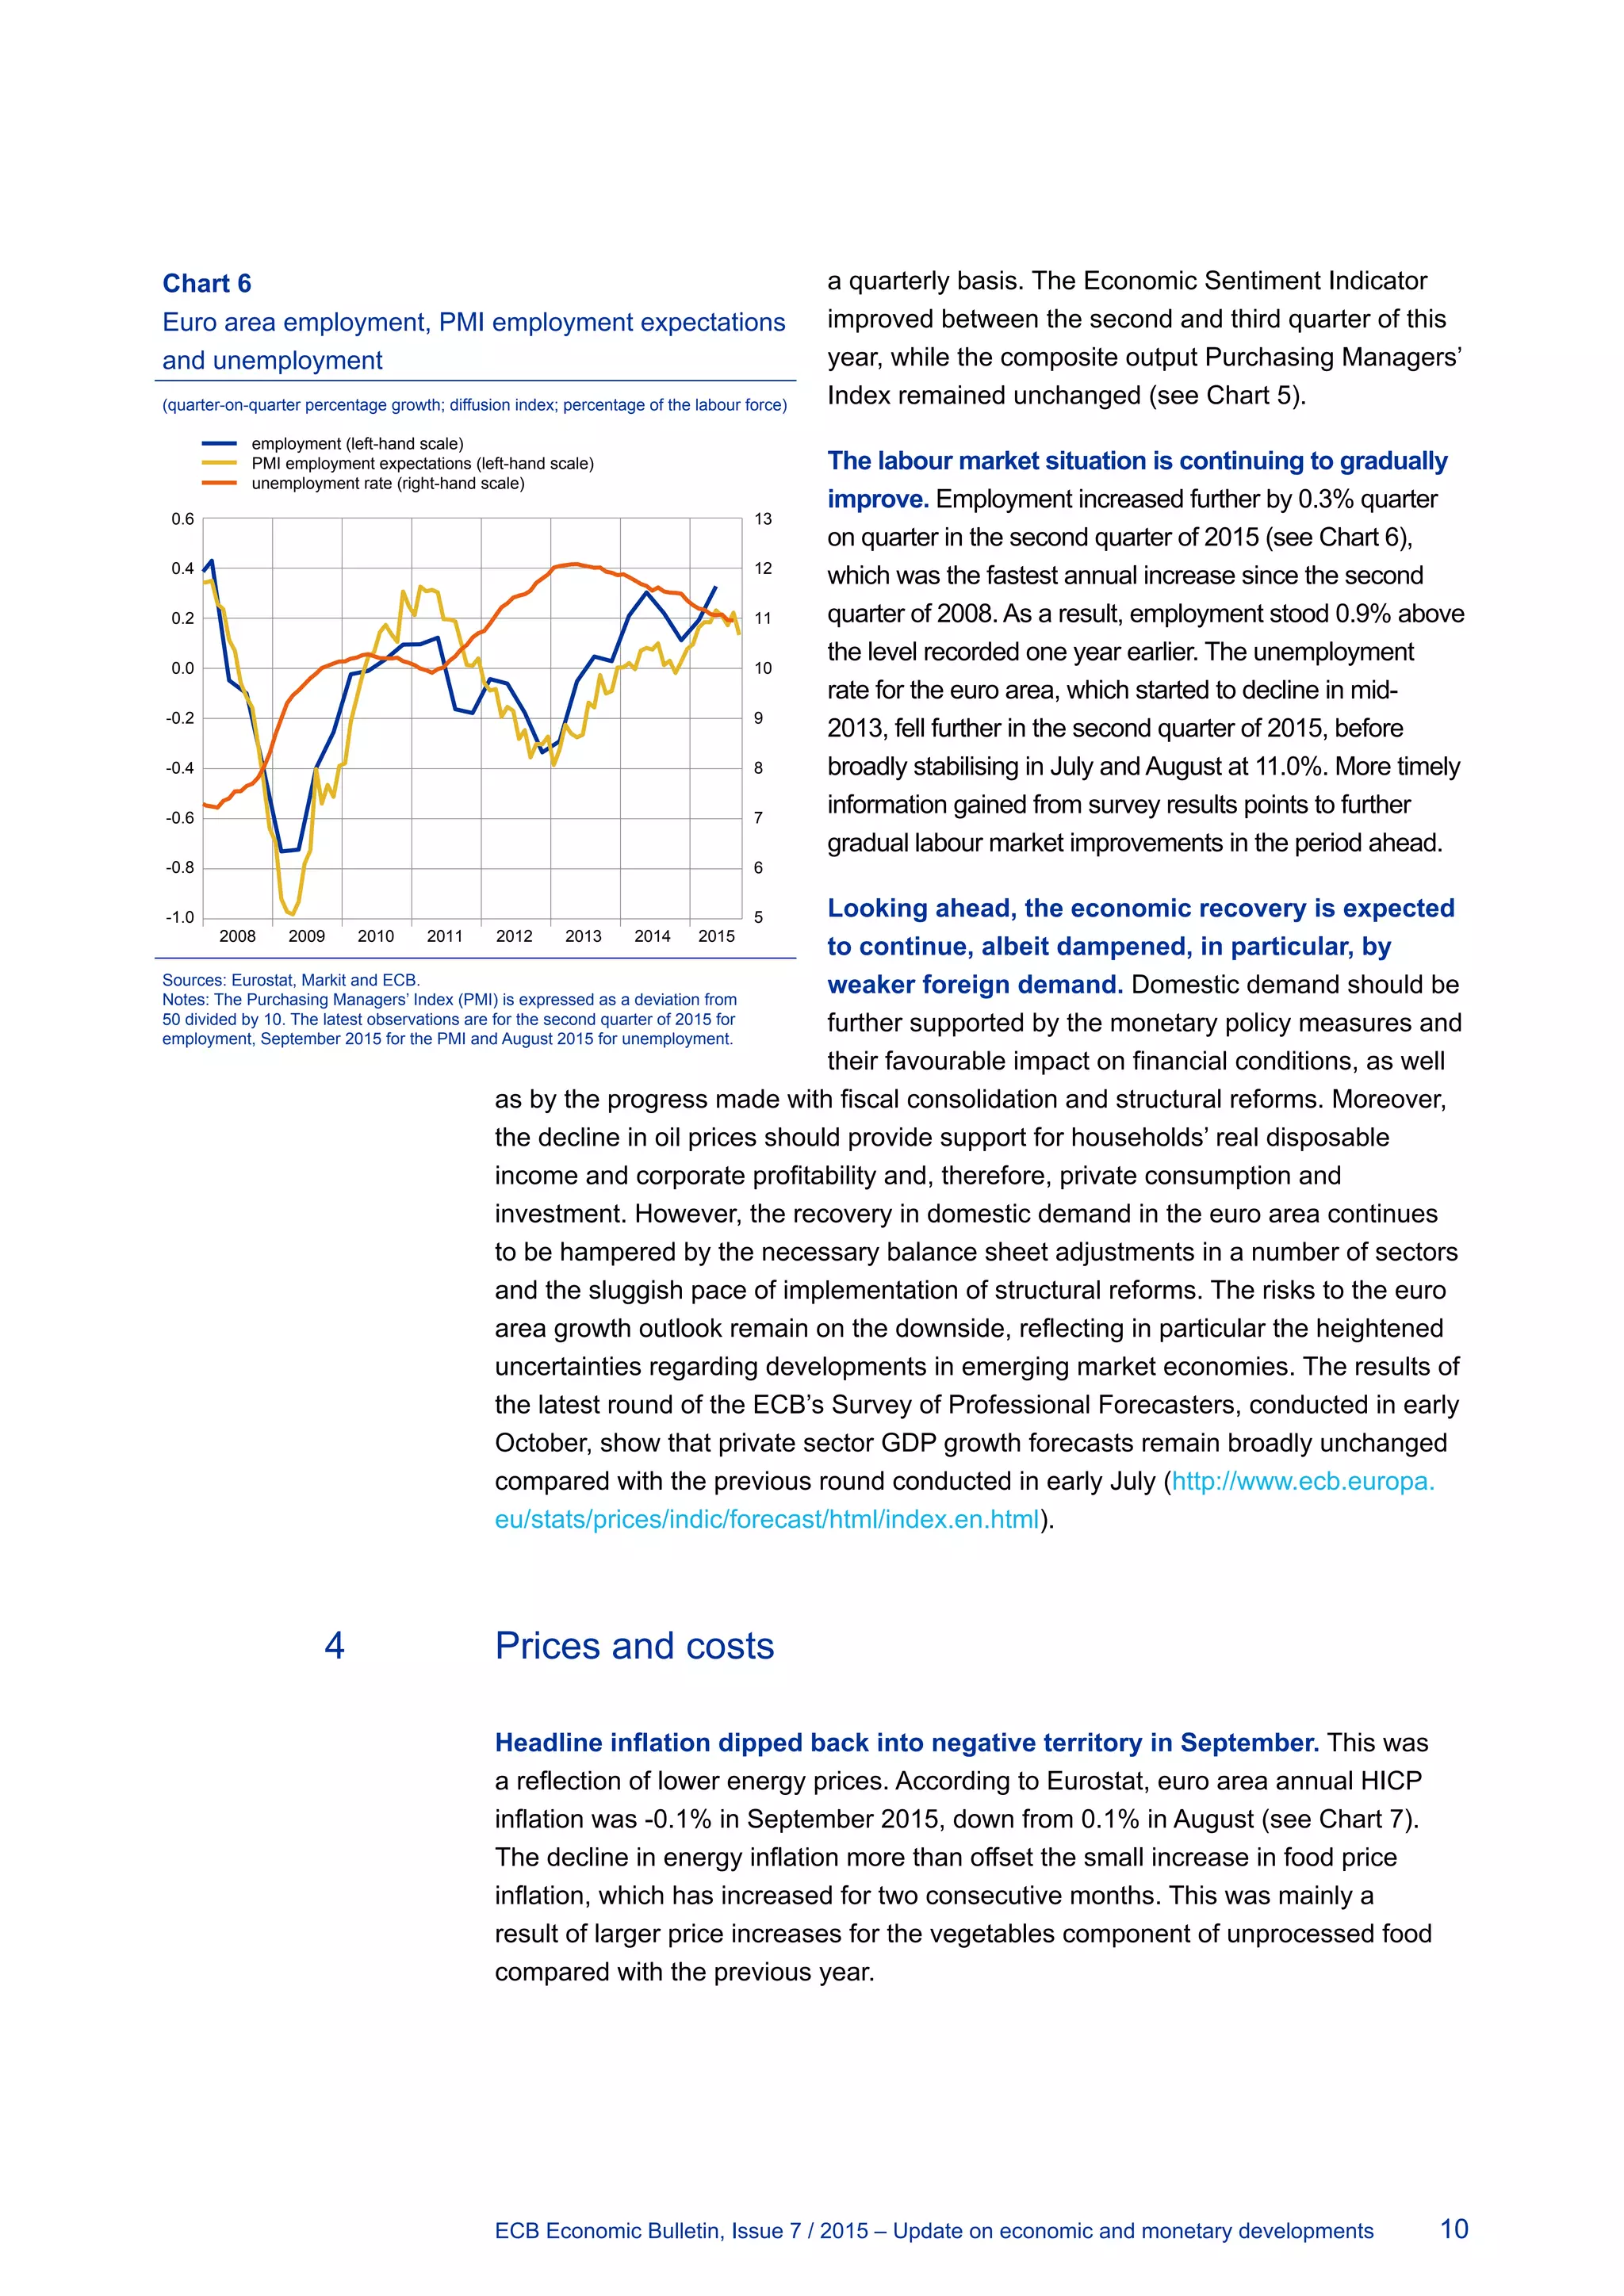
3) Euro area economic recovery is proceeding, supported by private consumption. GDP rose 0.4% in Q2 2015 and a similar pace is expected in Q3. Recovery is expected to continue but dampened by weak foreign demand.