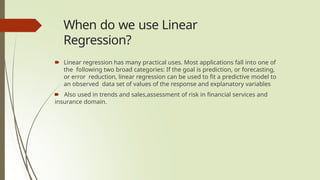
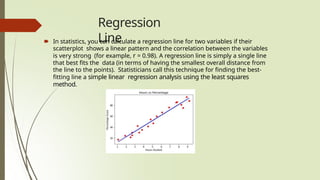
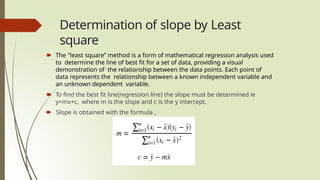
LINEAR
REGRESSION
Presented
by –Bishal Nandi
Roll-
28630520004
Sem-6th
What is Linear
Regression?
🠶 Linear regression in supervised learning technique which is been used in
machine learning.
🠶 Its main task is to determine the relationship between an independent
and dependent variable in which both are continuous.
🠶 In other words it is used for predicting a contionous quantity.
When do we use Linear
Regression?
🠶 Linear regression has many practical uses. Most applications fall into one of
the following two broad categories: If the goal is prediction, or forecasting,
or error reduction, linear regression can be used to fit a predictive model to
an observed data set of values of the response and explanatory variables
🠶 Also used in trends and sales,assessment of risk in financial services and
insurance domain.
Regression
Line
🠶 In statistics, you can calculate a regression line for two variables if their
scatterplot shows a linear pattern and the correlation between the variables
is very strong (for example, r = 0.98). A regression line is simply a single line
that best fits the data (in terms of having the smallest overall distance from
the line to the points). Statisticians call this technique for finding the best-
fitting line a simple linear regression analysis using the least squares
method.
Determination of slope by Least
square
🠶 The "least square” method is a form of mathematical regression analysis used
to determine the line of best fit for a set of data, providing a visual
demonstration of the relationship between the data points. Each point of
data represents the relationship between a known independent variable and
an unknown dependent variable.
🠶 To find the best fit line(regression line) the slope must be determined ie
y=mx+c, where m is the slope and c is the y intercept.
🠶 Slope is obtained with the formula ,
R squared
method
🠶 R-squared is a goodness-of-fit measure for linear regression models. This
statistic indicates the percentage of the variance in the dependent variable
that the independent variables explain collectively. R-squared measures the
strength of the relationship between your model and the dependent variable
on a convenient 0 – 100% scale
🠶 .
Standard error of
estimate
🠶 The standard error of the estimate is a measure of the accuracy of
predictions.
Recall that the regression line is the line that minimizes the sum of squared
deviations of prediction (also called the sum of squares error). The standard
error of the estimate is closely related to this quantity and is defined below:
Advantage
s
🠶 Linear Regression performs well when the dataset is linearly
separable. We can use it to find the nature of the relationship among the
variables.
🠶 Linear Regression is easier to implement, interpret and very efficient to
train.
🠶 Linear Regression is prone to over-fitting but it can be easily avoided using
some dimensionality reduction techniques, regularization (L1 and L2)
techniques and cross-validation.
Disadvantage
s
🠶 Main limitation of Linear Regression is the assumption of linearity
between the dependent variable and the independent variables. In the real
world, the data is rarely linearly separable. It assumes that there is a straight-line
relationship between the dependent and independent variables which is incorrect
many times.
🠶 Prone to noise and overfitting: If the number of observations are
lesser than the number of features, Linear Regression should not be used,
otherwise it may lead to overfit because is starts considering noise in this
scenario while building the model.
🠶 Prone to outliers: Linear regression is very sensitive to outliers (anomalies). So,
outliers should be analyzed and removed before applying Linear Regression to
the dataset.
🠶 Prone to multicollinearity: Before applying Linear regression, multicollinearity
should be removed (using dimensionality reduction techniques) because it
assumes that there is no relationship among independent variables.
Thank
you!!

Ca-1 assignment Machine learning.ygygygpptx

  • 1.
  • 2.
    What is Linear Regression? 🠶Linear regression in supervised learning technique which is been used in machine learning. 🠶 Its main task is to determine the relationship between an independent and dependent variable in which both are continuous. 🠶 In other words it is used for predicting a contionous quantity.
  • 3.
    When do weuse Linear Regression? 🠶 Linear regression has many practical uses. Most applications fall into one of the following two broad categories: If the goal is prediction, or forecasting, or error reduction, linear regression can be used to fit a predictive model to an observed data set of values of the response and explanatory variables 🠶 Also used in trends and sales,assessment of risk in financial services and insurance domain.
  • 4.
    Regression Line 🠶 In statistics,you can calculate a regression line for two variables if their scatterplot shows a linear pattern and the correlation between the variables is very strong (for example, r = 0.98). A regression line is simply a single line that best fits the data (in terms of having the smallest overall distance from the line to the points). Statisticians call this technique for finding the best- fitting line a simple linear regression analysis using the least squares method.
  • 5.
    Determination of slopeby Least square 🠶 The "least square” method is a form of mathematical regression analysis used to determine the line of best fit for a set of data, providing a visual demonstration of the relationship between the data points. Each point of data represents the relationship between a known independent variable and an unknown dependent variable. 🠶 To find the best fit line(regression line) the slope must be determined ie y=mx+c, where m is the slope and c is the y intercept. 🠶 Slope is obtained with the formula ,
  • 6.
    R squared method 🠶 R-squaredis a goodness-of-fit measure for linear regression models. This statistic indicates the percentage of the variance in the dependent variable that the independent variables explain collectively. R-squared measures the strength of the relationship between your model and the dependent variable on a convenient 0 – 100% scale 🠶 .
  • 7.
    Standard error of estimate 🠶The standard error of the estimate is a measure of the accuracy of predictions. Recall that the regression line is the line that minimizes the sum of squared deviations of prediction (also called the sum of squares error). The standard error of the estimate is closely related to this quantity and is defined below:
  • 8.
    Advantage s 🠶 Linear Regressionperforms well when the dataset is linearly separable. We can use it to find the nature of the relationship among the variables. 🠶 Linear Regression is easier to implement, interpret and very efficient to train. 🠶 Linear Regression is prone to over-fitting but it can be easily avoided using some dimensionality reduction techniques, regularization (L1 and L2) techniques and cross-validation.
  • 9.
    Disadvantage s 🠶 Main limitationof Linear Regression is the assumption of linearity between the dependent variable and the independent variables. In the real world, the data is rarely linearly separable. It assumes that there is a straight-line relationship between the dependent and independent variables which is incorrect many times. 🠶 Prone to noise and overfitting: If the number of observations are lesser than the number of features, Linear Regression should not be used, otherwise it may lead to overfit because is starts considering noise in this scenario while building the model. 🠶 Prone to outliers: Linear regression is very sensitive to outliers (anomalies). So, outliers should be analyzed and removed before applying Linear Regression to the dataset. 🠶 Prone to multicollinearity: Before applying Linear regression, multicollinearity should be removed (using dimensionality reduction techniques) because it assumes that there is no relationship among independent variables.
  • 10.