Download to read offline

![“Data-driven journalism is the future”
“[Journalism’s] going to be about poring over data
and equipping yourself with the tools to analyse it
and picking out what's interesting. And keeping it in
perspective, helping people out by really seeing
where it all fits together, and what's going on in the
country.”
Sir Tim Berners-Lee, inventor of the Web, 2010
9](https://image.slidesharecdn.com/mac201datajournalismlecture2014-141015032732-conversion-gate01/85/Mac201-data-journalism-lecture-9-320.jpg)


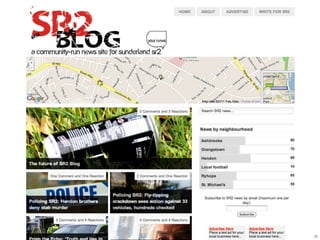

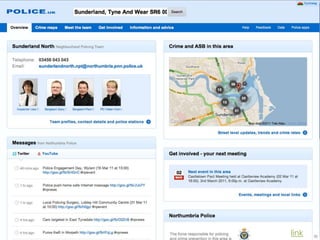
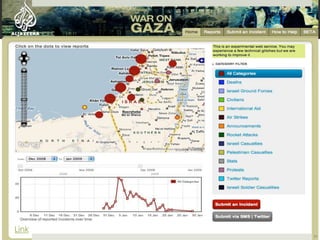
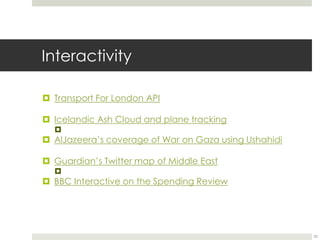


This document discusses the emergence of data journalism and its relationship to traditional journalism. It provides an overview of the history and evolution of data journalism, from its origins in database journalism in the 1950s to the recent growth in data-driven reporting aided by new tools and datasets. Experts argue that data journalism focusing on interrogating and analyzing information is the true essence of journalism. The document also examines debates around whether data journalism challenges traditional storytelling and the ethical implications of working with large datasets.


![The persistent case of media effects research [lecture 2011]](https://cdn.slidesharecdn.com/ss_thumbnails/mac201mediaeffectsresearchlecture2011-12-111107065932-phpapp02-thumbnail.jpg?width=640&height=640&fit=bounds)


