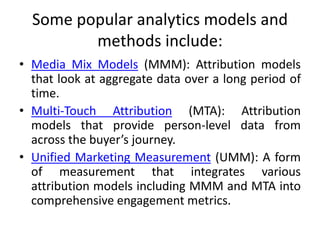
Marketing analytics is the practice of using data to evaluate the effectiveness and success of marketing activities. It allows marketers to gather deeper consumer insights, optimize marketing objectives, and get a better return on investment. Popular analytics models include media mix models, multi-touch attribution, and unified marketing measurement. Organizations use marketing analytics data to make decisions regarding ad spend, product updates, branding, and more. Common predictive analytics techniques used in marketing include decision trees, regression, and neural networks.