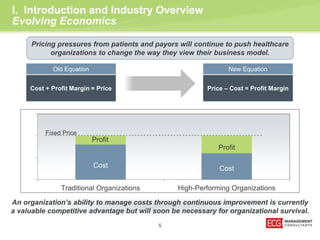
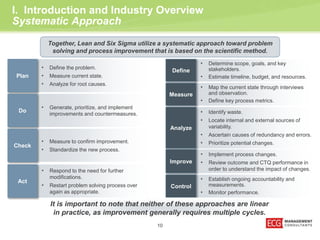
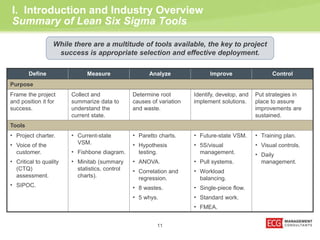
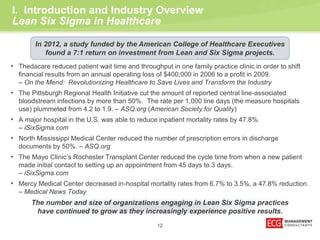
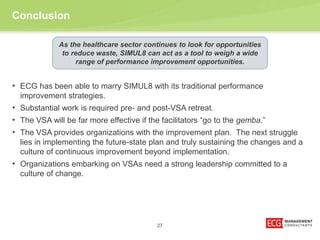
0100.015314516(pptx)-E2 0
Presenters 
John Budd 
Senior Consultant 
ECG Management Consultants, Inc. 
Sean Hartzell 
Senior Manager 
ECG Management Consultants, Inc.
Housekeeping 
• Audio 
• Q and A 
• Recording available on simul8healthcare.com
Agenda 
I. Introduction and Industry Overview 
II. Large Primary Care Case 
III. Orthopedics Case 
IV. Conclusion 
3
I. Introduction and Industry Overview 
4
I. Introduction and Industry Overview 
Evolving Economics 
Pricing pressures from patients and payors will continue to push healthcare 
organizations to change the way they view their business model. 
Old Equation New Equation 
Cost + Profit Margin = Price Price – Cost = Profit Margin 
Cost Cost 
5 
Profit 
Profit 
15 
10 
5 
0 
Fixed Price 
Traditional Organizations High-Performing Organizations 
An organization’s ability to manage costs through continuous improvement is currently 
a valuable competitive advantage but will soon be necessary for organizational survival.
I. Introduction and Industry Overview 
Waste in the System 
In September 2012, the Institute of Medicine (IOM) published 
its findings on waste in the healthcare system. 
Optimize processes and 
establish a Lean culture 
that focuses on continuous 
improvement. 
Develop and implement 
standard work and care 
protocols. 
Conduct analysis of 
variance between 
providers in order to 
identify best practices. 
Streamline processes to 
minimize unnecessary 
expenditures. 
These areas will be the target of continued governmental and payor pressures. 
Organizations with strong continuous improvement programs will be the best prepared. 
6 
Emphasize a business 
model that views profit as 
a function of cost 
reduction.
I. Introduction and Industry Overview 
Learning From Other Industries 
Lean Six Sigma has been used in countless other industries to eliminate 
waste from systems. It is now gaining traction within healthcare. 
At their center, both methods encourage a systematic team-based approach to problem 
solving and an organizational focus on continuous improvement of key processes. 
7 
Lean 
• Emphasizes 
continuous generation 
of value to the 
customer. 
• Continuously seeks to 
reduce waste. 
• Views improvement 
as a job responsibility 
of all employees. 
Six Sigma 
• Emphasizes the 
elimination of defects. 
• Heavily relies on statistical 
analysis and tools. 
• Focuses on structured 
projects with defined 
teams, led by improvement 
experts.
Lean has proven to be a product of its environment as it was developed and has 
thrived within organizations where change was the only alternative to failure. 
Customer Focus 
I. Introduction and Industry Overview 
Lean Production System 
Origins 
• Beginning in the 1950s, the Lean Production System was developed over 
the course of 30 years by the Toyota Manufacturing Company. 
• Built on necessity in post-World War II Japan, it is a product of resource 
8 
and capital scarcity experienced during the period. 
• These economic pressures lead to many of the system’s foundational 
elements: 
– Just-in-Time. 
– Waste reduction. 
– Changeover time reduction. 
Themes 
• Continuous reduction of waste. 
• Respect for people. 
• Create value to the customer. 
• Economies of flow versus economies of scale. 
• Seek improvement over perfection. 
Just-in-Time Jidoka 
Standardization 
Stability 
The pinnacle of the Lean Production System is a 
customer focus. This is supported by Just-in- 
Time and Jidoka production methods. Finally, the 
entire system is built on a foundation of process 
standardization and stability. 
“Improvement usually means doing something that 
we have never done before.” – Mr. Shigeo Shingo
I. Introduction and Industry Overview 
Introduction to Lean Six Sigma 
Six Sigma seeks defect reduction through fact-based, data-driven problem 
solving tools that rely heavily on data analysis and statistical methods. 
9 
Origins 
• Six Sigma methods were founded in the statistical 
analysis of manufacturing processes developed by 
Mr. Walter Shewhart and further refined by Mr. W. 
Edward Deming. 
• Deming’s methods were initially adopted in Japan and 
were said to play a key role in the country’s rise to 
manufacturing prowess in the 1980s. 
• Early U.S. adopters include Motorola, Raytheon, Kodak, 
and GE. 
Themes 
• Any variation from the goal is a loss to society. 
• Defect reduction through fact-based root cause analysis. 
• Process results are a function of its inputs. 
1s 2s 3s 4s 5s 6s 1s 2s 3s 4s 5s 6s x̅ 
The Six Sigma standard aims to preserve six standard 
deviations from the mean before reaching the process 
output defect threshold. Process defects are reduced to 
less than or equal to 3.4 defects per million opportunities. 
“Processes are perfectly designed to produce the results that occur.” – Mr. Deming
I. Introduction and Industry Overview 
Systematic Approach 
10 
• Determine scope, goals, and key 
stakeholders. 
• Estimate timeline, budget, and resources. 
• Map the current state through interviews 
and observation. 
• Define key process metrics. 
• Identify waste. 
• Locate internal and external sources of 
variability. 
• Ascertain causes of redundancy and errors. 
• Prioritize potential changes. 
• Implement process changes. 
• Review outcome and CTQ performance in 
order to understand the impact of changes. 
• Establish ongoing accountability and 
measurements. 
• Monitor performance. 
Define 
Measure 
Analyze 
Improve 
Control 
• Define the problem. 
• Measure current state. 
• Analyze for root causes. 
• Generate, prioritize, and implement 
improvements and countermeasures. 
• Measure to confirm improvement. 
• Standardize the new process. 
• Respond to the need for further 
modifications. 
• Restart problem solving process over 
again as appropriate. 
Plan 
Do 
Check 
Act 
Together, Lean and Six Sigma utilize a systematic approach toward problem 
solving and process improvement that is based on the scientific method. 
It is important to note that neither of these approaches are linear 
in practice, as improvement generally requires multiple cycles.
I. Introduction and Industry Overview 
Summary of Lean Six Sigma Tools 
While there are a multitude of tools available, the key to project 
Define Measure Analyze Improve Control 
Purpose 
Frame the project 
and position it for 
success. 
Collect and 
summarize data to 
understand the 
current state. 
Determine root 
causes of variation 
and waste. 
Identify, develop, and 
implement solutions. 
Put strategies in 
place to assure 
improvements are 
sustained. 
Tools 
• Project charter. 
• Voice of the 
customer. 
• Critical to quality 
(CTQ) 
assessment. 
• SIPOC. 
• Current-state 
VSM. 
• Fishbone diagram. 
• Minitab (summary 
statistics, control 
charts). 
• Paretto charts. 
• Hypothesis 
testing. 
• ANOVA. 
• Correlation and 
regression. 
• 8 wastes. 
• 5 whys. 
• Future-state VSM. 
• 5S/visual 
management. 
• Pull systems. 
• Workload 
balancing. 
• Single-piece flow. 
• Standard work. 
• FMEA. 
• Training plan. 
• Visual controls. 
• Daily 
management. 
success is appropriate selection and effective deployment. 
11
I. Introduction and Industry Overview 
Lean Six Sigma in Healthcare 
In 2012, a study funded by the American College of Healthcare Executives 
found a 7:1 return on investment from Lean and Six Sigma projects. 
• Thedacare reduced patient wait time and throughput in one family practice clinic in order to shift 
financial results from an annual operating loss of $400,000 in 2006 to a profit in 2009. 
– On the Mend: Revolutionizing Healthcare to Save Lives and Transform the Industry 
• The Pittsburgh Regional Health Initiative cut the amount of reported central line-associated 
bloodstream infections by more than 50%. The rate per 1,000 line days (the measure hospitals 
use) plummeted from 4.2 to 1.9. – ASQ.org (American Society for Quality) 
• A major hospital in the U.S. was able to reduce inpatient mortality rates by 47.8%. 
The number and size of organizations engaging in Lean Six Sigma practices 
have continued to grow as they increasingly experience positive results. 
12 
– iSixSigma.com 
• North Mississippi Medical Center reduced the number of prescription errors in discharge 
documents by 50%. – ASQ.org 
• The Mayo Clinic’s Rochester Transplant Center reduced the cycle time from when a new patient 
made initial contact to setting up an appointment from 45 days to 3 days. 
– iSixSigma.com 
• Mercy Medical Center decreased in-hospital mortality rates from 6.7% to 3.5%, a 47.8% reduction. 
– Medical News Today
II. Large Primary Care Case 
13
Objectives 
• Develop an optimal patient flow. 
• Optimize scheduling processes. 
• Design a team-based care model. 
• Provide patient-centered care. 
• Define standards of care for preventive medicine and care management 
ECG Scope of Work 
14 
II. Large Primary Care Case 
Situation 
ECG Management Consultants, Inc., was asked to assist a large primary care 
clinic in developing and implementing performance improvement strategies, 
while leveraging Lean tools and patient-centered medical home concepts. 
The clinic had previously identified numerous areas of improvement 
throughout the year with a long-term goal of improving health 
outcomes, increasing efficiency, and reducing costs. 
processes. 
• Develop a culture of improvement, initially through daily huddles. 
Conduct a value stream analysis and develop a future-state model and 
implementation plan.
II. Large Primary Care Case 
Value Stream Analysis Overview 
The Value Stream Analysis (VSA) is a Lean technique that enables organizations 
to gain a solid understanding of their current state, identify critical process areas 
that need improvement, and begin the process of continuous improvement. 
Key Considerations 
• Requires a team of dedicated staff to commit to participating in an uninterrupted 1-day to week-long 
15 
retreat to conduct the VSA. 
• Substantial work is required pre- and post-VSA retreat. 
• The VSA will be far more effective if the facilitators “go to the gemba.” 
• The VSA provides organizations with the improvement plan. The next struggle lies in 
implementing the future-state plan and truly sustaining the changes and a culture of continuous 
improvement beyond implementation. 
• Organizations embarking on VSAs need a strong leadership committed to a culture of change. 
Develop 
project goals 
and 
objectives. 
Define 
process and 
outcome 
measures. 
Map current 
state. 
Identify 
barriers and 
opportunities. 
Design future 
state and 
improvement 
goals. 
Develop 
training and 
transition 
plan. 
Implement. Sustain. 
VSA Process
II. Large Primary Care Case 
Approach 
A team of physicians, nurses, administrative assistants/schedulers, and other 
administrative staff spent 2 days conducting a VSA. 
• Developed and concurrently managed two work streams focused on processes identified as priority 
16 
improvement areas. 
– Work Stream I – Team-based care, huddle processes, patient flow, and care management. 
– Work Stream II – Scheduling process, preventive care, staffing model, and patient navigators. 
• Leveraged patient-centered medical home concepts as a foundation for developing the future-state 
plan. 
• Mapped out the current-state patient flow, including identifying areas of waste, decision points needed, 
and opportunities for improvement. 
• Developed recommendations for future-state model, addressing all activities in Work Streams I and II.
II. Large Primary Care Case 
Results 
The clinic retreat team developed a future-state value stream for pre-visit, 
prior day of patient visit, patient visit, and post-visit. 
17 
Check and stock 
rooms for the day. 
Review schedule for 
the day and any 
patient notes. 
Bring patient 
back from 
waiting room. 
Review patient 
reason for visit, 
snapshot, and care 
team notes. 
Pend any 
orders for 
M.D./NP. 
RN or 
L.P.N./M.A. 
administers 
any approved 
vaccines or 
injections. 
M.D./NP 
conducts visit 
with patient 
and submits 
orders. 
Care team 
conducts daily 
huddle. 
Room patient – vitals, 
chief complaint, 
allergies, med list, 
medical/social history, 
and other data entry. 
M.D./NP reviews 
medication list that 
RN previously 
reconciled. 
M.D./NP 
documents visit 
in Epic, 
including care 
plan, goals, and 
follow-up 
instructions. 
Print 
patient 
AVS to 
nursing 
station 
and bring 
to patient. 
AOA enters 
patient room 
with AVS and 
assists check-out 
and 
scheduling 
follow-up. 
AOA provides 
patient with 
care team 
phone number 
for other 
follow-up 
needs and 
referrals. 
AOA walks 
patient out of 
clinic. 
Patient Visit – Future-State Value Stream
II. Large Primary Care Case 
Results (continued) 
The clinic optimization retreat resulted in an improvement plan that ultimately helps 
improve efficiencies and reduce waste, allowing clinical staff to work at “the top of 
their license” and provide high-quality, patient-centered care. 
Recommendations 
• Optimized patient flow, restructured huddle processes, simplified scheduling process, 
developed care teams, improved medication reconciliation process, and redesigned clinical 
space for improved efficiency and a collaborative environment. 
• Establish a Primary Care Optimization Team and delegate a Physician Champion. 
• Initiate and expand upon the 6-month implementation plan for the future-state model with a 
18 
phased-in approach over time. 
• Develop and track measures of success – process, clinical, quality, and service. 
• Invest in improving and optimizing the IT infrastructure. 
Lessons Learned 
• Representation from various roles is crucial during the VSA. 
• Everyone has a different perception of the current state. 
• When planning the future state, set high expectations but also be realistic. 
• Spend the time prior to the VSA to walk through the “gemba” and understand the current state 
yourself.
III. Orthopedics Case 
19
20 
III. Orthopedics Case 
Situation 
ECG was asked to assist an orthopedics group in designing and refining future-state 
provider and clinic master schedules via the use of simulation software. 
Clinic Statistics 
• 16 providers. 
• 9 exam rooms. 
– 2 swing rooms. 
• 1 cast/bracing/splinting room. 
• 2012 volumes = 14,121. 
• 4 nurses. 
• 1 medical assistant. 
• 2 registration clerks. 
• 10% unfilled appointments. 
Project Objectives 
• Optimize use of staff and room 
resources. 
• Reduce bottlenecks in the distribution 
of clinic volume across sessions. 
• Increase patient throughput and 
overall clinic volume. 
• Reduce patient wait time. 
• Improve access to available 
appointments.
III. Orthopedics Case 
Overview of Simulation Applications in Healthcare 
Simulation models can be used to test changes in a risk-free 
environment to identify and implement the best solution. 
Operating 
Rooms 
Emergency 
Departments 
Clinic 
Operations 
Space 
Planning 
Disaster 
Planning 
Identify Work 
Queues 
Monitor Resource 
Utilization 
Measure Event 
Duration 
Optimized Platform 
21 
Simulation 
Capabilities 
Common 
Application 
Areas 
Evaluate 
Financial Outputs
III. Orthopedics Case 
Project Methodology and Client Results 
Inputs Over 500 Outputs 
variables were 
needed! 
22 
• Operating hours. 
• Provider schedules. 
• Support staff. 
• Exam rooms. 
• Work flow processes. 
– Check-in. 
– Rooming. 
• Visits = Increased 19%. 
• Wait time = Decreased 40%. 
• Physician utilization = 
Decreased 17%. 
• Nursing utilization = 
Unchanged. 
• Exam room utilization = 
Unchanged. 
Findings 
• Providers were the bottleneck resource. 
• Work flows created inefficiency in deployment of providers. 
Recommendations 
• Redistribution of clinic sessions across days to reduce wait time for patients. 
• Work flow modification to reduce rework by providers and increase clinic capacity.
III. Orthopedics Case 
SIMUL8 Screen Views 
SIMUL8 provides 
graphical representation 
of resources as they 
move along designated 
pathways. 
Simul8 captures wait time 
distributions for selected 
processes in real time. 
23
III. Orthopedics Case 
Overview of Modeling Results 
Metric 
1 
Status Quo 
Scenario 1: 
Standardize 
Provider Start 
and End Times 
Scenario 2: 
Extend Clinic 
Hours 
Scenario 3: 
Schedule 
Providers for 
Three 3-Hour 
Sessions 
Scenario 4: 
Implement New 
X-Ray Process 
Scenario 5: 
Implement New 
X-Ray Process 
and Reduce 
Unfilled 
Appointments 
Scenario 6: 
Extend Clinic 
Hours and 
Implement New 
X-Ray Process 
Patient Statistics 
Unfilled Appointments 10% 10% 10% 10% 10% 0% 10% 
Patients Registered 1,358 1,445 1,622 1,475 1,358 1,504 1,622 
Patients Requiring X-Ray 60% 60% 60% 60% 20% 20% 20% 
Total Patients Sent to X-Ray 813 865 972 883 269 298 321 
Average Wait/Process Times (Minutes) 
Wait Time at Registration 0 0 0 0 0 0 0 
Wait Time for Exam Room 4 5 6 5 3 4 3 
Wait Time to See Provider 7 7 7 7 6 7 6 
Median Time Spent in Clinic 98 98 103 98 57 59 59 
Room Statistics 
Number of Exam Rooms 9 9 9 9 9 9 9 
Usage Rates 47% 50% 58% 45% 35% 44% 43% 
Average Hours Open Per Day 7.9 7.6 8.0 9.0 7.9 7.9 8.0 
Cast Room Visits 544 579 649 592 408 453 487 
Nursing Procedures 339 361 405 368 339 375 405 
Physician Statistics . 
Number of Providers 16 16 16 16 16 16 16 
Available Capacity (Hours) 658 679 769 693 658 658 769 
Total Utilization 106% 106% 105% 106% 90% 99% 89% 
Planned Utilization 2 71% 71% 71% 72% 71% 79% 71% 
Rooms Per Provider 2 2 2 2 2 2 2 
Support Staff 
Number of Nursing Staff 4 4 4 4 4 4 4 
Available Nursing Capacity 896 900 900 900 896 896 900 
Capacity Used 44% 47% 49% 44% 41% 45% 46% 
Number of MAs 1 1 1 1 1 1 1 
Available MA Capacity 225 225 225 225 225 225 225 
Capacity Used 40% 42% 45% 38% 33% 37% 39% 
Number of Clerks 2 2 2 2 2 2 2 
Available Clerk Capacity 456 456 450 458 456 456 450 
Capacity Used 17% 18% 18% 17% 17% 18% 19% 
Results 
Projected Annual Visits 14,121 15,032 16,873 15,344 14,121 15,639 16,873 
Volume Change 0% 6% 19% 9% 0% 11% 19% 
Projected Change in Revenue $ - $ 96,958 $ 328,927 $ 132,970 $ - $ 168,167 $ 328,927 
Increase in Physician Capacity 0% 3% 17% 5% 0% 0% 17% 
Increase in Nursing Capacity 0% 0% 0% 0% 0% 0% 0% 
Increase in Non-Licensed Staff Capacity 0% 0% 0% 0% 0% 0% 0% 
24
III. Orthopedics Case 
SIMUL8 Analytics Capabilities 
25 
Trial Calculator 
Customizable 
to Situation 
Varying 
Levels of 
Modeling 
Financial 
Outputs 
Current- and 
Future-State 
Capture 
Scenario 
Management 
Sample Reports Available 
• Performance measure for all objects in 
simulation. 
• Interactive P&L statements. 
• Ability to track carbon footprint. 
• Gantt chart generation of processes. 
• Detailed log results for further analysis. 
• Time graphs for visual insight. 
• Results segregation to filter by label type. 
– I.e., trauma patients versus fast-track 
patients in an ED. 
• Trials for simulations to validate results.
IV. Conclusion 
26
Conclusion 
As the healthcare sector continues to look for opportunities 
to reduce waste, SIMUL8 can act as a tool to weigh a wide 
range of performance improvement opportunities. 
• ECG has been able to marry SIMUL8 with its traditional performance 
improvement strategies. 
• Substantial work is required pre- and post-VSA retreat. 
• The VSA will be far more effective if the facilitators “go to the gemba.” 
• The VSA provides organizations with the improvement plan. The next struggle 
lies in implementing the future-state plan and truly sustaining the changes and a 
culture of continuous improvement beyond implementation. 
• Organizations embarking on VSAs need a strong leadership committed to a 
27 
culture of change.
QUESTIONS 
• Please forward any topics you would like 
to see covered to claire.c@simul8.com 
• Continue the discussion on SIMUL8 in 
Health – LinkedIn Group

Redefining Workflows with Lean and Simulation

  • 1.
  • 2.
    Presenters John Budd Senior Consultant ECG Management Consultants, Inc. Sean Hartzell Senior Manager ECG Management Consultants, Inc.
  • 3.
    Housekeeping • Audio • Q and A • Recording available on simul8healthcare.com
  • 4.
    Agenda I. Introductionand Industry Overview II. Large Primary Care Case III. Orthopedics Case IV. Conclusion 3
  • 5.
    I. Introduction andIndustry Overview 4
  • 6.
    I. Introduction andIndustry Overview Evolving Economics Pricing pressures from patients and payors will continue to push healthcare organizations to change the way they view their business model. Old Equation New Equation Cost + Profit Margin = Price Price – Cost = Profit Margin Cost Cost 5 Profit Profit 15 10 5 0 Fixed Price Traditional Organizations High-Performing Organizations An organization’s ability to manage costs through continuous improvement is currently a valuable competitive advantage but will soon be necessary for organizational survival.
  • 7.
    I. Introduction andIndustry Overview Waste in the System In September 2012, the Institute of Medicine (IOM) published its findings on waste in the healthcare system. Optimize processes and establish a Lean culture that focuses on continuous improvement. Develop and implement standard work and care protocols. Conduct analysis of variance between providers in order to identify best practices. Streamline processes to minimize unnecessary expenditures. These areas will be the target of continued governmental and payor pressures. Organizations with strong continuous improvement programs will be the best prepared. 6 Emphasize a business model that views profit as a function of cost reduction.
  • 8.
    I. Introduction andIndustry Overview Learning From Other Industries Lean Six Sigma has been used in countless other industries to eliminate waste from systems. It is now gaining traction within healthcare. At their center, both methods encourage a systematic team-based approach to problem solving and an organizational focus on continuous improvement of key processes. 7 Lean • Emphasizes continuous generation of value to the customer. • Continuously seeks to reduce waste. • Views improvement as a job responsibility of all employees. Six Sigma • Emphasizes the elimination of defects. • Heavily relies on statistical analysis and tools. • Focuses on structured projects with defined teams, led by improvement experts.
  • 9.
    Lean has provento be a product of its environment as it was developed and has thrived within organizations where change was the only alternative to failure. Customer Focus I. Introduction and Industry Overview Lean Production System Origins • Beginning in the 1950s, the Lean Production System was developed over the course of 30 years by the Toyota Manufacturing Company. • Built on necessity in post-World War II Japan, it is a product of resource 8 and capital scarcity experienced during the period. • These economic pressures lead to many of the system’s foundational elements: – Just-in-Time. – Waste reduction. – Changeover time reduction. Themes • Continuous reduction of waste. • Respect for people. • Create value to the customer. • Economies of flow versus economies of scale. • Seek improvement over perfection. Just-in-Time Jidoka Standardization Stability The pinnacle of the Lean Production System is a customer focus. This is supported by Just-in- Time and Jidoka production methods. Finally, the entire system is built on a foundation of process standardization and stability. “Improvement usually means doing something that we have never done before.” – Mr. Shigeo Shingo
  • 10.
    I. Introduction andIndustry Overview Introduction to Lean Six Sigma Six Sigma seeks defect reduction through fact-based, data-driven problem solving tools that rely heavily on data analysis and statistical methods. 9 Origins • Six Sigma methods were founded in the statistical analysis of manufacturing processes developed by Mr. Walter Shewhart and further refined by Mr. W. Edward Deming. • Deming’s methods were initially adopted in Japan and were said to play a key role in the country’s rise to manufacturing prowess in the 1980s. • Early U.S. adopters include Motorola, Raytheon, Kodak, and GE. Themes • Any variation from the goal is a loss to society. • Defect reduction through fact-based root cause analysis. • Process results are a function of its inputs. 1s 2s 3s 4s 5s 6s 1s 2s 3s 4s 5s 6s x̅ The Six Sigma standard aims to preserve six standard deviations from the mean before reaching the process output defect threshold. Process defects are reduced to less than or equal to 3.4 defects per million opportunities. “Processes are perfectly designed to produce the results that occur.” – Mr. Deming
  • 11.
    I. Introduction andIndustry Overview Systematic Approach 10 • Determine scope, goals, and key stakeholders. • Estimate timeline, budget, and resources. • Map the current state through interviews and observation. • Define key process metrics. • Identify waste. • Locate internal and external sources of variability. • Ascertain causes of redundancy and errors. • Prioritize potential changes. • Implement process changes. • Review outcome and CTQ performance in order to understand the impact of changes. • Establish ongoing accountability and measurements. • Monitor performance. Define Measure Analyze Improve Control • Define the problem. • Measure current state. • Analyze for root causes. • Generate, prioritize, and implement improvements and countermeasures. • Measure to confirm improvement. • Standardize the new process. • Respond to the need for further modifications. • Restart problem solving process over again as appropriate. Plan Do Check Act Together, Lean and Six Sigma utilize a systematic approach toward problem solving and process improvement that is based on the scientific method. It is important to note that neither of these approaches are linear in practice, as improvement generally requires multiple cycles.
  • 12.
    I. Introduction andIndustry Overview Summary of Lean Six Sigma Tools While there are a multitude of tools available, the key to project Define Measure Analyze Improve Control Purpose Frame the project and position it for success. Collect and summarize data to understand the current state. Determine root causes of variation and waste. Identify, develop, and implement solutions. Put strategies in place to assure improvements are sustained. Tools • Project charter. • Voice of the customer. • Critical to quality (CTQ) assessment. • SIPOC. • Current-state VSM. • Fishbone diagram. • Minitab (summary statistics, control charts). • Paretto charts. • Hypothesis testing. • ANOVA. • Correlation and regression. • 8 wastes. • 5 whys. • Future-state VSM. • 5S/visual management. • Pull systems. • Workload balancing. • Single-piece flow. • Standard work. • FMEA. • Training plan. • Visual controls. • Daily management. success is appropriate selection and effective deployment. 11
  • 13.
    I. Introduction andIndustry Overview Lean Six Sigma in Healthcare In 2012, a study funded by the American College of Healthcare Executives found a 7:1 return on investment from Lean and Six Sigma projects. • Thedacare reduced patient wait time and throughput in one family practice clinic in order to shift financial results from an annual operating loss of $400,000 in 2006 to a profit in 2009. – On the Mend: Revolutionizing Healthcare to Save Lives and Transform the Industry • The Pittsburgh Regional Health Initiative cut the amount of reported central line-associated bloodstream infections by more than 50%. The rate per 1,000 line days (the measure hospitals use) plummeted from 4.2 to 1.9. – ASQ.org (American Society for Quality) • A major hospital in the U.S. was able to reduce inpatient mortality rates by 47.8%. The number and size of organizations engaging in Lean Six Sigma practices have continued to grow as they increasingly experience positive results. 12 – iSixSigma.com • North Mississippi Medical Center reduced the number of prescription errors in discharge documents by 50%. – ASQ.org • The Mayo Clinic’s Rochester Transplant Center reduced the cycle time from when a new patient made initial contact to setting up an appointment from 45 days to 3 days. – iSixSigma.com • Mercy Medical Center decreased in-hospital mortality rates from 6.7% to 3.5%, a 47.8% reduction. – Medical News Today
  • 14.
    II. Large PrimaryCare Case 13
  • 15.
    Objectives • Developan optimal patient flow. • Optimize scheduling processes. • Design a team-based care model. • Provide patient-centered care. • Define standards of care for preventive medicine and care management ECG Scope of Work 14 II. Large Primary Care Case Situation ECG Management Consultants, Inc., was asked to assist a large primary care clinic in developing and implementing performance improvement strategies, while leveraging Lean tools and patient-centered medical home concepts. The clinic had previously identified numerous areas of improvement throughout the year with a long-term goal of improving health outcomes, increasing efficiency, and reducing costs. processes. • Develop a culture of improvement, initially through daily huddles. Conduct a value stream analysis and develop a future-state model and implementation plan.
  • 16.
    II. Large PrimaryCare Case Value Stream Analysis Overview The Value Stream Analysis (VSA) is a Lean technique that enables organizations to gain a solid understanding of their current state, identify critical process areas that need improvement, and begin the process of continuous improvement. Key Considerations • Requires a team of dedicated staff to commit to participating in an uninterrupted 1-day to week-long 15 retreat to conduct the VSA. • Substantial work is required pre- and post-VSA retreat. • The VSA will be far more effective if the facilitators “go to the gemba.” • The VSA provides organizations with the improvement plan. The next struggle lies in implementing the future-state plan and truly sustaining the changes and a culture of continuous improvement beyond implementation. • Organizations embarking on VSAs need a strong leadership committed to a culture of change. Develop project goals and objectives. Define process and outcome measures. Map current state. Identify barriers and opportunities. Design future state and improvement goals. Develop training and transition plan. Implement. Sustain. VSA Process
  • 17.
    II. Large PrimaryCare Case Approach A team of physicians, nurses, administrative assistants/schedulers, and other administrative staff spent 2 days conducting a VSA. • Developed and concurrently managed two work streams focused on processes identified as priority 16 improvement areas. – Work Stream I – Team-based care, huddle processes, patient flow, and care management. – Work Stream II – Scheduling process, preventive care, staffing model, and patient navigators. • Leveraged patient-centered medical home concepts as a foundation for developing the future-state plan. • Mapped out the current-state patient flow, including identifying areas of waste, decision points needed, and opportunities for improvement. • Developed recommendations for future-state model, addressing all activities in Work Streams I and II.
  • 18.
    II. Large PrimaryCare Case Results The clinic retreat team developed a future-state value stream for pre-visit, prior day of patient visit, patient visit, and post-visit. 17 Check and stock rooms for the day. Review schedule for the day and any patient notes. Bring patient back from waiting room. Review patient reason for visit, snapshot, and care team notes. Pend any orders for M.D./NP. RN or L.P.N./M.A. administers any approved vaccines or injections. M.D./NP conducts visit with patient and submits orders. Care team conducts daily huddle. Room patient – vitals, chief complaint, allergies, med list, medical/social history, and other data entry. M.D./NP reviews medication list that RN previously reconciled. M.D./NP documents visit in Epic, including care plan, goals, and follow-up instructions. Print patient AVS to nursing station and bring to patient. AOA enters patient room with AVS and assists check-out and scheduling follow-up. AOA provides patient with care team phone number for other follow-up needs and referrals. AOA walks patient out of clinic. Patient Visit – Future-State Value Stream
  • 19.
    II. Large PrimaryCare Case Results (continued) The clinic optimization retreat resulted in an improvement plan that ultimately helps improve efficiencies and reduce waste, allowing clinical staff to work at “the top of their license” and provide high-quality, patient-centered care. Recommendations • Optimized patient flow, restructured huddle processes, simplified scheduling process, developed care teams, improved medication reconciliation process, and redesigned clinical space for improved efficiency and a collaborative environment. • Establish a Primary Care Optimization Team and delegate a Physician Champion. • Initiate and expand upon the 6-month implementation plan for the future-state model with a 18 phased-in approach over time. • Develop and track measures of success – process, clinical, quality, and service. • Invest in improving and optimizing the IT infrastructure. Lessons Learned • Representation from various roles is crucial during the VSA. • Everyone has a different perception of the current state. • When planning the future state, set high expectations but also be realistic. • Spend the time prior to the VSA to walk through the “gemba” and understand the current state yourself.
  • 20.
  • 21.
    20 III. OrthopedicsCase Situation ECG was asked to assist an orthopedics group in designing and refining future-state provider and clinic master schedules via the use of simulation software. Clinic Statistics • 16 providers. • 9 exam rooms. – 2 swing rooms. • 1 cast/bracing/splinting room. • 2012 volumes = 14,121. • 4 nurses. • 1 medical assistant. • 2 registration clerks. • 10% unfilled appointments. Project Objectives • Optimize use of staff and room resources. • Reduce bottlenecks in the distribution of clinic volume across sessions. • Increase patient throughput and overall clinic volume. • Reduce patient wait time. • Improve access to available appointments.
  • 22.
    III. Orthopedics Case Overview of Simulation Applications in Healthcare Simulation models can be used to test changes in a risk-free environment to identify and implement the best solution. Operating Rooms Emergency Departments Clinic Operations Space Planning Disaster Planning Identify Work Queues Monitor Resource Utilization Measure Event Duration Optimized Platform 21 Simulation Capabilities Common Application Areas Evaluate Financial Outputs
  • 23.
    III. Orthopedics Case Project Methodology and Client Results Inputs Over 500 Outputs variables were needed! 22 • Operating hours. • Provider schedules. • Support staff. • Exam rooms. • Work flow processes. – Check-in. – Rooming. • Visits = Increased 19%. • Wait time = Decreased 40%. • Physician utilization = Decreased 17%. • Nursing utilization = Unchanged. • Exam room utilization = Unchanged. Findings • Providers were the bottleneck resource. • Work flows created inefficiency in deployment of providers. Recommendations • Redistribution of clinic sessions across days to reduce wait time for patients. • Work flow modification to reduce rework by providers and increase clinic capacity.
  • 24.
    III. Orthopedics Case SIMUL8 Screen Views SIMUL8 provides graphical representation of resources as they move along designated pathways. Simul8 captures wait time distributions for selected processes in real time. 23
  • 25.
    III. Orthopedics Case Overview of Modeling Results Metric 1 Status Quo Scenario 1: Standardize Provider Start and End Times Scenario 2: Extend Clinic Hours Scenario 3: Schedule Providers for Three 3-Hour Sessions Scenario 4: Implement New X-Ray Process Scenario 5: Implement New X-Ray Process and Reduce Unfilled Appointments Scenario 6: Extend Clinic Hours and Implement New X-Ray Process Patient Statistics Unfilled Appointments 10% 10% 10% 10% 10% 0% 10% Patients Registered 1,358 1,445 1,622 1,475 1,358 1,504 1,622 Patients Requiring X-Ray 60% 60% 60% 60% 20% 20% 20% Total Patients Sent to X-Ray 813 865 972 883 269 298 321 Average Wait/Process Times (Minutes) Wait Time at Registration 0 0 0 0 0 0 0 Wait Time for Exam Room 4 5 6 5 3 4 3 Wait Time to See Provider 7 7 7 7 6 7 6 Median Time Spent in Clinic 98 98 103 98 57 59 59 Room Statistics Number of Exam Rooms 9 9 9 9 9 9 9 Usage Rates 47% 50% 58% 45% 35% 44% 43% Average Hours Open Per Day 7.9 7.6 8.0 9.0 7.9 7.9 8.0 Cast Room Visits 544 579 649 592 408 453 487 Nursing Procedures 339 361 405 368 339 375 405 Physician Statistics . Number of Providers 16 16 16 16 16 16 16 Available Capacity (Hours) 658 679 769 693 658 658 769 Total Utilization 106% 106% 105% 106% 90% 99% 89% Planned Utilization 2 71% 71% 71% 72% 71% 79% 71% Rooms Per Provider 2 2 2 2 2 2 2 Support Staff Number of Nursing Staff 4 4 4 4 4 4 4 Available Nursing Capacity 896 900 900 900 896 896 900 Capacity Used 44% 47% 49% 44% 41% 45% 46% Number of MAs 1 1 1 1 1 1 1 Available MA Capacity 225 225 225 225 225 225 225 Capacity Used 40% 42% 45% 38% 33% 37% 39% Number of Clerks 2 2 2 2 2 2 2 Available Clerk Capacity 456 456 450 458 456 456 450 Capacity Used 17% 18% 18% 17% 17% 18% 19% Results Projected Annual Visits 14,121 15,032 16,873 15,344 14,121 15,639 16,873 Volume Change 0% 6% 19% 9% 0% 11% 19% Projected Change in Revenue $ - $ 96,958 $ 328,927 $ 132,970 $ - $ 168,167 $ 328,927 Increase in Physician Capacity 0% 3% 17% 5% 0% 0% 17% Increase in Nursing Capacity 0% 0% 0% 0% 0% 0% 0% Increase in Non-Licensed Staff Capacity 0% 0% 0% 0% 0% 0% 0% 24
  • 26.
    III. Orthopedics Case SIMUL8 Analytics Capabilities 25 Trial Calculator Customizable to Situation Varying Levels of Modeling Financial Outputs Current- and Future-State Capture Scenario Management Sample Reports Available • Performance measure for all objects in simulation. • Interactive P&L statements. • Ability to track carbon footprint. • Gantt chart generation of processes. • Detailed log results for further analysis. • Time graphs for visual insight. • Results segregation to filter by label type. – I.e., trauma patients versus fast-track patients in an ED. • Trials for simulations to validate results.
  • 27.
  • 28.
    Conclusion As thehealthcare sector continues to look for opportunities to reduce waste, SIMUL8 can act as a tool to weigh a wide range of performance improvement opportunities. • ECG has been able to marry SIMUL8 with its traditional performance improvement strategies. • Substantial work is required pre- and post-VSA retreat. • The VSA will be far more effective if the facilitators “go to the gemba.” • The VSA provides organizations with the improvement plan. The next struggle lies in implementing the future-state plan and truly sustaining the changes and a culture of continuous improvement beyond implementation. • Organizations embarking on VSAs need a strong leadership committed to a 27 culture of change.
  • 29.
    QUESTIONS • Pleaseforward any topics you would like to see covered to claire.c@simul8.com • Continue the discussion on SIMUL8 in Health – LinkedIn Group

Editor's Notes

  • #17 15
  • #22 Thanks Emma. I’ll go ahead and jump right in. As part of the initial organizational assessment at the clinic, the orthopedic clinic was identified as an area to deploy simulation due to the multiple issues identified. ECG was asked to come in an optimize the deployment of clinic resources via the use of simulation software. As you can see on our objectives we had a lot of issues to tackle, but without the time to create and test multiple pilot programs to find the optimal clinic flow. On the right we have some statistics should provide a conceptual understanding of this clinic.
  • #23 21
  • #24 So how exactly did we develop a model? I’ve been talking about what simulation can do, but what does it take to actually build a model? Its very similar to a financial model where inputs are manipulated in order to find the desired output. However, simulation takes modeling a step further by incorporating variables to reflect reality. For example in our inputs we gathered the following data: We set how long the clinic would be open, typically 8-4 with some days running to 7. Provider schedules were set down to the 15min mark. Providers are on 6 week blocks with varying days and times. On-call rotations (which were on 4 week blocks) were input as well. Support staff schedules were input, this included nursing and MA schedules, which were on 4 week blocks as well. Some exam rooms were only built to see certain types of patients so rules were placed on those rooms in the model. The most important pieces however were the clinical flows; this included how often were patients scheduled. What are the scheduled visit durations versus the actual visit durations? Limiting APCs to only return patients. What percentage of patients required a brace, who was needed to place the brace? Did some patients need an X-ray? If so, they’d need to come back to the clinic and use another room. In all, over 500 variables were input into the model in order to capture the current state of the clinic. From there the process was fairly simple. Then we manipulated provider schedules, room assignments, process flows, and unfilled appointment slots in order to find the optimal clinic flow. From our initial conversations it was thought that the exam rooms were the bottleneck in the process, however after running our model (for a year) we found the providers to be the bottleneck. We tested for changes to optimize the use of providers (we did not make them work faster in the model) which led to our recommendations. Median Time in Clinic = 98 minutes to 60 mins Physician Utilization = 106% to 90% Nursing Utilization = 44% Exam Room Utilization = 47%
  • #27 25