Downloaded 74 times


![UST Global®, 20 Enterprise, Aliso Viejo CA 92656
Phone: (949) 716-8757 Fax: (949) 716-8396
www.ust-global.com
Authors:
Gregory Jose Gregory.jose@ust-global.com
Jusha Joseph Jusha.Joseph@ust-global.com
All trademarks are the property of their respective owners. UST Global® Copyright © 2014. All Rights Reserved.
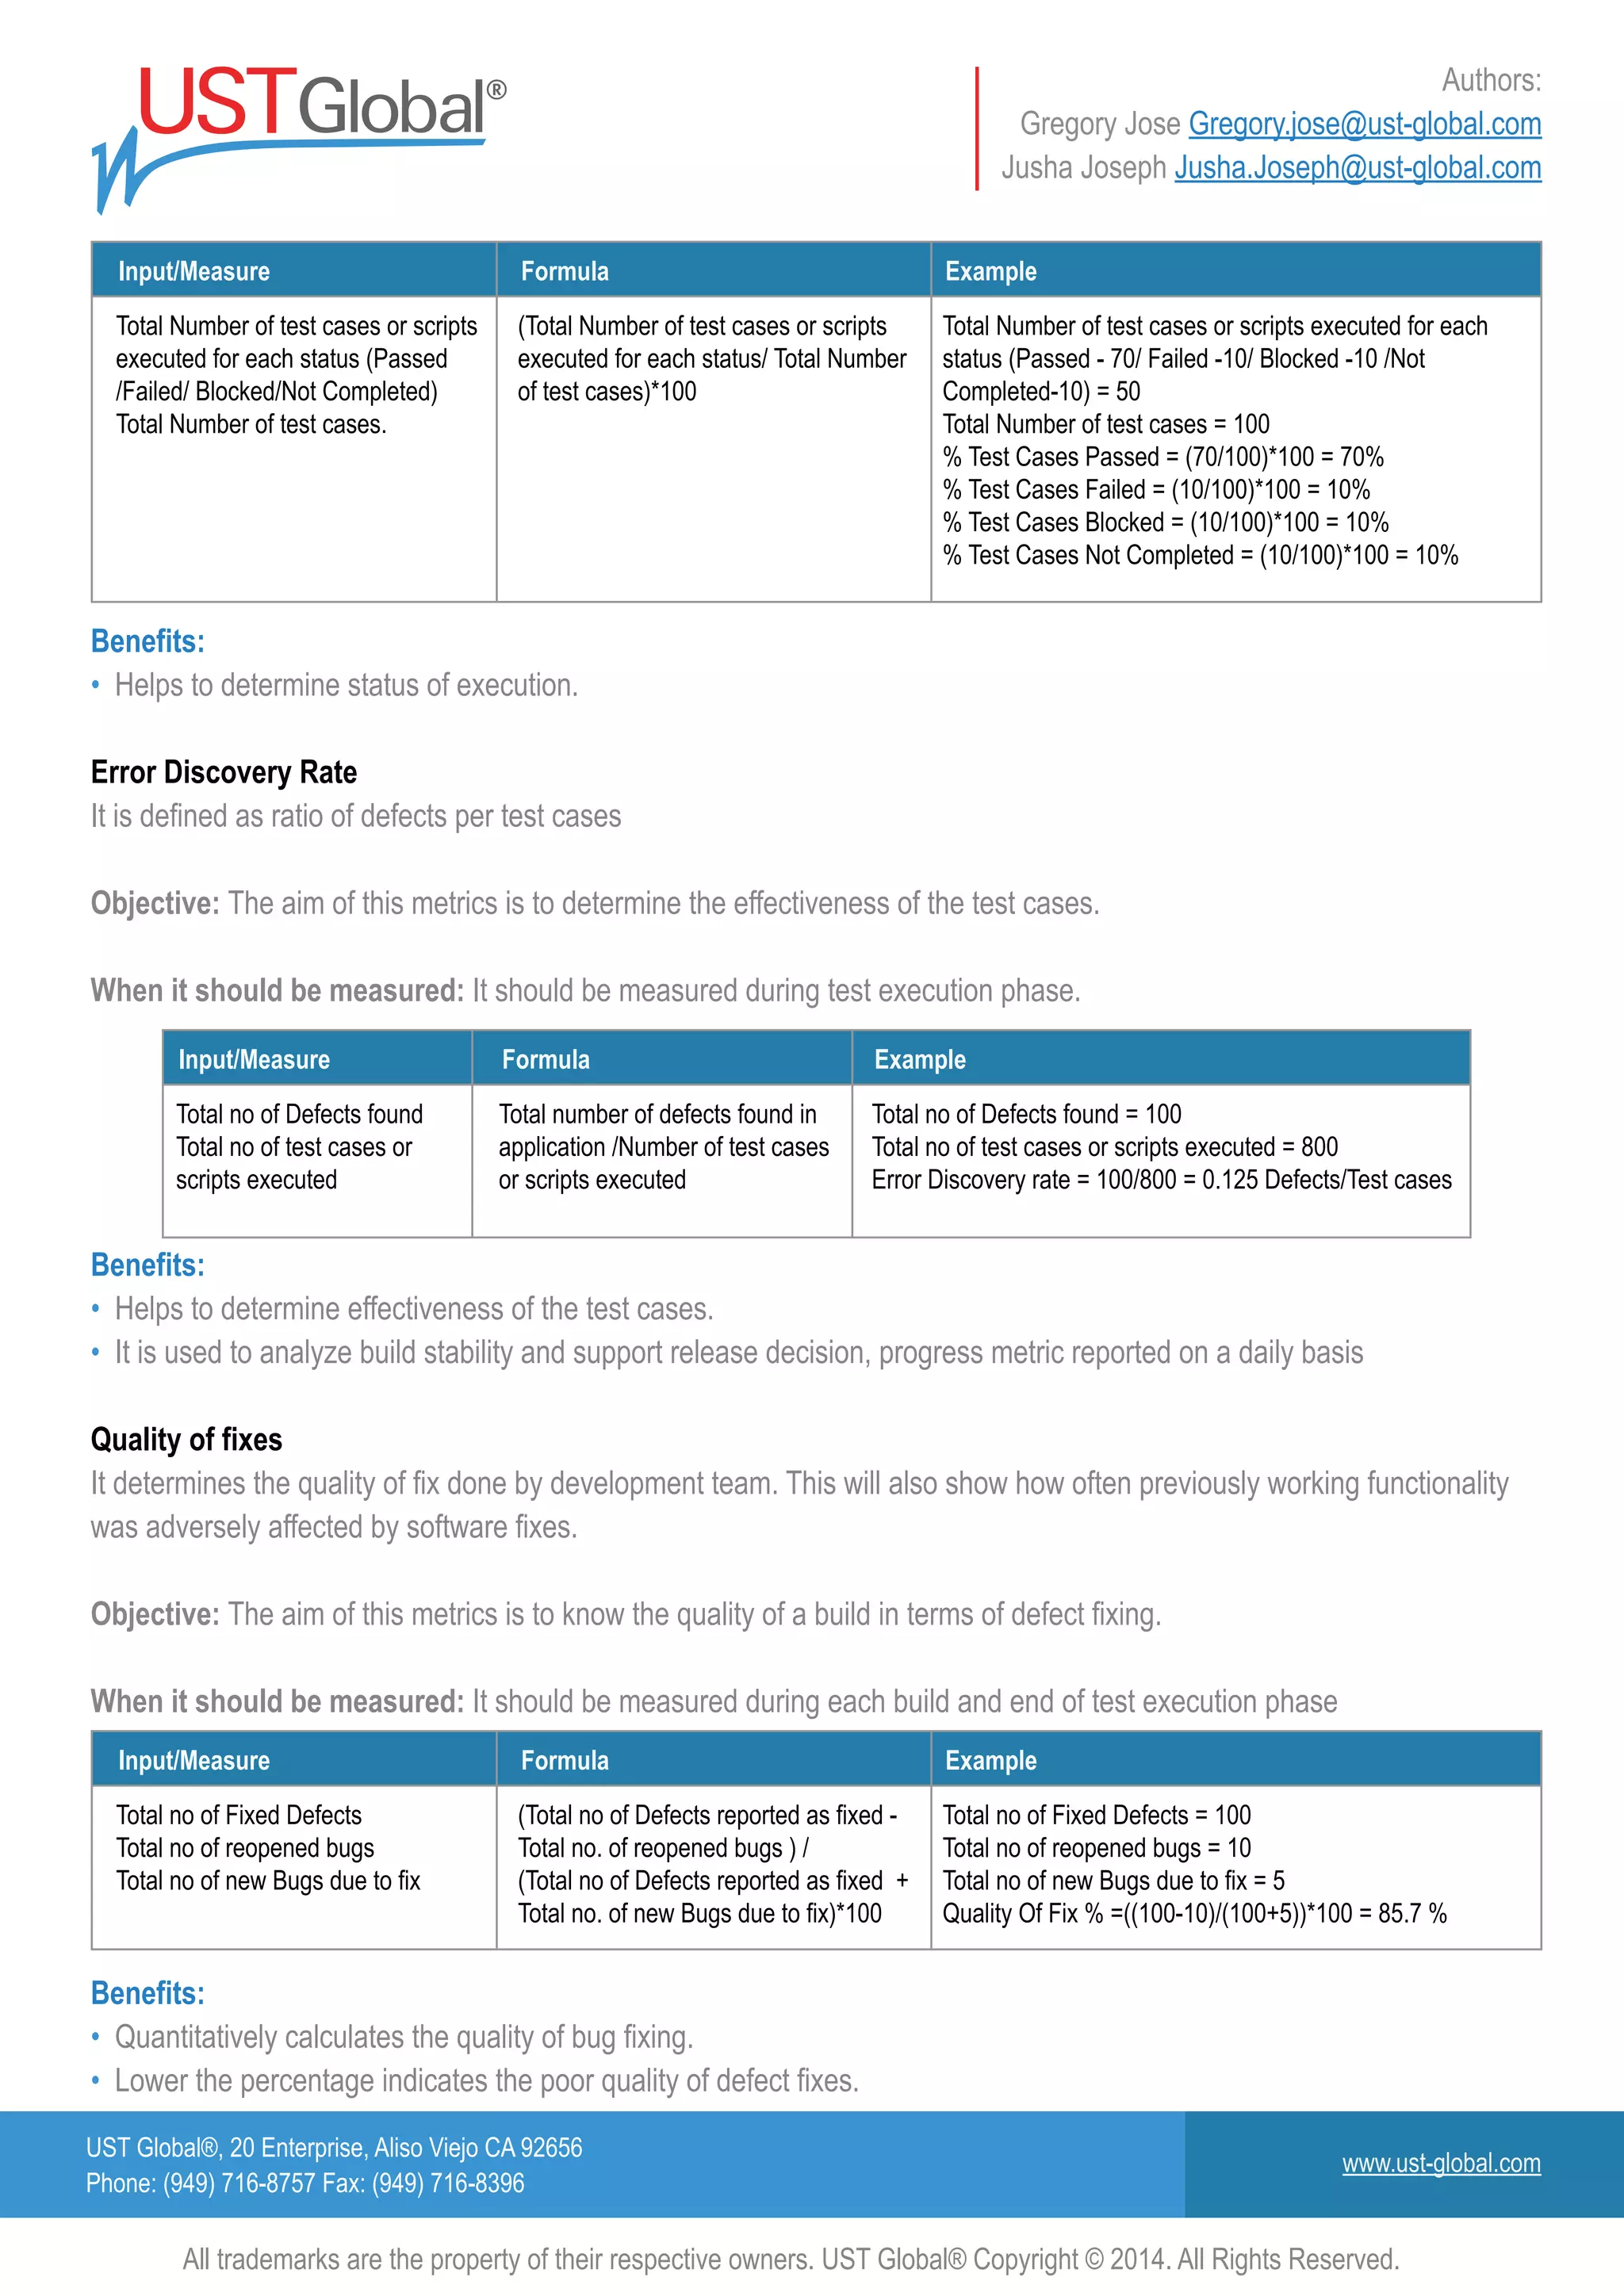
Input/Measure
Total No. of Initial
Requirements
Total No. of Missed
Requirements
(No. of Missed Requirements)/
(Total No. of Initial Requirements) *100
Total No. of Initial Requirements = 50
Total No. of Missed Requirements = 2
RLI = (2/50)*100 = 4
Formula Example
Input/Measure
Number of Review defects
Total number of Testing
Defects including customer
reported test defects
(Number of Review defects) / (Total
number of Review + Testing Defects
[including customer reported test
defects])*100
Number of Review defects = 10
Total number of Testing Defects including customer
reported test defects = 100
Review Efficiency% = (10/110)*100 = 9.09
Formula Example
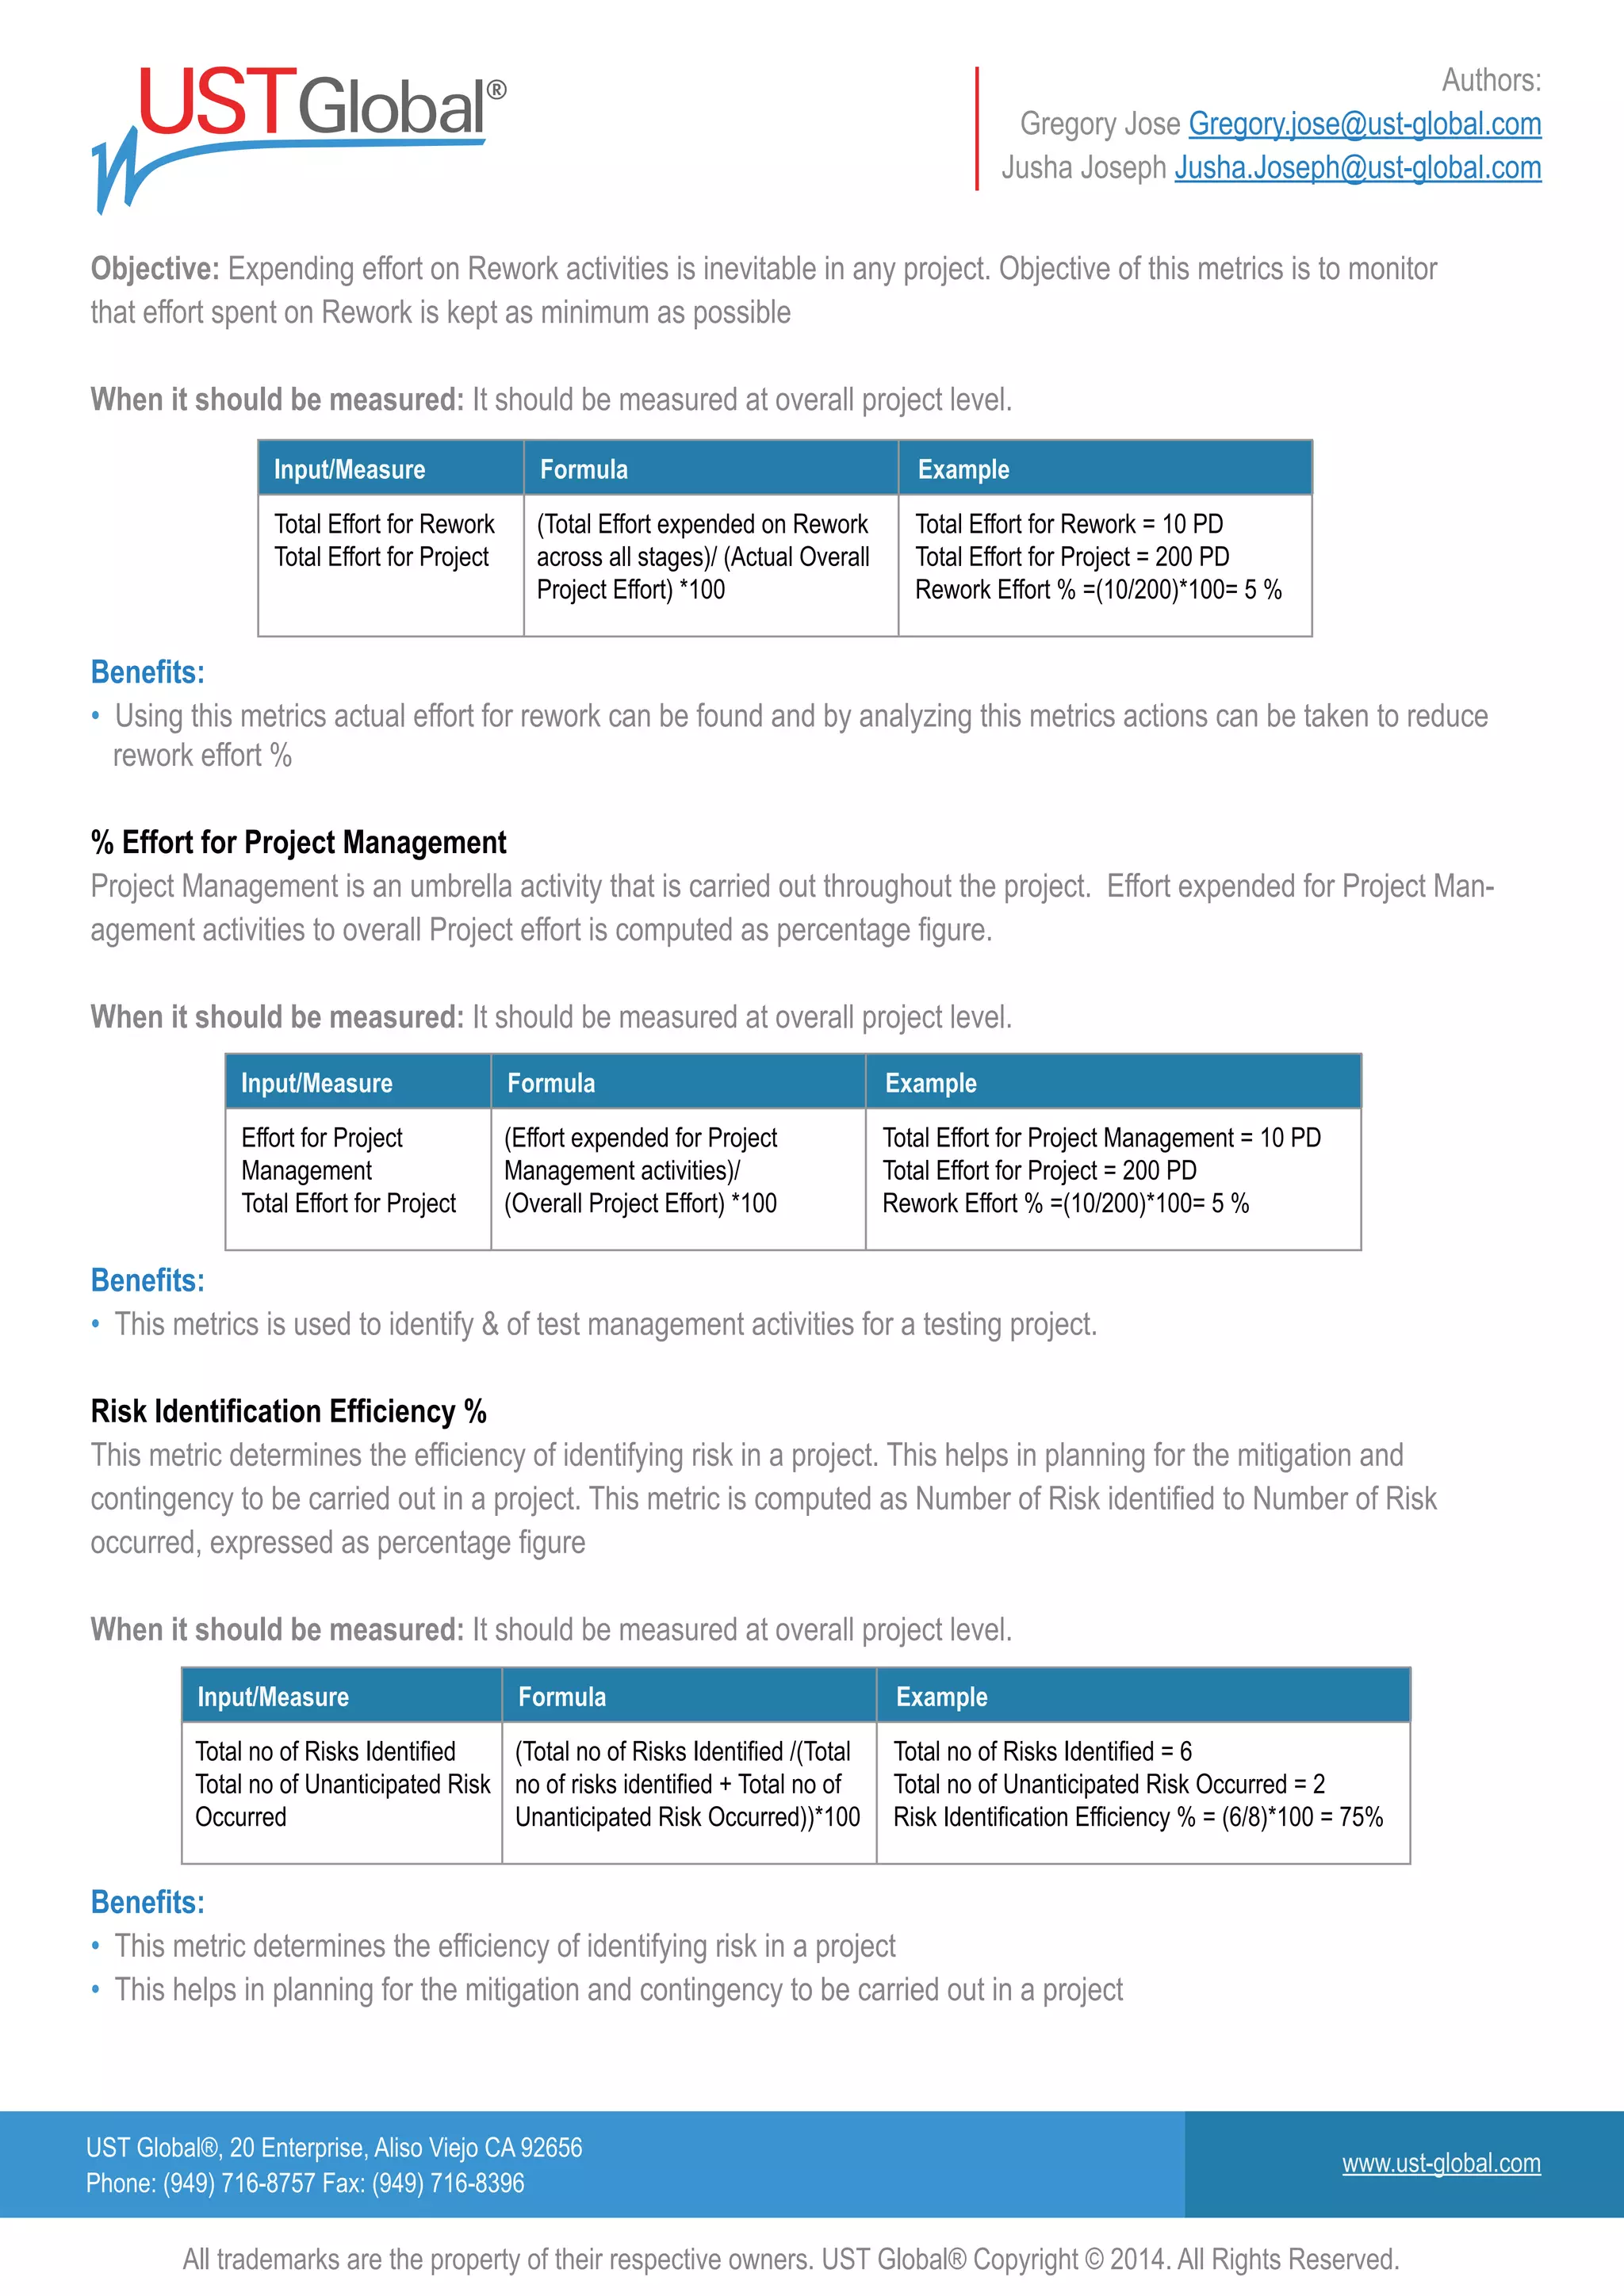
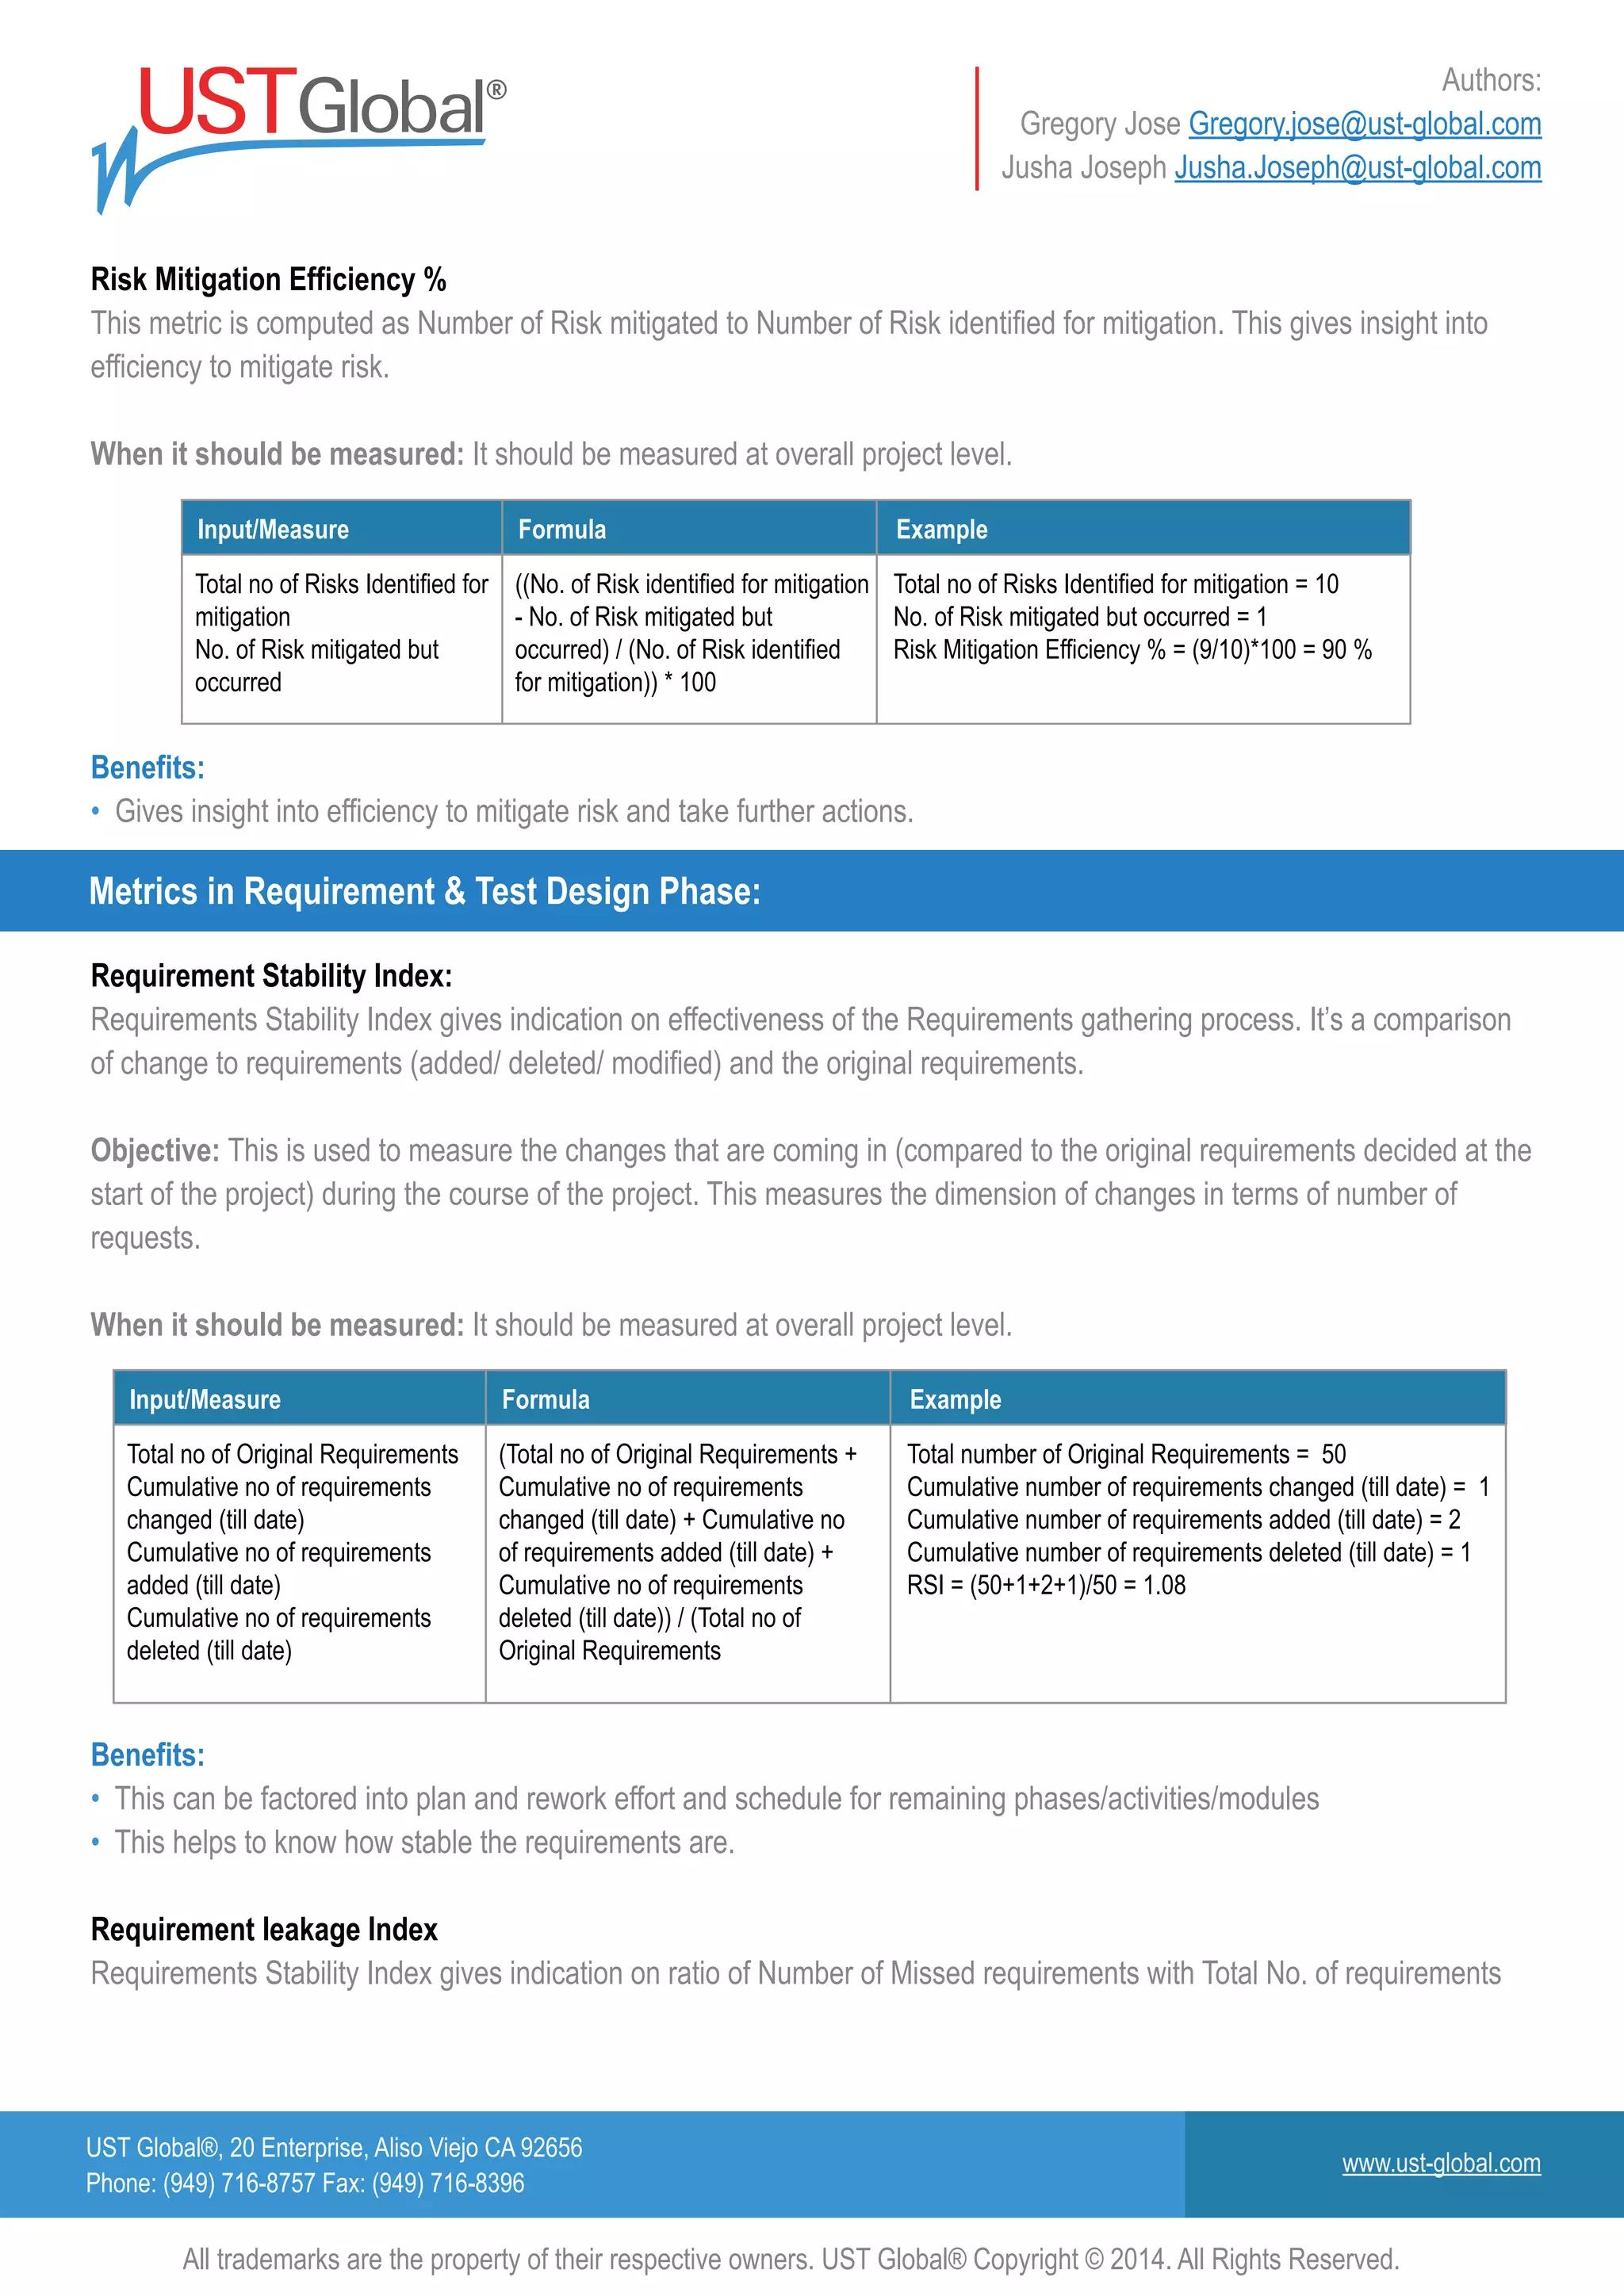
Objective: Requirements Leakage Index gives indication on effectiveness of the Requirements elicitation process.
Requirements Leakage index is given by Number of Missed Requirements to Number of Total Requirements, expressed
as percentage figure. Here the missed requirements are those that were missed by the Project team during Requirements
Elicitation process
When it should be measured: It should be measured at overall project level.
Benefits:
• This helps to know effectiveness of the Requirements elicitation process.
Review Efficiency
It’s the ratio of number of review defects to total defects in software (review and testing)
Objective: This metric shows the efficiency of the review process. A higher ratio of Review Defects to Total Defects
indicates a very efficient Review Process. However, a lower ratio need not necessarily mean that the review is
inadequate. This may be due to frequent changes in scope, requirements etc. Typically, the review defects include all
reviews, starting from the Requirements Stage. All review comments that arise from the review of Code/unit / integration /
system test plans / procedures / cases shall be counted under Review defects. The total number of Defects includes all
the defects found in reviews and testing.
When it should be measured: It should be measured at overall project level and stage level.
Benefits:
• This helps to know effectiveness of the reviews performed and to improve the review process.
• Increase in review efficiency decrease the defect leakage to next stage.
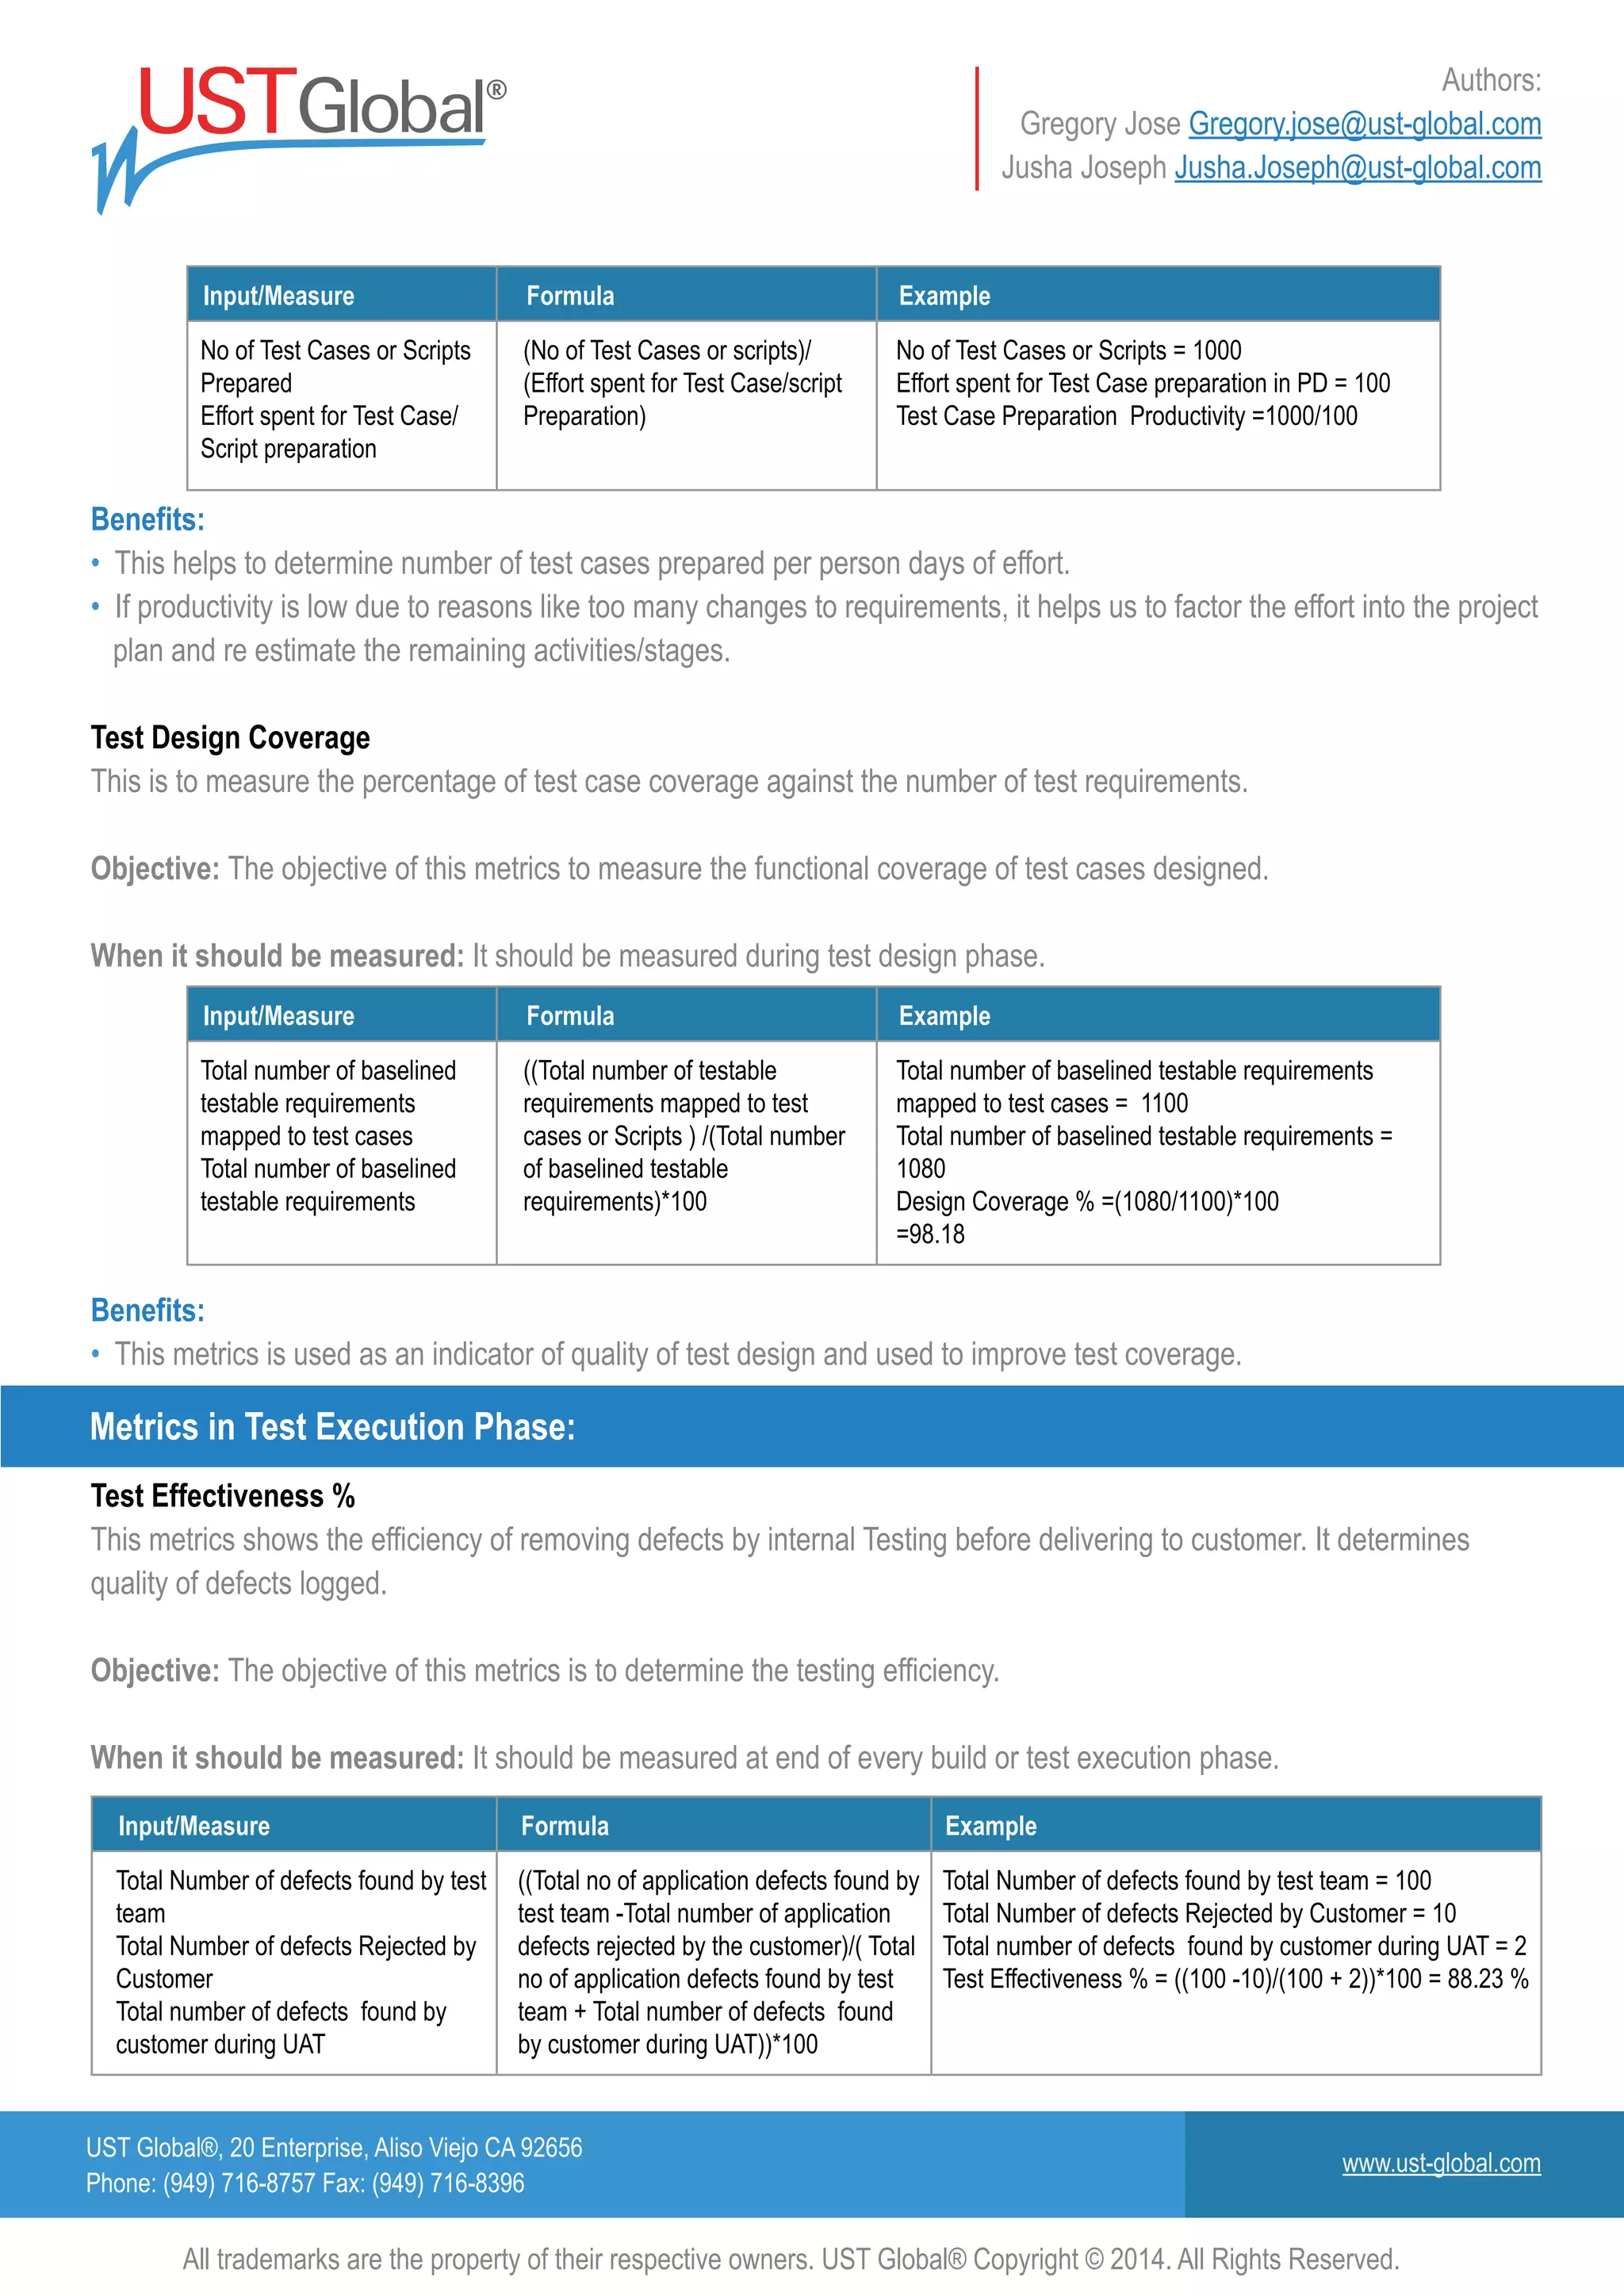
Test Case Preparation Productivity
It determines the number of Test cases / Scripts that can be prepared per person days of effort.
Objective: To determine the test design productivity based on which future estimation can be done for the similar projects
When it should be measured: It should be measured during test design phase](https://image.slidesharecdn.com/testmetricsandkpis-160623084054/75/Test-Metrics-and-KPIs-9-2048.jpg)

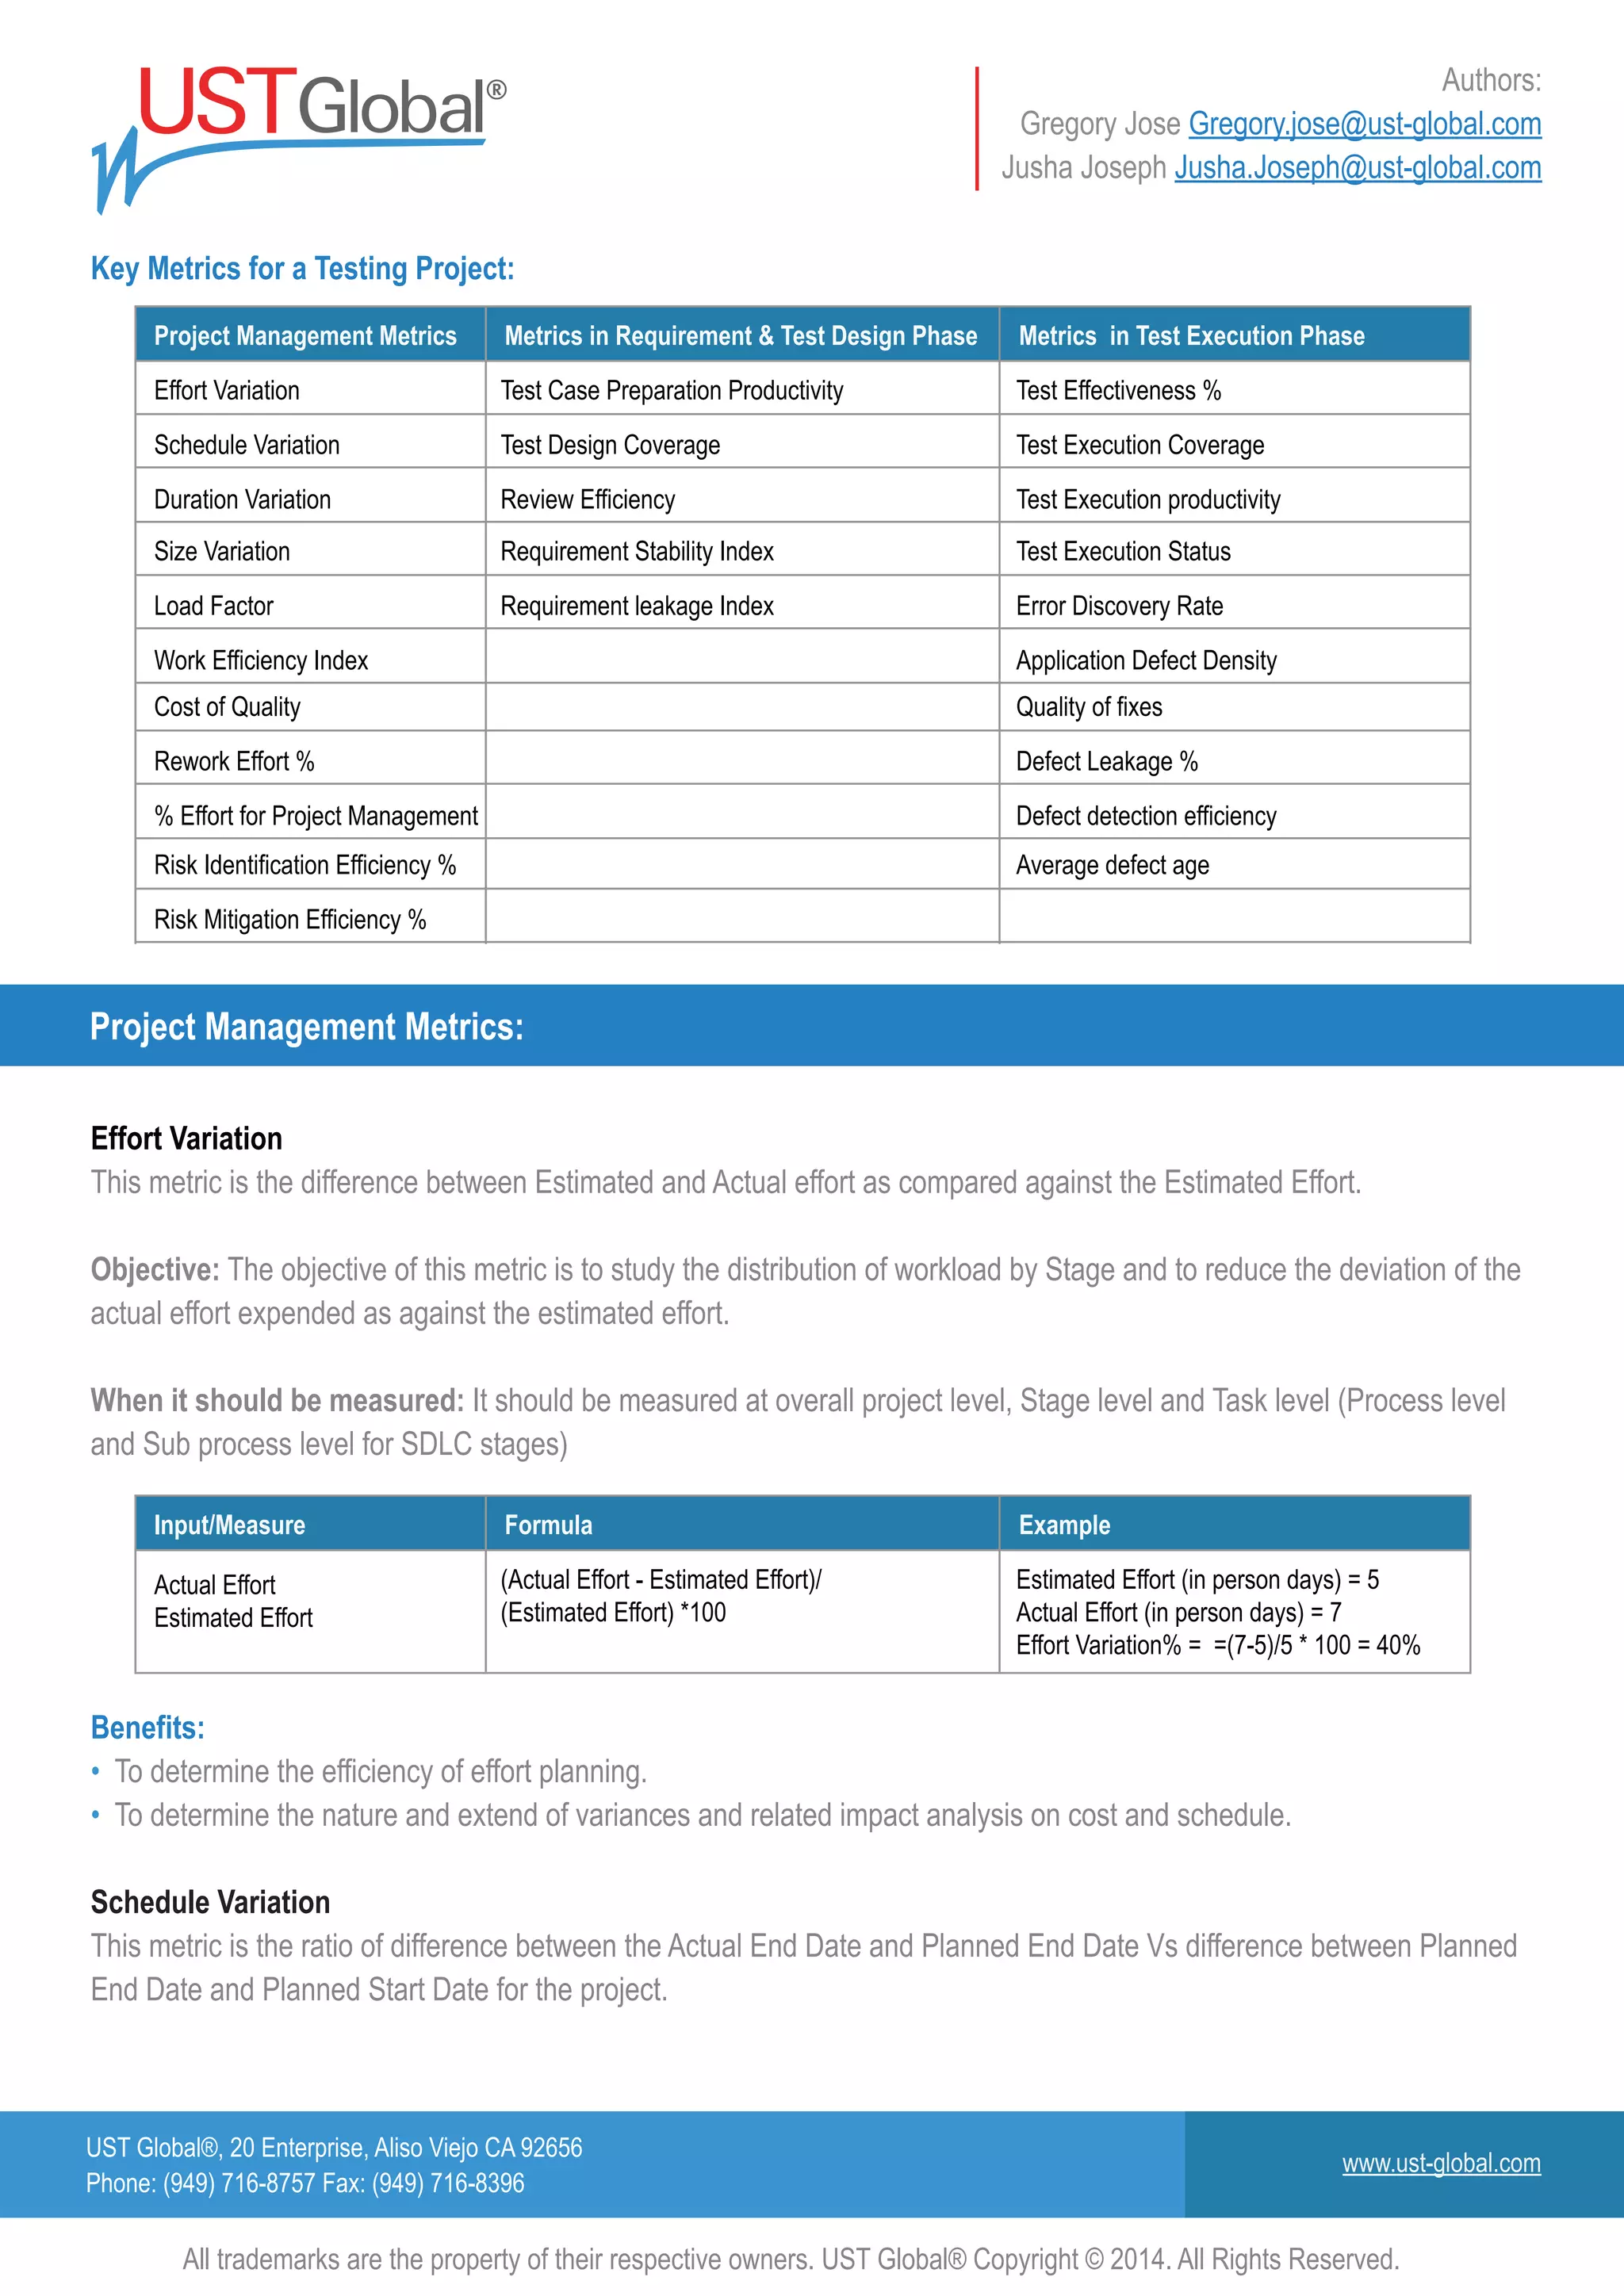
The document provides a comprehensive guideline for understanding software testing metrics and key performance indicators (KPIs) relevant to testing projects. It emphasizes the importance of defining and capturing metrics to assess testing progress, quality, and overall project success, detailing various metrics and their applications such as effort variation, schedule variation, and cost of quality. It also outlines the benefits of using these metrics to improve decision-making, resource allocation, and ultimately customer satisfaction.


![[Mush Honda] Metrics & Reports from Test Teams (QA)](https://cdn.slidesharecdn.com/ss_thumbnails/mushhondametricsreportsfromtestteamsqa-140717230106-phpapp02-thumbnail.jpg?width=640&height=640&fit=bounds)