Download to read offline

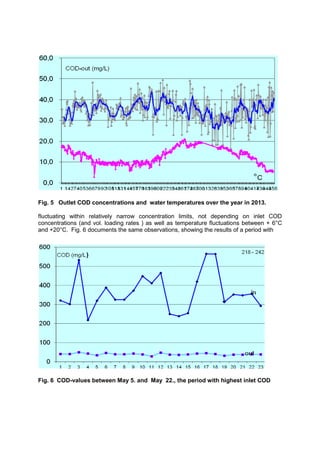
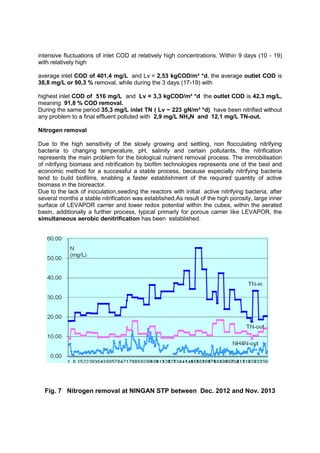


Levapor GmbH's biofilm technology has been successfully implemented in the Ningan sewage treatment plant, treating 22,000 m3/day of wastewater in a cold climate. The plant has shown high efficiency in chemical oxygen demand (COD) and nitrogen removal, achieving up to 91.8% COD removal and stable nitrification despite seasonal temperature fluctuations. The results demonstrate the effectiveness of biofilm technology in maintaining stable operations with significantly lower capital and operational costs.


