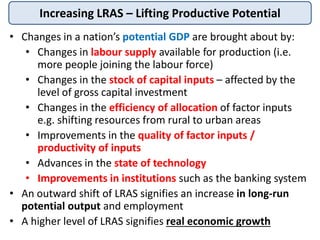
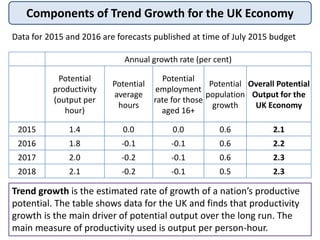
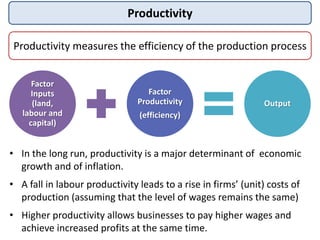
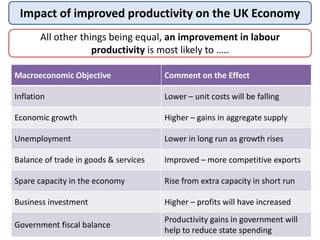
Long Run Aggregate Supply
EdExcel AS Economics 2.3.3
• Changes in a nation’s potential GDP are brought about by:
• Changes in labour supply available for production (i.e.
more people joining the labour force)
• Changes in the stock of capital inputs – affected by the
level of gross capital investment
• Changes in the efficiency of allocation of factor inputs
e.g. shifting resources from rural to urban areas
• Improvements in the quality of factor inputs /
productivity of inputs
• Advances in the state of technology
• Improvements in institutions such as the banking system
• An outward shift of LRAS signifies an increase in long-run
potential output and employment
• A higher level of LRAS signifies real economic growth
Increasing LRAS – Lifting Productive Potential
Components of Trend Growth for the UK Economy
Data for 2015 and 2016 are forecasts published at time of July 2015 budget
Annual growth rate (per cent)
Potential
productivity
(output per
hour)
Potential
average
hours
Potential
employment
rate for those
aged 16+
Potential
population
growth
Overall Potential
Output for the
UK Economy
2015 1.4 0.0 0.0 0.6 2.1
2016 1.8 -0.1 -0.1 0.6 2.2
2017 2.0 -0.2 -0.1 0.6 2.3
2018 2.1 -0.2 -0.1 0.5 2.3
Trend growth is the estimated rate of growth of a nation’s productive
potential. The table shows data for the UK and finds that productivity
growth is the main driver of potential output over the long run. The
main measure of productivity used is output per person-hour.
Key Factors affecting Long-Run Aggregate Supply
Higher Productivity
of Labour and
Capital
I.e. a rise in output
per person
employed or
increased efficiency
of technology
Increased Labour
Market
Participation
i.e. A growing
labour supply and a
rise in the number
of people in paid
work
Gains from
Innovation and
Enterprise
These are two key
factors that
determine
competitiveness
especially in
international
markets
Capital Investment
Including capital
spending by
businesses, inward
investment from
overseas (FDI) and
the Public Sector
(Government)
Productivity
Productivity measures the efficiency of the production process
• In the long run, productivity is a major determinant of economic
growth and of inflation.
• A fall in labour productivity leads to a rise in firms’ (unit) costs of
production (assuming that the level of wages remains the same)
• Higher productivity allows businesses to pay higher wages and
achieve increased profits at the same time.
Factor
Inputs
(land,
labour and
capital)
Factor
Productivity
(efficiency)
Output
Impact of improved productivity on the UK Economy
All other things being equal, an improvement in labour
productivity is most likely to …..
Macroeconomic Objective Comment on the Effect
Inflation Lower – unit costs will be falling
Economic growth Higher – gains in aggregate supply
Unemployment Lower in long run as growth rises
Balance of trade in goods & services Improved – more competitive exports
Spare capacity in the economy Rise from extra capacity in short run
Business investment Higher – profits will have increased
Government fiscal balance
Productivity gains in government will
help to reduce state spending
Explaining the non-linear AS curve
• When spare capacity is high then SRAS will be elastic
• A rise in AD can be met easily by increased output
• There is little threat of rising prices (inflation)
• The elasticity of SRAS curve falls as output increases
• The amount of spare capacity declines
• Possibility of diminishing returns in production
• Bottlenecks in supply of inputs and components
• Resource shortages as the economy approaches full
employment e.g. Skilled labour becomes more scarce
• When SRAS becomes perfectly inelastic the economy is at
full capacity (equivalent to being on the PPF boundary)
• Further increases in AD at this point are purely
inflationary in the short run with little extra real output
Keynesian Non-Linear Aggregate Supply Curve
General
Price Level
Real GDP
AS
AD1 AD2
AD3
AD4
AD5
Non-inflationary growth
An outward shift in AD
from AD1 to AD2 can be
met without an increase
in the price level
because short run
aggregate supply is
highly elastic
GPL1
Y1Y2
Keynesian Non-Linear Aggregate Supply Curve
General
Price Level
Real GDP
AS
AD1 AD2
AD3
AD4
AD5
Inflationary pressures
An outward shift in AD
from AD3 to AD4 causes
a sharp rise in the
general price level
because AS is inelastic
(i.e. output is close to
full-capacity levels)
GPL4
Y3 Y4
GPL5
Keynesian Non-Linear Aggregate Supply Curve
General
Price Level
Real GDP
AS
AD
When the AS curve become vertical,
the economy has reached full-
employment of factor resources.
Full employment is defined as a
state of the labour market in which
everyone who is willing and able to
work at the current wage rate is in
employment, excluding those who
are frictionally unemployed
YFE
GPL
Keynesian AS Curve and Negative Output Gap
General
Price Level
Real GDP
AS
AD
YFE is full employment and at Y1, the economy
is operating below full employment so it is
experiencing a negative output gap
YFE
GPL
AD1
Y1
Long Run Aggregate Supply
EdExcel AS Economics 2.3.3

Long run aggregate_supply

  • 1.
    Long Run AggregateSupply EdExcel AS Economics 2.3.3
  • 2.
    • Changes ina nation’s potential GDP are brought about by: • Changes in labour supply available for production (i.e. more people joining the labour force) • Changes in the stock of capital inputs – affected by the level of gross capital investment • Changes in the efficiency of allocation of factor inputs e.g. shifting resources from rural to urban areas • Improvements in the quality of factor inputs / productivity of inputs • Advances in the state of technology • Improvements in institutions such as the banking system • An outward shift of LRAS signifies an increase in long-run potential output and employment • A higher level of LRAS signifies real economic growth Increasing LRAS – Lifting Productive Potential
  • 3.
    Components of TrendGrowth for the UK Economy Data for 2015 and 2016 are forecasts published at time of July 2015 budget Annual growth rate (per cent) Potential productivity (output per hour) Potential average hours Potential employment rate for those aged 16+ Potential population growth Overall Potential Output for the UK Economy 2015 1.4 0.0 0.0 0.6 2.1 2016 1.8 -0.1 -0.1 0.6 2.2 2017 2.0 -0.2 -0.1 0.6 2.3 2018 2.1 -0.2 -0.1 0.5 2.3 Trend growth is the estimated rate of growth of a nation’s productive potential. The table shows data for the UK and finds that productivity growth is the main driver of potential output over the long run. The main measure of productivity used is output per person-hour.
  • 4.
    Key Factors affectingLong-Run Aggregate Supply Higher Productivity of Labour and Capital I.e. a rise in output per person employed or increased efficiency of technology Increased Labour Market Participation i.e. A growing labour supply and a rise in the number of people in paid work Gains from Innovation and Enterprise These are two key factors that determine competitiveness especially in international markets Capital Investment Including capital spending by businesses, inward investment from overseas (FDI) and the Public Sector (Government)
  • 5.
    Productivity Productivity measures theefficiency of the production process • In the long run, productivity is a major determinant of economic growth and of inflation. • A fall in labour productivity leads to a rise in firms’ (unit) costs of production (assuming that the level of wages remains the same) • Higher productivity allows businesses to pay higher wages and achieve increased profits at the same time. Factor Inputs (land, labour and capital) Factor Productivity (efficiency) Output
  • 6.
    Impact of improvedproductivity on the UK Economy All other things being equal, an improvement in labour productivity is most likely to ….. Macroeconomic Objective Comment on the Effect Inflation Lower – unit costs will be falling Economic growth Higher – gains in aggregate supply Unemployment Lower in long run as growth rises Balance of trade in goods & services Improved – more competitive exports Spare capacity in the economy Rise from extra capacity in short run Business investment Higher – profits will have increased Government fiscal balance Productivity gains in government will help to reduce state spending
  • 7.
    Explaining the non-linearAS curve • When spare capacity is high then SRAS will be elastic • A rise in AD can be met easily by increased output • There is little threat of rising prices (inflation) • The elasticity of SRAS curve falls as output increases • The amount of spare capacity declines • Possibility of diminishing returns in production • Bottlenecks in supply of inputs and components • Resource shortages as the economy approaches full employment e.g. Skilled labour becomes more scarce • When SRAS becomes perfectly inelastic the economy is at full capacity (equivalent to being on the PPF boundary) • Further increases in AD at this point are purely inflationary in the short run with little extra real output
  • 8.
    Keynesian Non-Linear AggregateSupply Curve General Price Level Real GDP AS AD1 AD2 AD3 AD4 AD5 Non-inflationary growth An outward shift in AD from AD1 to AD2 can be met without an increase in the price level because short run aggregate supply is highly elastic GPL1 Y1Y2
  • 9.
    Keynesian Non-Linear AggregateSupply Curve General Price Level Real GDP AS AD1 AD2 AD3 AD4 AD5 Inflationary pressures An outward shift in AD from AD3 to AD4 causes a sharp rise in the general price level because AS is inelastic (i.e. output is close to full-capacity levels) GPL4 Y3 Y4 GPL5
  • 10.
    Keynesian Non-Linear AggregateSupply Curve General Price Level Real GDP AS AD When the AS curve become vertical, the economy has reached full- employment of factor resources. Full employment is defined as a state of the labour market in which everyone who is willing and able to work at the current wage rate is in employment, excluding those who are frictionally unemployed YFE GPL
  • 11.
    Keynesian AS Curveand Negative Output Gap General Price Level Real GDP AS AD YFE is full employment and at Y1, the economy is operating below full employment so it is experiencing a negative output gap YFE GPL AD1 Y1
  • 12.
    Long Run AggregateSupply EdExcel AS Economics 2.3.3