


![7© 2010-15 SysPlay Workshops <workshop@sysplay.in>
All Rights Reserved.
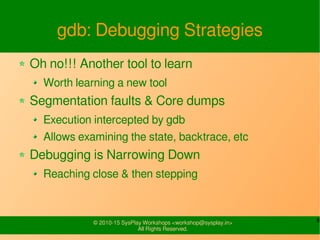
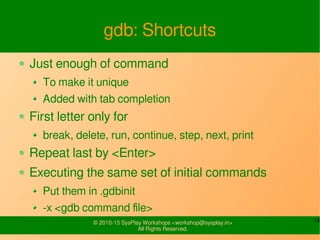
'gdb' Usage
Compile with -g option
gcc -g file.c -o file
Run gdb (with desired options)
gdb [options] ./file [core file]
Pass command line arguments by setting args
set args <cmd_line_args>
Run the program by
Typing c, or
run <cmd_line_args>
For debugging: break, watch, backtrace, …
For help: help <command>](https://image.slidesharecdn.com/debuggingnprofiling-101013115007-phpapp01/85/Linux-User-Space-Debugging-Profiling-7-320.jpg)
![8© 2010-15 SysPlay Workshops <workshop@sysplay.in>
All Rights Reserved.
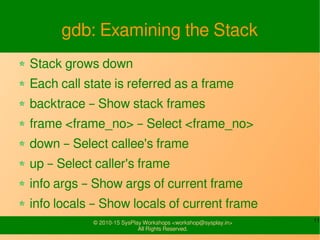
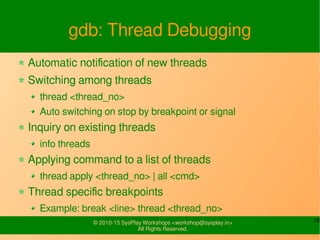
gdb: Examining Source Files
list <line>
Print 10 lines around <line>
list [<filename>:]<function>
Print 10 lines around beginning of <function>
list <start>,<end>
Print lines from <start> to <end>
list
Print 10 more lines](https://image.slidesharecdn.com/debuggingnprofiling-101013115007-phpapp01/85/Linux-User-Space-Debugging-Profiling-8-320.jpg)
![9© 2010-15 SysPlay Workshops <workshop@sysplay.in>
All Rights Reserved.
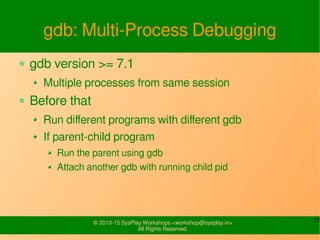
gdb: Other ways of Running
step [ count ] – step into sub-routines
next – run over sub-routines in a go
finish – run till current function returns
return – make selected stack frame return to its
caller
jump <address> – continue program at specified
line or address](https://image.slidesharecdn.com/debuggingnprofiling-101013115007-phpapp01/85/Linux-User-Space-Debugging-Profiling-9-320.jpg)
![10© 2010-15 SysPlay Workshops <workshop@sysplay.in>
All Rights Reserved.
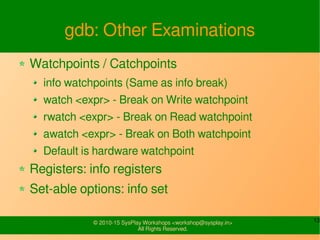
gdb: Breakpoints
info break – Show list & status of breakpoints
Setting breakpoints (returns its number)
[t]break <function> [ if <expr> ]
[t]break [<file>:]<line>
Breakpoint Operations
disable <break_no>
enable <break_no>
delete <break_no>
commands <break_no>
Execute gdb commands on reaching <break_no>](https://image.slidesharecdn.com/debuggingnprofiling-101013115007-phpapp01/85/Linux-User-Space-Debugging-Profiling-10-320.jpg)
![12© 2010-15 SysPlay Workshops <workshop@sysplay.in>
All Rights Reserved.
gdb: Examining Data
print[/xduotcf] <expr>
Evaluate the valid C <expr> within current frame
set variable <var> = <expr>
Assign <expr> to <var> in the current scope
Variables starting with $ are local to gdb
display <expr>
Print <expr> whenever program stops
undisplay
Cancels all previous display requests](https://image.slidesharecdn.com/debuggingnprofiling-101013115007-phpapp01/85/Linux-User-Space-Debugging-Profiling-12-320.jpg)
![15© 2010-15 SysPlay Workshops <workshop@sysplay.in>
All Rights Reserved.
gdb: Miscellaneous
Set editmode for gdb command line
editmode [ emacs | vi | dumb ]
Execute a shell command
shell <cmd>
Print command history
history
Set logging
set logging <on | off>
set logging file <log_file> (Default: gdb.txt)](https://image.slidesharecdn.com/debuggingnprofiling-101013115007-phpapp01/85/Linux-User-Space-Debugging-Profiling-15-320.jpg)

![25© 2010-15 SysPlay Workshops <workshop@sysplay.in>
All Rights Reserved.
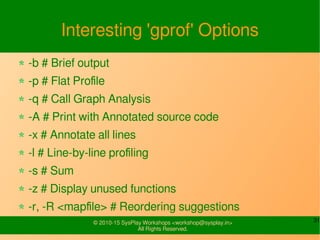
'splint' Usage
Run splint (with desired options)
splint [options] file[.c]
Prints out all the messages about the file
On standard output
Errors on standard error (using -usestderr)
Some interesting options
-weak for lesser messages
-I <incl_dirs>
Try 'splint splint_cprog'](https://image.slidesharecdn.com/debuggingnprofiling-101013115007-phpapp01/85/Linux-User-Space-Debugging-Profiling-25-320.jpg)
![28© 2010-15 SysPlay Workshops <workshop@sysplay.in>
All Rights Reserved.
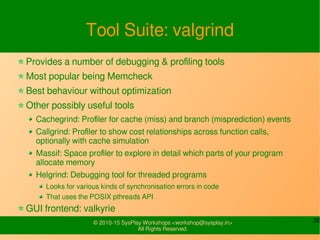
'gcov' Usage
Compile with -fprofile-arcs -ftest-coverage options
gcc -fprofile-arcs -ftest-coverage file.c -o file
Execute the program with the test vectors
./file [ <cmd_line_args> ]
Generates .gcda (Data) & .gcno (Graph) files
Run gcov (with desired options)
gcov [options] file.c
Interesting options: --all-blocks --branch-probabilities
Generates coverage output in .gcov file
Try with gcov_cprog.c](https://image.slidesharecdn.com/debuggingnprofiling-101013115007-phpapp01/85/Linux-User-Space-Debugging-Profiling-28-320.jpg)
![30© 2010-15 SysPlay Workshops <workshop@sysplay.in>
All Rights Reserved.
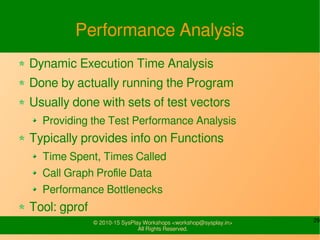
'gprof' Usage
Compile with -pg option
gcc -pg file.c -o file
Run the program
./file [ <cmd_line_args> ]
Generates gmon.out file
Run gprof (with desired options)
gprof [options] ./file [gmon.out]
Dumps profiling info on stdout
Try with gprof_cprog.c](https://image.slidesharecdn.com/debuggingnprofiling-101013115007-phpapp01/85/Linux-User-Space-Debugging-Profiling-30-320.jpg)
![34© 2010-15 SysPlay Workshops <workshop@sysplay.in>
All Rights Reserved.
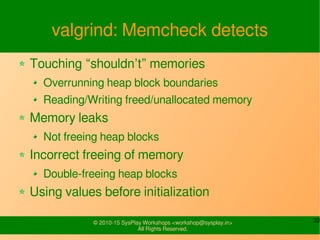
'valgrind' Usage
Compile with -g option
gcc -g file.c -o file
Run using valgrind & desired options
valgrind [options] ./file [ <cmd_line_args> ]
By default, runs Memcheck
Profiles out the memory usage of the program
For using other tools of valgrind, add
--tool=<toolname>
Try with valgrind_cprog.c](https://image.slidesharecdn.com/debuggingnprofiling-101013115007-phpapp01/85/Linux-User-Space-Debugging-Profiling-34-320.jpg)


The document discusses various debugging and profiling techniques for C programs, focusing on the use of the gdb debugger to debug programs by setting breakpoints, examining data and stack frames, and the use of profiling tools like gprof and gcov to analyze program performance and code coverage.


![Getting Started with Apache Spark: Big Data Made Simple [Free Meetup]](https://cdn.slidesharecdn.com/ss_thumbnails/apachesparkgettingstarted-260203175547-8361bcc3-thumbnail.jpg?width=640&height=640&fit=bounds)


