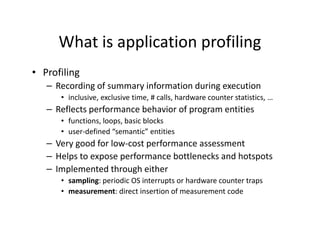
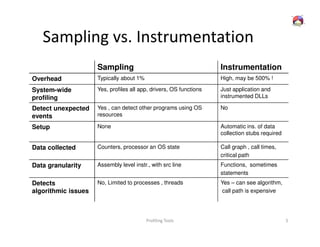
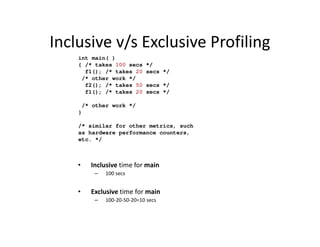
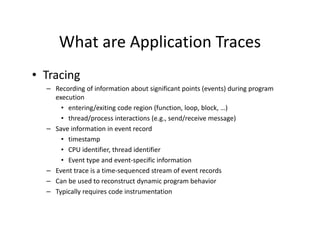
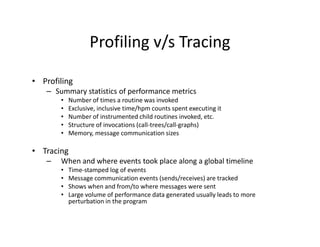
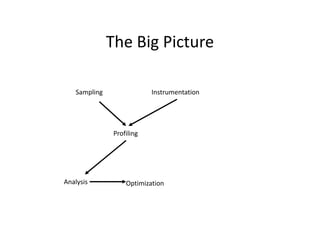
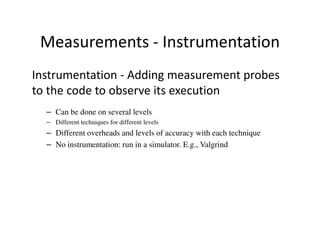
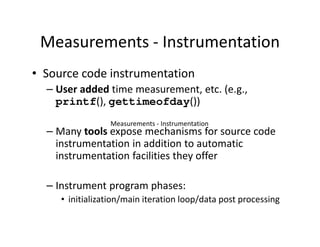
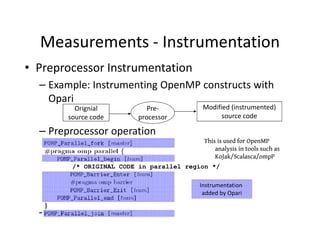
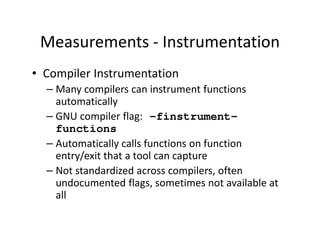
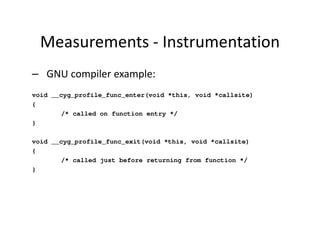
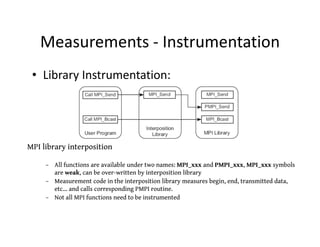
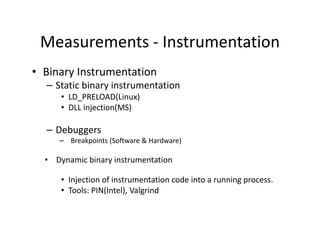
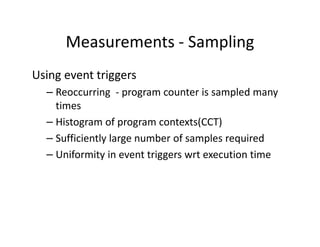
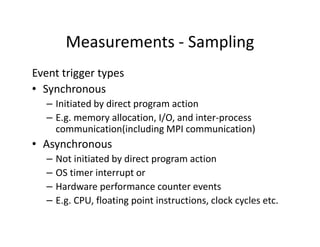
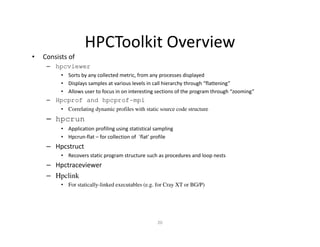
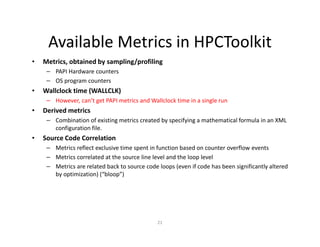
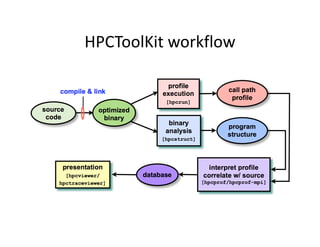
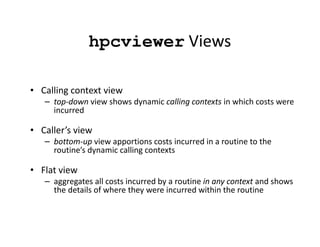
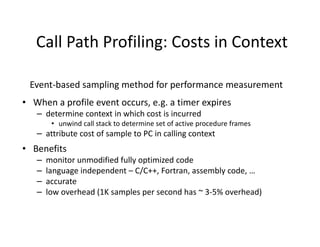
This document discusses application profiling and analysis. Profiling involves recording summary information during program execution to reflect performance behavior. It can expose bottlenecks and hotspots with low overhead. Profiling is implemented via sampling, which uses periodic interrupts, or instrumentation, which directly inserts measurement code. Tracing records significant execution points to reconstruct program behavior. Profiling provides summary statistics while tracing generates a large volume of event data. Tools like HPCToolkit use sampling and instrumentation to collect metrics that are correlated back to source code to analyze performance.
Think network forensics is just for security? Not with today’s 10G (and tomorrow’s 40G/100G) traffic, not to mention new 802.11ac wireless networks with multi-gigabit data rates. Data is traversing these networks so quickly that detailed, real-time analysis is at best a challenge. Network forensics provides key real-time statistics while saving a complete, packet-level recording of all network activity. You don’t need to worry about capturing the problem – your network forensics solution already has, allowing you to go back in time and analyze any network, application, or security condition.
Forensic science is a scientific method of gathering and examining information about the past which is then used in the court of law. Digital Forensics is the use of scientifically derived and proven methods toward the preservation, collection, validation, identification, analysis, interpretation, documentation, and presentation of digital evidence derived from digital devices for the purpose of facilitation or furthering the reconstruction of events found to be criminal, or helping to anticipate unauthorized actions shown to be disruptive to planned operations.
HPC Best Practices: Application Performance Optimizationinside-BigData.com
Pak Lui from the HPC Advisory Council presented this deck at the Switzerland HPC Conference.
"To achieve good scalability performance on the HPC scientific applications typically involves good understanding of the workload though performing profile analysis, and comparing behaviors of using different hardware which pinpoint bottlenecks in different areas of the HPC cluster. In this session, a selection of HPC applications will be shown to demonstrate various methods of profiling and analysis to determine the bottleneck, and the effectiveness of the tuning to improve on the application performance."
Watch the video presentation: http://wp.me/p3RLHQ-f8h
Learn more: http://www.hpcadvisorycouncil.com/best_practices.php
See more talks from the Switzerland HPC Conference:
http://insidehpc.com/2016-swiss-hpc-conference/
Sign up for our insideHPC Newsletter: http://insidehpc.com/newsletter
Presentation of "State of the Art of IoT Honeypots" technical report developed for the Seminar in Advanced Topics in Computer Science course of the Master Degree in Engineering in Computer Science curriculum in Cyber Security at University of Rome "La Sapienza".
Link: https://www.slideshare.net/secret/EfL8YbinRZjDPS
Module I
Introduction to Distributed systems - Examples of distributed systems, resource sharing and the web, challenges - System model - introduction - architectural models - fundamental models - Introduction to inter-process communications - API for Internet protocol - external data.
NFF-GO (YANFF) - Yet Another Network Function FrameworkMichelle Holley
NFF-Go is a framework allows developers to deploy performant cloud-native network functions much faster. NFF-Go internally implements low-level optimizations and can auto-scale to multicores using built-in capabilities to take advantage of Intel® architecture. NFF uses Data Plane Development Kit (DPDK) for efficient input/output (I/O) and Go programming language as a high-level, safe, productive language.
Resource Allocation In Software Project ManagementSyed Hassan Ali
Resource Allocation In Software Project Management
what is Resource Allocation In Software Project Management
define Resource Allocation In Software Project Management
how to allocate resource in software project management
This chapter describes how to conduct a digital forensics investigation. It shows the possible relation between information Security Triad and the investigation Triad. the chapter presents how to conduct an interview during investigations, and the disposition to take for adequate recording. The bit-by-bit stream copy process is mentioned. Disposition to take when finalizing the investigation is also discussed.
Monitorama 2015 talk by Brendan Gregg, Netflix. With our large and ever-changing cloud environment, it can be vital to debug instance-level performance quickly. There are many instance monitoring solutions, but few come close to meeting our requirements, so we've been building our own and open sourcing them. In this talk, I will discuss our real-world requirements for instance-level analysis and monitoring: not just the metrics and features we desire, but the methodologies we'd like to apply. I will also cover the new and novel solutions we have been developing ourselves to meet these needs and desires, which include use of advanced Linux performance technologies (eg, ftrace, perf_events), and on-demand self-service analysis (Vector).
AADL: Architecture Analysis and Design LanguageIvano Malavolta
This presentation is about a lecture I gave within the "Software systems and services" immigration course at the Gran Sasso Science Institute, L'Aquila (Italy): http://cs.gssi.infn.it/.
http://www.ivanomalavolta.com
Quick overview on Visual Studio 2012 Profiler & Profiling tools : the importance of the profiling methods (sampling, instrumentation, memory, concurrency, … ), how to run a profiling session, how to profile unit test/load test, how to use API and a few samples
The differing ways to monitor and instrumentJonah Kowall
FullStack London July 15th, 2016
Monitoring is complicated, and in most organizations consists of far too many tools owned by many teams. These tools consist of monitoring tools each looking at a component myopically. These tools metrics and logs from devices and software emitting them. Increasingly modern companies are creating their own instrumentation, but there is a large base of generic instrumentation of software. Fixing monitoring issues requires people, process, and technology. In this talk we will cover many common issues seen in the real world. For example decisions on what should be monitored or collected from a technology and a business perspective. This requires process and coordination.
We will investigate what instrumentation is most scalable and effective across languages this includes the commonly used APIs and possibilities to capture data from common languages like Java, .NET and PHP, but we’ll also go into methods which work with Python, Node.js, and golang. We will cover browser and mobile instrumentation techniques. How these are done? which APIs are being used? What open source tools and frameworks can be leveraged? Most importantly how to coordinate and communicate requirements across your organization.
Attendees of this session will walk away with a clear understanding of:
What is instrumentation, and what do I instrument, collect, and store?
The understanding of overhead and how this can be accomplished on common software stacks?
How to work with application owners to collect business data.
How correlation works in custom open source or packaged monitoring tools.
MeetUp Monitoring with Prometheus and Grafana (September 2018)Lucas Jellema
This presentation introduces the concept of monitoring - focusing on why and how and finally on the tools to use. It introduces Prometheus (metrics gathering, processing, alerting), application instrumentation and Prometheus exporters and finally it introduces Grafana as a common companion for dashboarding, alerting and notifications. This presentations also introduces the handson workshop - for which materials are available from https://github.com/lucasjellema/monitoring-workshop-prometheus-grafana
TAU for Accelerating AI Applications at OpenPOWER Summit Europe OpenPOWERorg
Sameer Shende, director, Performance Research Laboratory, University of Oregon, presents TAU for Accelerating AI Applications at OpenPOWER Summit Europe 2018.
Monitoring and Instrumentation Strategies: Tips and Best Practices - AppSphere16AppDynamics
Monitoring is complicated, and in most organizations consists of far too many tools owned by too many teams. Fixing monitoring issues requires people, process, and technology. Hear common issues seen in the real world including what should be monitored or collected from a technology and a business perspective.
Investigate what instrumentation is most scalable and effective across languages, commonly used APIs, and possibilities for capturing data from common languages like Java, .NET, and PHP. Cover browser and mobile instrumentation techniques. Get tips on which APIs to use, what open source tools and frameworks can be leveraged, and how to coordinate and communicate requirements across your organization.
Key takeaways:
o What is instrumentation, and what to instrument, collect, and store
o How this can be accomplished on common software stacks
o How to work with application owners to collect business data
o How correlation works in custom open source or packaged monitoring tools
For more information, go to: www.appdynamics.com
Continuous Profiling in Production: What, Why and HowSadiq Jaffer
Everyone wants to understand what their application is really doing in production, but this information is normally invisible to developers. Profilers tell you what code your application is running but few developers profile and mostly on their development environments. Thankfully production profiling is now a practical reality that can help you solve and avoid performance problems.
Profiling in development can be problematic because it’s rare that you have a realistic workload or performance test for your system. Even if you’ve got accurate performance tests maintaining these and validating that they represent production systems is hugely time consuming and hard. Not only that but often the hardware and operating system that you run in production are different from your development environment.
This pragmatic talk will help you understand the ins and outs of profiling in a production system. You’ll learn about different techniques and approaches that help you understand what’s really happening with your system. This helps you to solve new performance problems, regressions and undertake capacity planning exercises.
Find out how profiling in production can uncover performance bottlenecks, aid scalability and reduce your costs.
Librato's Joseph Ruscio at Heroku's 2013: Instrumenting 12-Factor AppsHeroku
Librato's CTO Joseph Ruscio took to the Waza 2013 stage to present "Instrumenting Twelve-Factor Apps". For more from Ruscio ping him at @josephruscio. For more on Waza visit http://waza.heroku.com/2013.
For Waza videos stay tuned at http://blog.heroku.com or visit http://vimeo.com/herokuwaza
[CB16] COFI break – Breaking exploits with Processor trace and Practical cont...CODE BLUE
One of the most prevalent methods used by attackers to exploit vulnerabilities is ROP - Return Oriented Programming. Many times during the exploitation process, code will run very differently than it does usually - calls will be made to the middle of functions, functions won’t return to their callers, etc. These anomalies in control flow could be detected if a log of all instructions executed by the processor were available.
In the past, tracing the execution of a processor incurred a significant slowdown, rendering such an anti-exploitation method impractical. However, recent Intel processors, such as Broadwell and Skylake, are now able to trace execution with low overhead, via a feature called Processor Trace. A similar feature called CoreSight exists on new ARM processors.
The lecture will discuss an anti-exploitation system we built which scans files and detects control flow violations by using these new processor features.
--- Ron Shina
Ron has been staring at binary code for over the past decade, occasionally running it. Having spent a lot of his time doing mathematics, he enjoys searching for algorithmic opportunities in security research and reverse engineering. He is a graduate of the Israel Defense Forces’ Talpiot program. In his spare time he works on his jump shot.
--- Shlomi Oberman
Shlomi Oberman is an independent security researcher with over a decade of experience in security research. Shlomi spent many years in the attacker’s shoes for different companies and knows too well how hard it is to stop a determined attacker. In the past years his interest has shifted from breaking things to helping stop exploits – while software is written and after it has shipped. Shlomi is a veteran of the IDF Intelligence Corps and used to head the security research efforts at NSO Group and other companies.
Similar to HPC Application Profiling and Analysis (20)
2. What is application profiling
• Profiling
– Recording of summary information during execution
• inclusive, exclusive time, # calls, hardware counter statistics, …
– Reflects performance behavior of program entities
• functions, loops, basic blocks
• user-defined “semantic” entities
– Very good for low-cost performance assessment
– Helps to expose performance bottlenecks and hotspots
– Implemented through either
• sampling: periodic OS interrupts or hardware counter traps
• measurement: direct insertion of measurement code
3. Sampling vs. Instrumentation
Sampling Instrumentation
Overhead Typically about 1% High, may be 500% !
System-wide Yes, profiles all app, drivers, OS functions Just application and
profiling instrumented DLLs
Detect unexpected Yes , can detect other programs using OS No
events resources
Setup None Automatic ins. of data
collection stubs required
Data collected Counters, processor an OS state Call graph , call times,
critical path
Data granularity Assembly level instr., with src line Functions, sometimes
statements
Detects No, Limited to processes , threads Yes – can see algorithm,
algorithmic issues call path is expensive
Profiling Tools 3
4. Inclusive v/s Exclusive Profiling
int main( )
{ /* takes 100 secs */
f1(); /* takes 20 secs */
/* other work */
f2(); /* takes 50 secs */
f1(); /* takes 20 secs */
/* other work */
}
/* similar for other metrics, such
as hardware performance counters,
etc. */
• Inclusive time for main
– 100 secs
• Exclusive time for main
– 100-20-50-20=10 secs
5. What are Application Traces
• Tracing
– Recording of information about significant points (events) during program
execution
• entering/exiting code region (function, loop, block, …)
• thread/process interactions (e.g., send/receive message)
– Save information in event record
• timestamp
• CPU identifier, thread identifier
• Event type and event-specific information
– Event trace is a time-sequenced stream of event records
– Can be used to reconstruct dynamic program behavior
– Typically requires code instrumentation
6. Profiling v/s Tracing
• Profiling
– Summary statistics of performance metrics
• Number of times a routine was invoked
• Exclusive, inclusive time/hpm counts spent executing it
• Number of instrumented child routines invoked, etc.
• Structure of invocations (call-trees/call-graphs)
• Memory, message communication sizes
• Tracing
– When and where events took place along a global timeline
• Time-stamped log of events
• Message communication events (sends/receives) are tracked
• Shows when and from/to where messages were sent
• Large volume of performance data generated usually leads to more
perturbation in the program
7. The Big Picture
Sampling Instrumentation
Profiling
Analysis Optimization
9. Measurements - Instrumentation
Instrumentation - Adding measurement probes
to the code to observe its execution
– Can be done on several levels
– Different techniques for different levels
– Different overheads and levels of accuracy with each technique
– No instrumentation: run in a simulator. E.g., Valgrind
10. Measurements - Instrumentation
• Source code instrumentation
– User added time measurement, etc. (e.g.,
printf(), gettimeofday())
Measurements - Instrumentation
– Many tools expose mechanisms for source code
instrumentation in addition to automatic
instrumentation facilities they offer
– Instrument program phases:
• initialization/main iteration loop/data post processing
11. Measurements - Instrumentation
• Preprocessor Instrumentation
– Example: Instrumenting OpenMP constructs with
Opari
Orignial Pre- Modified (instrumented)
source code processor source code
– Preprocessor operation
This is used for OpenMP
analysis in tools such as
KoJak/Scalasca/ompP
/* ORIGINAL CODE in parallel region */
Instrumentation
added by Opari
– Example: Instrumenta
12. Measurements - Instrumentation
• Compiler Instrumentation
– Many compilers can instrument functions
automatically
– GNU compiler flag: -finstrument-
functions
– Automatically calls functions on function
entry/exit that a tool can capture
– Not standardized across compilers, often
undocumented flags, sometimes not available at
all
13. Measurements - Instrumentation
– GNU compiler example:
void __cyg_profile_func_enter(void *this, void *callsite)
{
/* called on function entry */
}
void __cyg_profile_func_exit(void *this, void *callsite)
{
/* called just before returning from function */
}
14. Measurements - Instrumentation
• Library Instrumentation:
MPI library interposition
– All functions are available under two names: MPI_xxx and PMPI_xxx, MPI_xxx symbols
are weak, can be over-written by interposition library
– Measurement code in the interposition library measures begin, end, transmitted data,
etc… and calls corresponding PMPI routine.
– Not all MPI functions need to be instrumented
16. Measurements - Sampling
Using event triggers
– Reoccurring - program counter is sampled many
times
– Histogram of program contexts(CCT)
– Sufficiently large number of samples required
– Uniformity in event triggers wrt execution time
17. Measurements - Sampling
Event trigger types
• Synchronous
– Initiated by direct program action
– E.g. memory allocation, I/O, and inter-process
communication(including MPI communication)
• Asynchronous
– Not initiated by direct program action
– OS timer interrupt or
– Hardware performance counter events
– E.g. CPU, floating point instructions, clock cycles etc.
20. HPCToolkit Overview
• Consists of
– hpcviewer
• Sorts by any collected metric, from any processes displayed
• Displays samples at various levels in call hierarchy through “flattening”
• Allows user to focus in on interesting sections of the program through “zooming”
– Hpcprof and hpcprof-mpi
• Correlating dynamic profiles with static source code structure
– hpcrun
• Application profiling using statistical sampling
• Hpcrun-flat – for collection of `flat' profile
– Hpcstruct
• Recovers static program structure such as procedures and loop nests
– Hpctraceviewer
– Hpclink
• For statically-linked executables (e.g. for Cray XT or BG/P)
20
21. Available Metrics in HPCToolkit
• Metrics, obtained by sampling/profiling
– PAPI Hardware counters
– OS program counters
• Wallclock time (WALLCLK)
– However, can’t get PAPI metrics and Wallclock time in a single run
• Derived metrics
– Combination of existing metrics created by specifying a mathematical formula in an XML
configuration file.
• Source Code Correlation
– Metrics reflect exclusive time spent in function based on counter overflow events
– Metrics correlated at the source line level and the loop level
– Metrics are related back to source code loops (even if code has been significantly altered
by optimization) (“bloop”)
21
23. hpcviewer Views
• Calling context view
– top-down view shows dynamic calling contexts in which costs were
incurred
• Caller’s view
– bottom-up view apportions costs incurred in a routine to the
routine’s dynamic calling contexts
• Flat view
– aggregates all costs incurred by a routine in any context and shows
the details of where they were incurred within the routine
25. hpctraceviewer Views
• Trace view (left, top)
– Time on the horizontal axis
– Process (or thread) rank on the vertical axis
• Depth view (left, bottom) & Summary view
– Call-path/time view for the process rank selected
• Call view (right, top)
– Current call path depth that defines the hierarchical slice
shown in the Trace View
– Actual call path for the point selected by the Trace View's
crosshair
27. Call Path Profiling: Costs in Context
Event-based sampling method for performance measurement
• When a profile event occurs, e.g. a timer expires
– determine context in which cost is incurred
• unwind call stack to determine set of active procedure frames
– attribute cost of sample to PC in calling context
• Benefits
– monitor unmodified fully optimized code
– language independent – C/C++, Fortran, assembly code, …
– accurate
– low overhead (1K samples per second has ~ 3-5% overhead)
29. PAPI
• Performance Application Programming
Interface
– The purpose of the PAPI project is to design, standardize
and implement a portable and efficient API to access the
hardware performance monitor counters found on most
modern microprocessors.
• Parallel Tools Consortium project started in 1998
• Developed by University of Tennessee, Knoxville
• http://icl.cs.utk.edu/papi/
30. PAPI - Support
• Unix/Linux
– Perfctr kernel patch for kernel < 2.6.30
– Perf package for kernel >= 2.6.30
31. PAPI - Implementation
3rd Party and GUI Tools
Portable PAPI High Level
Layer PAPI Low Level
PAPI Machine Dependent Substrate
Machine Kernel Extension
Specific
Layer Operating System
Hardware Performance Counters
32. PAPI - Hardware Events
• Preset Events(Platform neutral)
– Standard set of over 100 events for application performance tuning
– No standardization of the exact definition
– Mapped to either single or linear combinations of native events on each
platform
– Use papi_avail utility to see what preset events are available on a given
platform
– PAPI_TOT_INS
• Native Events(Platform dependent)
– Any event countable by the CPU
– Same interface as for preset events
– Use papi_native_avail utility to see all available native events
– L3_MISSES
• Use papi_event_chooser utility to select a compatible set of events
33. PAPI events demo
papi_avail
papi_native_avail
papi_event_chooser
Availability for QPI h/w performance
counters using /sbin/lspci
34. PAPI-Derived Metrics
Metric Formula
Instructions
Graduated instructions per cycle PAPI_TOT_INS/PAPI_TOT_CYC
Issued instructions per cycle PAPI_TOT_IIS/PAPI_TOT_CYC
Graduated floating point instructions per cycle PAPI_FP_INS/PAPI_TOT_CYC
Percentage floating point instructions PAPI_FP_INS/PAPI_TOT_INS
Ratio of graduated instructions to issued instructions PAPI_TOT_INS/PAPI_TOT_IIS
Percentage of cycles with no instruction issue 100.0 * (PAPI_STL_ICY/PAPI_TOT_CYC)
Data references per instruction PAPI_L1_DCA/PAPI_TOT_INS
Ratio of floating point instructions to L1 data cache accesses PAPI_FP_INS/PAPI_L1_DCA
Ratio of floating point instructions to L2 cache accesses (data) PAPI_FP_INS/PAPI_L2_DCA
Issued instructions per L1 instruction cache miss PAPI_TOT_IIS/PAPI_L1_ICM
Graduated instructions per L1 instruction cache miss PAPI_TOT_INS/PAPI_L1_ICM
L1 instruction cache miss ratio PAPI_L2_ICR/PAPI_L1_ICR
35. PAPI-Derived Metrics
Metric Formula
Cache & Memory Hierarchy
Graduated loads & stores per cycle PAPI_LST_INS/PAPI_TOT_CYC
Graduated loads & stores per floating point instruction PAPI_LST_INS/PAPI_FP_INS
L1 cache line reuse (data) ((PAPI_LST_INS - PAPI_L1_DCM) / PAPI_L1_DCM)
L1 cache data hit rate 1.0 - (PAPI_L1_DCM/PAPI_LST_INS)
L1 data cache read miss ratio PAPI_L1_DCM/PAPI_L1_DCA
L2 cache line reuse (data) ((PAPI_L1_DCM - PAPI_L2_DCM) / PAPI_L2_DCM)
L2 cache data hit rate 1.0 - (PAPI_L2_DCM/PAPI_L1_DCM)
L2 cache miss ratio PAPI_L2_TCM/PAPI_L2_TCA
L3 cache line reuse (data) ((PAPI_L2_DCM - PAPI_L3_DCM) / PAPI_L3_DCM)
L3 cache data hit rate 1.0 - (PAPI_L3_DCM/PAPI_L2_DCM)
L3 data cache miss ratio PAPI_L3_DCM/PAPI_L3_DCA
L3 cache data read ratio PAPI_L3_DCR/PAPI_L3_DCA
L3 cache instruction miss ratio PAPI_L3_ICM/PAPI_L3_ICR
((PAPI_Lx_TCM * Lx_linesize) / PAPI_TOT_CYC)
Bandwidth used (Lx cache)
* Clock(MHz)
36. PAPI-Derived Metrics
Metric Formula
Branching
Ratio of mispredicted to correctly predicted branches PAPI_BR_MSP/PAPI_BR_PRC
Processor Stalls
Percentage of cycles waiting for memory access 100.0 * (PAPI_MEM_SCY/PAPI_TOT_CYC)
Percentage of cycles stalled on any resource 100.0 * (PAPI_RES_STL/PAPI_TOT_CYC)
Aggregate Performance
MFLOPS (CPU cycles) (PAPI_FP_INS/PAPI_TOT_CYC) * Clock(MHz)
MFLOPS (effective) PAPI_FP_INS/Wallclock time
MIPS (CPU cycles) (PAPI_TOT_INS/PAPI_TOT_CYC) * Clock(MHz)
MIPS (effective) PAPI_TOT_INS/Wallclock time
Processor utilization (PAPI_TOT_CYC*Clock) / Wallclock time
http://perfsuite.ncsa.illinois.edu/psprocess/metrics.shtml
37. Component PAPI (PAPI-C)
• Goals:
– Support for simultaneous access to on- and off-processor
counters
– Isolation of hardware dependent code in a separable
‘substrate’ module
– Extension of platform independent code to support
multiple simultaneous substrates
– API calls to support access to any of several substrates
• Released in PAPI 4.0
38. Extension to PAPI to
Support Multiple Substrates
PAPI High Level
PAPI Low Level
Portable
Layer Hardware Independent Layer
PAPI Machine Dependent Substrate PAPI Machine Dependent Substrate
Machine Kernel Extension Kernel Extension
Specific
Operating System Operating System
Layer
Hardware Performance Counters Off-Processor Hardware Counters
39. High-level tools that use PAPI
• TAU (U Oregon)
• HPCToolkit (Rice Univ)
• KOJAK (UTK, FZ Juelich)
• PerfSuite (NCSA)
• SCALASCA
• Open|Speedshop (SGI)
• Intel Vtune
40. • Hpcviewer demo (trace, flops and clock cycles)
– Nek5000(CFD solver using spectral element
method)
– Xhpl(Linpack)