This document provides an overview of debugging tools and techniques, focusing on the GNU Debugger (GDB). It discusses GDB basics like breakpoints, printing variables, and stepping through code. It also covers more advanced GDB features like visual mode, examining call frames, setting watchpoints, and reverse debugging. The document recommends using compiler flags for debugging, and introduces complementary tools like Valgrind and Clang sanitizers. It concludes that writing debuggable code through assertions and logging is the first step to troubleshooting bugs.

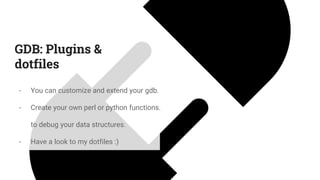
![GDB: Before invoking
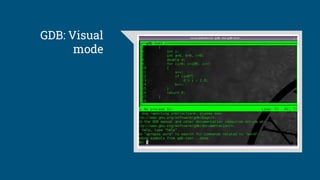
GDB
Always use compiling flag for gdb:
$ g++ -g main.cpp
Invoke gdb in the following manner:
$ gdb [-tui] ./a.out](https://image.slidesharecdn.com/session5-200113010109/85/Debuging-like-a-pro-4-320.jpg)
![GDB: Basic commands
- gdb> r[un] : execute your code.
- gdb> b[reak] line|file:line|function : set a breakpoint.
- gdb> p[rint] variable : Display the variable name.
- gdb> n[ext] : Goes to next line.
- gdb> s[tep] : Goes inside the function currently in the PC.
- gdb> fin[ish] : Stop when we are returning.](https://image.slidesharecdn.com/session5-200113010109/85/Debuging-like-a-pro-5-320.jpg)
![GDB: Reverse walking
- gdb> record [stop]
- gdb> reverse-continue [rc]
- gdb> reverse-step [rs]
- gdb> reverse-next [rn]
- gdb> set exec-direction forward|reverse](https://image.slidesharecdn.com/session5-200113010109/85/Debuging-like-a-pro-11-320.jpg)