Downloaded 21 times


![16
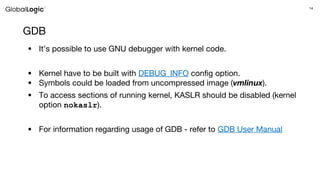
Module debugging
To debug loadable module:
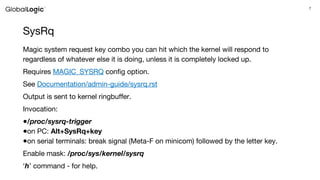
● load the module in target system
● get load addresses
○ they are presented in /sys/module/${MODULE_NAME}/sections/
● launch gdb with loaded symbols of running kernel and attach to target
● in gdb prompt load symbols information with add-symbol-file command:
○ add-symbol-file ${MODULE_KO} ${LOAD_ADDR} [-s $
{section_name} ${section_addr}]...
● You are ready](https://image.slidesharecdn.com/kharkivembeddedtechtalk1-linuxkerneldebugging-180403173558/85/Linux-Kernel-Debugging-16-320.jpg)


The document discusses various Linux kernel debugging techniques including the use of debugfs for exposing kernel information to user space, sysrq for system request key combinations, ftrace for kernel function tracing, and GDB for debugging kernel code. It provides API references for enabling and using these debugging tools, as well as instructions for setting them up in a development environment, including usage with QEMU and Eclipse CDT. Key focus areas include tracing functions, managing kernel states, and debugging loadable modules.