Download as PDF, PPTX


![SOS (Clear Linux) - gdb case study
• Check UOS kmesg
- Attach gdb to dm and stop dm and check ctx base address.
- locate UOS kmesg address:
#find ctx->base_addr, +0x200000000, {char[30]}"Supporting XSAVE feature 0x001"
- dump 1M memory range of UOS kmesg buffer
#dump binary memory ~/dump.bin <return_find> <return_find + 1M>
- parse content dumped with attached python script
• Check the ioreq handled in DM
- attach gdb to dm with attached vmexit.txt as init script
- gdb will print the ioreq info
- Very useful when we want to check whether guest is still alive](https://image.slidesharecdn.com/projectacrnsystemdebug-200605185204/85/Project-ACRN-system-debug-6-320.jpg)


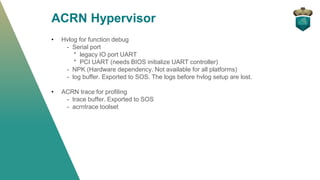
This document provides an overview of debugging tools and capabilities for the ACRN hypervisor. It discusses the ACRN hypervisor log (hvlog) and trace tools, as well as logging and debugging options for the Service OS (SOS Linux) including kernel logs, user space loggers, and gdb. Debugging options for User OSs (UOSs) are also covered, which depend on the specific UOS. Finally, some miscellaneous debugging tools are mentioned like platform tracing and JTAG tools.