Download to read offline


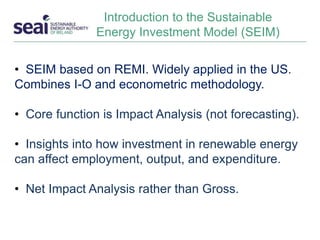

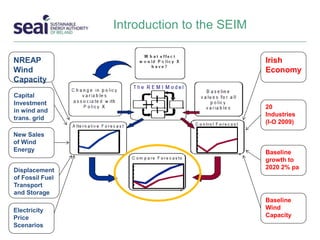
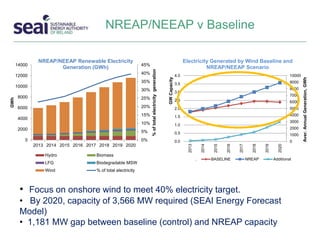
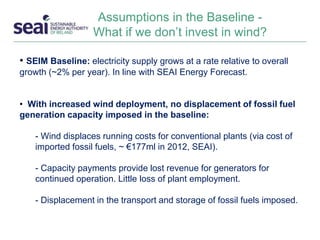
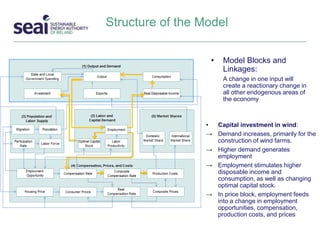
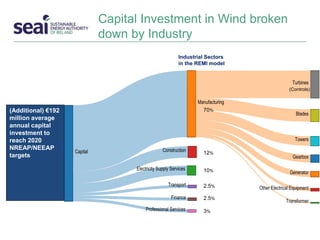
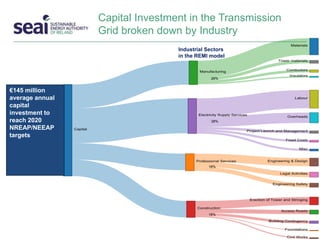
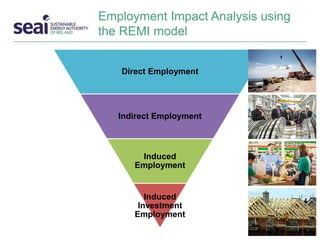
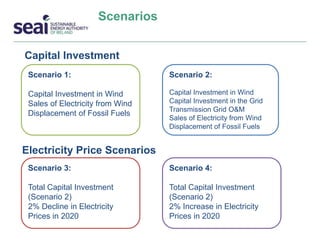
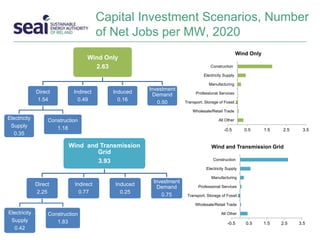
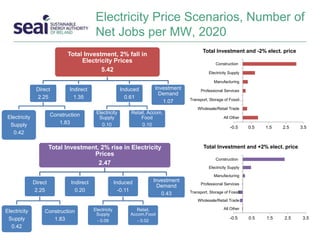
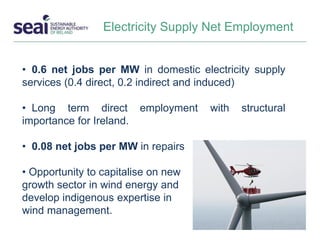
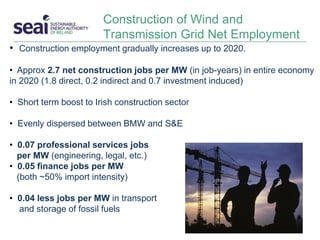
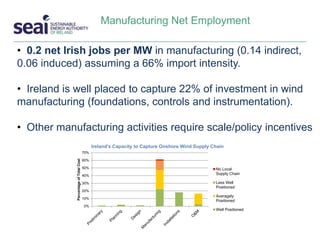

The document presents an analysis of the net macroeconomic and employment impacts of onshore wind deployment in Ireland by 2020, utilizing the Sustainable Energy Investment Model (SEIM). It highlights the need for a significant increase in wind capacity to meet energy targets, the expected job creation from capital investments, and the positive implications of renewable energy for GDP and employment. Additionally, it outlines various scenarios relating to electricity prices and their influence on employment levels in the wind energy sector.


