This document summarizes Holton's evaluation model for assessing human resource development (HRD) interventions and outcomes. The model proposes three outcome levels - learning, individual performance, and organizational performance. Recent studies provide support for some constructs in the model but also suggest areas for modification. The summary updates specific constructs that should be measured in each conceptual category based on new evidence from the literature. Key findings include support for including constructs like the Big Five personality traits, goal orientation, and locus of control as individual characteristics influencing learning outcomes. The summary also suggests job attitudes and perceptions of training need more research but proposes including constructs like job involvement and organizational commitment.
REPRODUCTIVE TOXICITY STUDIE OF MALE AND FEMALEpptx
Link to survey httpsdrive.google.comopenid=1oQoB6fylZG6OmXxr.docx
1. Link to survey:
https://drive.google.com/open?id=1oQoB6fylZG6OmXxr96ZPT
KGQGQxET34VNSWfOvZCxTU
10.1177/1523422304272080
Advances in Developing Human Resources February 2005
Holton / HOLTON’S EVALUATION MODEL
Holton’s Evaluation Model:
New Evidence and
Construct Elaborations
Elwood F. Holton, III
The problem and the solution. Holton proposed the HRD
Evaluation and Research Model as a comprehensive framework
for diagnosing and understanding the causal influences of HRD
intervention outcomes. Unfortunately, a full test of Holton’s
model has not been possible because tools to measure the con-
structs in the model did not exist. This article reviews recent
studies relevant to the constructs in Holton’s model and
updates it by delineating specific constructs that should be mea-
sured in each of the conceptual categories proposed.
Keywords: HRD evaluation; evaluation models; HRD outcomes;
HRD
theory; Learning Transfer System Inventory; LTSI
Holton (1996) sharply criticized Kirkpatrick’s (1959) four-level
evaluation
model and proposed the HRD Evaluation and Research Model as
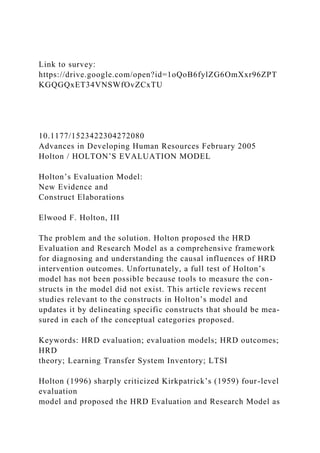
2. a more
comprehensive framework for diagnosing and understanding the
causal
influences of HRD intervention outcomes. The original model
(see Figure
1) was theoretically derived and more conceptually
comprehensive than
Kirkpatrick’s simple four-level taxonomy. Three outcome levels
are
hypothesized in the model: learning, individual performance,
and organiza-
tional performance. Following Noe and Schmitt (1986), the
macro-
structure of that model hypothesizes that HRD outcomes are a
function of
factors in three construct domains: ability, motivation, and
environmental
influences. The model further specified conceptual constructs in
each
domain that are hypothesized to influence each of the three
outcome levels.
Secondary influences are also included, particularly those that
affect moti-
vation to learn.
The model addressed one of the biggest risks of the four-level
model,
specifically, that any failure to achieve outcomes from an
intervention
would be attributed to the intervention itself when it could well
be due to
moderating variables. Perhaps the best example of this is the
situation that
Advances in Developing Human Resources Vol. 7, No. 1
Februar y 2005 37-54
3. DOI: 10.1177/1523422304272080
Copyright 2005 Sage Publications
at AHRD on January 26, 2016adh.sagepub.comDownloaded
from
http://adh.sagepub.com/
arises when learning outcomes (level 2) from a training
intervention are
positive but no on-the-job behavior change occurs (level 3)
because the
transfer climate is poor. Unless the transfer climate is
evaluated, the deci-
sion derived from the four-level model would be that the
training interven-
tion had failed and needed to be changed. The correct
evaluation decision
derived from the Holton model would be that the training
intervention did
not need to be changed but the organization did not have the
transfer climate
to support it, so an organization development intervention
would be needed.
Unfortunately, a full test of my model has not been possible
because
many of the tools to measure the constructs in the model did not
exist. How-
ever, since I first proposed my model in 1996, research
evidence has contin-
ued to accumulate and generally supports it, although some
research sug-
gests that modifications are needed. This article reviews
selected recent
4. studies relevant to the constructs in my model and updates the
model by
delineating specific constructs that should be measured in each
of the con-
ceptual categories proposed. In certain instances, the model is
modified
based on new research or theory. The result is an updated
version of the
model that is more appropriate for empirical testing.
38 Advances in Developing Human Resources Febr uar y 2005
Learning
Individual
Performance
Organizational
Performance
Outcomes
Environment
Elements
Ability/Enabling
Elements
Motivation
Elements
Secondary
Influences
Motivation to
Learn
5. Perceptions of
Training
Transfer Climate
Motivation to
Transfer
Learning Design
Ability
Transfer
Design
Linkage to
Organization Goals
Individual
Characteristics
Intervention
Readiness
Job Attitudes
Intervention
Fulfillment
External Events
Expected
Utility/Return
on Investment
FIGURE 1: HRD Evaluation Research and Measurement Model
6. From Holton (1996)
at AHRD on January 26, 2016adh.sagepub.comDownloaded
from
http://adh.sagepub.com/
Influences on Learning
This section reviews recent research on factors influencing
individual
learning outcomes. These are the first domain of outcomes in
the model
moving sequentially from left to right.
Secondary Influences—Individual Learner Characteristics
Some of the most intriguing research in recent years has been
focused on
learner dispositional influences on learning, primarily through
motivation
to learn. Dispositional influences are a general category of
individual traits
that are relatively stable and enduring and that predispose a
person toward
certain tendencies or patterns. The best-known example of
dispositional
characteristics is personality, although there are many others.
Much of the work on personality traits has used the Big Five
framework.
The Five Factor Model dominates the current view of
personality and pro-
vides a unifying structure to its study. This model has, in fact,
garnered so
7. much support that the FFM “has now become an almost
universal template
for understanding the structure of personality” (Ferguson &
Patterson,
1998, p. 789). As the name implies, this model suggests that
there are five
broad categories of traits at the top of the personality trait
hierarchy. The rel-
atively orthogonal five-factor taxonomy resulted from decades
of research
on the structure of human personality (Costa & McCrae, 1992)
and has
gained the support of numerous researchers (e.g., Costa &
McCrae, 1995;
Digman, 1990; Goldberg, 1990). As highlighted by Costa and
McCrae
(1992), the five dimensions of the Five Factor Model of
personality are
neuroticism (or emotional stability), extraversion, openness to
experience,
agreeableness, and conscientiousness.
Colquitt, LePine, and Noe’s (2000) seminal meta-analysis on
training
motivation research examined research on a variety of
influences on learn-
ing and transfer outcomes of training. There were a number of
important
findings in their work relevant to this model. First, two
dimensions of the
Big Five personality measures were found to influence
motivation to learn
through pretraining self-efficacy. They were conscientiousness
and anxiety
(a component of neuroticism). Conscientiousness refers to the
extent to
8. which someone is dependable, persevering, hardworking,
disciplined,
deliberate, and achievement oriented (Herold, Davis, Fedor, &
Parsons,
2002, p. 854). It has consistently been linked to motivation to
learn and
training outcomes (Barrick & Mount, 1991; Colquitt &
Simmering, 1998;
Naquin & Holton, 2002).
Emotional stability, also known by its opposite trait of
neuroticism,
reflects the absence of feelings of anxiety, insecurity, and
nervousness. It
reflects to some degree positive psychological adjustment.
People scoring
Holton / HOLTON’S EVALUATION MODEL 39
at AHRD on January 26, 2016adh.sagepub.comDownloaded
from
http://adh.sagepub.com/
high on this dimension are generally less anxious and more
upbeat in their
outlook. Emotional stability has been found to be related to
training out-
comes, including transfer outcomes (Herold et al., 2002).
Several studies also found that openness to experience, another
of the Big
Five personality dimensions, is related to both learning and
transfer out-
comes (Barrick & Mount, 1991; Herold et al., 2002; LePine,
9. Colquitt, &
Erez, 2000), although Naquin and Holton (2002) did not find a
significant
effect for this construct. Openness to experience is associated
with intellect,
curiosity about one’s environment, and a willingness to explore
new things.
Because training requires persons to embrace new things, this
trait should
be helpful to trainees (Herold et al., 2002, p. 855).
Naquin and Holton (2002) found support for agreeableness as a
predic-
tor, whereas most studies have not. Agreeableness is an
interpersonal trait
and reflects the degree to which a person is generally a
cooperative, compas-
sionate, and trusting person in interpersonal situations. Only
limited sup-
port has been found, perhaps because its effect is limited to
training related
to interpersonal skills training.
In sum, three of the Big Five factors—conscientiousness,
neuroticism,
and openness to experience—have received strong support in
the literature,
whereas agreeableness has received weak support. Extraversion
appears to
have no relationship with training outcomes. Thus, the three
personality
traits with strong support are recommended for inclusions in the
model as
personality trait measures.
Moving beyond the Big Five, the latest trait to emerge in
10. literature has been
goal orientation. Goal orientation posits that individuals are of
two
types—learning oriented versus performance oriented.
A learning orientation is characterized by a desire to increase
one’s competence by developing
new skills and mastering new situations. In contrast,
performance orientation reflects a desire to
demonstrate one’s competence to others and to be positively
evaluated by others. (p. 498)
Research has shown that individuals with a learning orientation
tend to pursue
difficult learning challenges and persist in the face of failure of
learning difficul-
ties. Persons with a performance orientation tend to see the
same situations as
threatening and to withdraw from them. Thus, a learning
orientation is associ-
ated with more positive learning outcomes, whereas a
performance orientation
is associated with negative or neutral learning outcomes (Bell &
Kozlowski,
2002; Chen, Gully, Whiteman, & Kilcullen, 2000; Colquitt &
Simmering, 1998;
Ford, Smith, Weisbein, & Gully, 1998). Most recently, goal
orientation has been
shown to have an interactive effect with cognitive ability (Bell
& Kozlowski,
2002). Because of the compelling evidence in the literature,
goal orientation is
recommended as another individual difference variable for the
model.
Another dispositional variable that has received recent support
11. in the lit-
erature is locus of control (Colquitt et al., 2000). Persons with
an internal
locus of control tend to have more positive attitudes and
motivation toward
40 Advances in Developing Human Resources Febr uar y 2005
at AHRD on January 26, 2016adh.sagepub.comDownloaded
from
http://adh.sagepub.com/
training because they are more likely to believe that they can
change their
abilities and motivation through their own actions. Persons with
an external
locus of control are more likely to believe that changes in
performance are
only possible through changes in factors external to themselves.
Logically,
then, persons with an internal locus of control are more likely to
believe that
they can improve their skills and performance by exerting effort
in training.
Locus of control has been shown to be a significant predictor of
motivation
to learn in Colquitt et al.’s (2000) meta-analysis and thus is
recommended
for inclusion in the model.
In summary, recent research points to five variables as measures
of the
individual characteristics category in the Holton Evaluation
Model. They
12. are (a) conscientiousness, (b) neuroticism (emotional stability),
(c) open-
ness to experience, (d) goal orientation, and (e) locus of
control. The origi-
nal theory posited that the effect of these variables would be
fully mediated
by motivation to learn. However, Colquitt et al.’s (2000) meta-
analysis
showed convincingly that these learner characteristics had both
an indirect
effect through motivation to learn as well as a direct effect on
learning.
Thus, it seems appropriate to add a path directly from these
individual
characteristics to learning.
Secondary Influences—Job Attitudes
The second category of secondary influences posited in the
Holton
model was job attitudes. The theory posits that job attitudes
should affect
both motivation to learn and motivation to transfer learning.
Logically, it
presumes that individuals who have more positive attitudes
toward their
organization would be more likely to engage in learning that
will benefit the
organization through improved performance. Unfortunately, as
Colquitt
et al. (2000) note in their meta-analysis, job attitude variables
have not
received sufficient research attention in the training literature.
In fact,
most of the job attitude variables could not even be included in
their
13. meta-analytic path analysis because of the paucity of studies.
The limited research on job attitudes has focused on several
variables.
First is job involvement, which has been the most frequently
researched job
attitude variable and has consistently been shown to be a
significant predic-
tor of motivation. Second is organizational commitment. Naquin
and
Holton (2002) provide compelling evidence of the importance of
these vari-
ables in their study of the effects of dispositional variables and
work atti-
tudes on a construct they identified as Motivation to Improve
Work Through
Learning (MTIWL). MTIWL is a higher order construct
combining motiva-
tion to learn and motivation to transfer. In their study, work
commitment,
which included both job involvement and two dimensions of
organizational
commitment, was the second strongest predictor of motivation
after positive
Holton / HOLTON’S EVALUATION MODEL 41
at AHRD on January 26, 2016adh.sagepub.comDownloaded
from
http://adh.sagepub.com/
affectivity. Work commitment also mediated the effects of
conscientious-
ness on motivation. Thus, work commitment was shown to have
14. a strong and
direct effect on both dimensions of motivation. However,
Colquitt et al.’s
(2000) meta-analysis did not find job involvement to be a
significant predic-
tor and they were unable to test organizational commitment due
to an
insufficient number of studies.
Given the limited evidence, it is hard to know definitively
which job atti-
tudes to measure. It is clear that more research is needed in this
area. Given
that there is some evidence supporting job involvement and
organizational
commitment as predictors of motivation, these two variables are
included in
the model primarily because they need to be more carefully
studied to
understand their effect on learning and transfer outcomes.
Perceptions of Training
Perceptions of training, also known as reactions, have been the
most con-
troversial domain of evaluation. Kirkpatrick (1998) sanctioned
reactions as
legitimate outcomes, calling them level 1 outcomes. Holton
(1996) demoted
them to a moderator variable in the HRD Evaluation and
Research Model,
based largely on meta-analysis research that has shown low or
no relation-
ship between reaction outcomes and higher level outcomes of
learning and
performance (Alliger & Janak, 1989; Alliger, Tannenbaum,
15. Bennett, Trave,
& Shotland, 1997). Swanson and Holton (1999) included them
as an out-
come but advocated not trying to achieve high levels of reaction
results in
order not to overemphasize reaction outcomes because doing so
often
underemphasizes learning and performance outcomes.
Recent research has shed new light on the multidimensionality
of reac-
tions and their relationship to learning and performance
outcomes. Morgan
and Casper (2000) conducted a factor analytic study of a large
database of
responses to a multidimensional reaction instrument. They
demonstrated
that reaction measures were, in fact, multidimensional,
including a factor
they labeled as “Utility Reactions” along with other more
typical affective
reaction measures. These results were cross-validated with
confirmatory
factor analysis in a split-sample design. They suggested that
models of
training effectiveness such as the Holton model might benefit
from incorpo-
rating a multidimensional treatment of participant reactions.
Two studies have suggested that utility reactions may have
some incre-
mental validity in predicting learning or performance outcomes.
Tan, Hall,
and Boyce (2003) created a utility reaction scale that also
incorporated
behavioral intentions and tested the effect of the affective and
16. utility reac-
tion measures on learning and performance. Their results
showed that one
utility reaction scale was a significant predictor over and
beyond a pretest in
42 Advances in Developing Human Resources Febr uar y 2005
at AHRD on January 26, 2016adh.sagepub.comDownloaded
from
http://adh.sagepub.com/
predicting learning. However, no reaction measures were
significant in
predicting performance.
Ruona, Leimbach, Holton, and Bates (2002) added support to a
role for
utility reactions in predicting motivation to transfer learning. In
their analy-
sis, they first entered transfer system perceptions into a
hierarchical regres-
sion model and then forced the utility reaction measure to enter
last. Utility
reactions were a significant predictor and increased the model
R2 from .41 to
.46, suggesting that utility reactions added predictive power
over and
beyond transfer system perceptions.
Together, this research suggests that perceptual measures of
training
completed by trainees may have a role in predicting learning
and perfor-
17. mance outcomes, albeit a small one. It is clear that the research
is inconclu-
sive, but it suggests several tentative conclusions. First, there is
no support
for including affective reactions in the model. No research is
emerging that
shows that affective reactions have any role in predicting
important out-
comes from training. Second, research suggests that utility
reactions offer
small but significant predictive power to the model. Finally, an
intriguing
new dimension, behavioral intentions, has emerged with a
strong theoretical
base that warrants inclusion in the model and further testing.
Based on these
findings, two constructs are recommended for the Holton model
for the per-
ceptions of training domain: utility reactions and behavioral
intentions.
Influences on Individual Performance
The next domain of outcomes to consider is individual
performance. In
this section, research on factors influencing individual
performance is
examined and enhancements to the Holton model are proposed.
Learning Transfer Research
Immediately after publishing the model shown in Figure 1, I
began work
to move toward a comprehensive test of the model.
Unfortunately, there
were glaring gaps in both theory and measurement tools that
18. needed to be
addressed before any full test was possible. Perhaps the most
glaring gap
was in the area of transfer climate. At that time, there was no
validated
framework to define transfer climate nor any generally accepted
and vali-
dated instrument to measure what was identified in my model as
transfer
design, transfer climate, and motivation to transfer. My
associates and I
quickly began to work on a conceptual framework and
measurement instru-
ment. Few people realized that it was not learning transfer per
se that drove
our interest but rather our desire to work toward a
comprehensive test of the
Holton model.
Holton / HOLTON’S EVALUATION MODEL 43
at AHRD on January 26, 2016adh.sagepub.comDownloaded
from
http://adh.sagepub.com/
This program of research now focuses on what we call the
learning trans-
fer system, instead of transfer climate (Holton, Bates, & Ruona,
2000). The
learning transfer system is defined as all factors in the person,
training, and
organization that influence transfer of learning to job
performance. Transfer
climate, the more common term, is actually but one subset of
19. factors that
influences transfer, although the term is sometimes incorrectly
used to refer
to the full set of influences. Other influences on transfer include
training
design, personal characteristics, opportunity to use training, and
motiva-
tional influences. Thus, the transfer system is a broader
construct than trans-
fer climate but includes all factors traditionally referred to as
transfer cli-
mate. Transfer can only be completely understood and
influenced by
examining the entire system of influences.
The instrument that resulted from this program of research is
called the
Learning Transfer System Inventory (LTSI). It has been well
tested with
strong evidence of construct validity (Bookter, 1999; Holton et
al., 2000),
initial evidence of criterion validity (Bates, Holton, Seyler, &
Carvalho,
2000; Ruona et al., 2002; Seyler, Holton, Bates, Burnett, &
Carvalho, 1998),
and good cross-cultural validity (Chen, 2003; Khasawneh, 2004;
Yamnill,
2001). The LTSI program of research has resulted in a
framework that
defines 16 constructs that make up the learning transfer system.
Table 1
shows the constructs measured by the LTSI, their definition,
and a sample
item along with scale reliabilities. These 16 factors are believed
to measure
the full system of factors that influence learning transfer,
20. although further
criterion validation studies are still under way.
The LTSI defines and measures all the variables that should be
measured
in the transfer design, transfer climate, and motivation to
transfer boxes of
the Holton model. Figure 2 shows how the constructs of the
LTSI map to
these three conceptual categories.
Motivation to Improve Work Through Learning
One of the most important developments in the Holton model
has been
the reconceptualization of the motivation constructs for both
learning and
transfer. In the original model, motivation was conceptualized
in the tradi-
tional way, namely, as the two separate construct domains of
Motivation to
Learn (MTL) and Motivation to Transfer (MTT). As shown in
Figure 1, a
relationship between the two was posited in that MTT was
hypothesized to
influence MTL, but they were still conceptualized as separate
constructs.
Naquin and Holton (2003) completely reconceptualized
motivation by
creating the construct MTIWL. The work improvement process
in HRD,
they argue, is not just a function of learning or training. Rather,
it requires
learners to acquire knowledge and transfer that knowledge into
improved
21. work outcomes or productivity. They further argue that using
MTL is too
44 Advances in Developing Human Resources Febr uar y 2005
at AHRD on January 26, 2016adh.sagepub.comDownloaded
from
http://adh.sagepub.com/
45
TA
B
LE
1
:
L
e
a
rn
in
g
T
ra
n
sf
e
r
103. limiting for organizational learning environments. What
employees are
really engaged in is the process of improving work through the
learning pro-
cess that necessarily entails transferring learning into job
application.
MTIWL was defined as
Motivation to Improve Work Through Learning (MTIWL) =
ƒ(Motivation to Train, Motivation to Transfer)
Naquin and Holton (2003) demonstrated the initial construct
validity of this new
construct using confirmatory factor analysis.
Although on the surface it might appear that this construct only
combines
two existing constructs in an additive fashion, the effects are
likely to be
more significant on outcomes in the Holton model. That is,
persons entering
a learning situation with high levels of MTIWL are likely to
have greater
motivation to engage in work-relevant learning experiences
offered with
strong transfer designs that stress practice and job application
than persons
with high levels of simple MTL. Thus, the nature of the MTIWL
motivation
in the learning environment is expected to be substantively
different from
simple MTL and will demand different types of learning
experiences. Fur-
ther, they can be expected to exhibit higher rates of transfer to
104. individual
performance.
48 Advances in Developing Human Resources Febr uar y 2005
Outcomes
Environment
Motivation
Secondary
Influences
Ability
Learning
Individual
Performance
Content Validity
Transfer Design
Personal Capacity for Transfer
Opportunity to Use
Motivation to Transfer
Transfer Effort --> Performance
Performance--> Outcomes
Feedback
Peer Support
Supervisor Support
Openness to Change
Personal Outcomes-Positive
Personal Outcomes-Negative
105. Supervisor Sanctions
Performance Self-Efficacy
learner Readiness
Organizational
Performance
FIGURE 2: Learning Transfer System Inventory (LTSI)
Conceptual Map of Constructs
at AHRD on January 26, 2016adh.sagepub.comDownloaded
from
http://adh.sagepub.com/
Obviously, this new construct remains untested and has
unknown crite-
rion validity. However, it is promising enough that I am
changing the Holton
model to incorporate it and spur research on its validity. The
constructs pre-
viously included in the MTL and MTT boxes in the model are
now inte-
grated into one motivation domain, MTIWL.
Also unknown is whether the relationships found in the
literature as dis-
cussed above between secondary influences such as
dispositional factors,
job attitudes, and MTL will also hold true for MTIWL.
However, I suggest
that it is a short theoretical leap to hypothesize that they will,
although only
further research will definitively validate them.
106. Influences on Organizational Performance
Unfortunately, there has been almost no research on factors
influencing
the transfer of individual performance into organizational
performance
results. This reflects the almost exclusive focus in training
research on the
individual level of analysis. It also highlights a serious
shortcoming of train-
ing research in that the greatest effect on organizations
obviously occurs
through attaining organizational performance, yet this domain
receives the
least attention in the literature.
One notable exception is a study by Montesino (2002) in which
he exam-
ined the linkage between training, the strategic direction of the
organiza-
tion, transfer enhancing behaviors, and usage of training on the
job. Several
important findings emerged. First, a low to moderate correlation
was found
between managers’ and trainees’ engagement in transfer
enhancing behav-
iors and their perceptions that training was congruent with the
strategic
direction of the firm. This directly supports the relationship in
the HRD
Evaluation and Research Model between Expected
Return/Utility of Train-
ing and MTT in that training perceived to be congruent with the
firm’s strat-
egy is expected to have higher utility and therefore to increase
107. trainee MTT.
Second, trainees who reported very high usage of training
perceived a signifi-
cantly higher alignment of training with the strategic direction
of the firm
(Montesino, 2002, p. 102). Montesino concludes that
apparently those trainees who saw more clearly the connection
of the training program with the
strategic direction of the organization were able to apply on the
job the skills they learned in the
training program in greater proportion than were the trainees
who did not see that connection
clearly. (p. 103)
This clearly supports the relationship between Linkage to
Organizational Goals
and individual performance in the ability domain of the Holton
model.
Although this is only one study, it offers clear evidence that the
relation-
ships and constructs in my model are promising. Equally
evident is that
there is a dearth of research in this area and a rich opportunity
exists for
Holton / HOLTON’S EVALUATION MODEL 49
at AHRD on January 26, 2016adh.sagepub.comDownloaded
from
http://adh.sagepub.com/
108. additional research into factors affecting the strategic effect of
training on
organizational performance.
Bates and Khasawneh (2004) provided some additional insight
into how
this linkage might operate. In their study, they examined the
effects of a
learning organization culture and selected dimensions of
transfer climate on
organizational innovation, an important organizational outcome
from learn-
ing organization interventions. Their results suggested that a
learning orga-
nization culture had both direct and indirect effects on
organizational inno-
vation, with transfer climate constructs partially mediating the
effects of the
learning organization culture. Thus, this study provides
additional evidence
that Expected Utility/Return on Investment and Linkage to
Organizational
Goals are important organizational factors as hypothesized in
this model.
Learning organizations typically include a strong linkage
between organi-
zational goals and learning, presumably resulting in higher
perceived return
on investment, which should lead to greater motivation to learn.
In addition,
they have indirect influences through transfer climate as shown
in this
model by the relationships hypothesized between organizational
influences
and transfer climate factors at the individual performance level.
109. Conclusion
This article accomplished three goals. First, it reviewed recent
research
that supports the Holton Evaluation and Research Model.
Second, it pro-
vided an update to the model by modifying it to reflect new
theory, particu-
larly in the area of motivation. Third, it presented an
elaboration of the
model by identifying the specific variables that should be
measured within
each of the conceptual construct domains specified in Holton
(1996). By
doing so, it moved the model one step closer to empirical
testing and
validation.
Figure 3 presents the revised model with complete construct
definitions,
where possible. The obvious challenge that remains is to
validate the model.
Although complex, I believe that the model can one day be
validated, at least
in part if not in its entirety. This article and the work that has
transpired in the
past 8 years have made it now feasible to consider a validation
study where it
was impossible to even consider 8 years ago. Most likely, the
initial valida-
tion study will include just the learning and individual
performance out-
come domains, as much work remains to be done in the
organizational per-
formance domain. Nonetheless, tremendous progress has been
made and
110. validation looks more feasible than ever before.
A validation effort would likely need to be conducted in steps.
First, vali-
dation studies could be conducted on a single level of outcomes.
For exam-
ple, researchers would measure all the intervening variables
affecting learn-
ing as an outcome and test their effect on learning. Or, the
intervening
50 Advances in Developing Human Resources Febr uar y 2005
at AHRD on January 26, 2016adh.sagepub.comDownloaded
from
http://adh.sagepub.com/
variables affecting transfer to job performance would be
measured and
tested for their effect on transfer.
Second, a multilevel analysis that combines the two approaches
dis-
cussed above could be conducted. Specifically, the intervening
variables
affecting learning and those affecting performance would be
measured and
tested for their ability to predict transfer to job performance.
Ultimately, the goal would be to test the entire model. That will
require
considerable work to define and operationalize constructs
influencing orga-
nizational results. Montesino’s (2002) study is a promising
111. example of the
kind of research that can be conducted to further define
intervening vari-
ables at the organizational level and how they influence both
individual
transfer and organizational results.
It is clear that these analyses are complex and will require the
use of
advanced statistical analysis techniques and partners willing to
engage in
extensive data collection efforts. The validation studies will
require struc-
tural equation modeling analysis to study the causal
relationships hypothe-
sized among the construct. Because the model is a multilevel
one, hierarchi-
cal linear modeling would likely be employed to analyze the
cross-level
relationships.
Holton / HOLTON’S EVALUATION MODEL 51
Outcomes
Environment
Motivation
Secondary
Influences
Ability
Learning Individual Performance
112. Content Validity
Transfer Design
Personal Capacity for Transfer
Opportunity to Use
Motivation to Improve Work Through Learning (MTIWL)
Motivation to Learn
Motivation to Transfer
Transfer Effort --> Performance
Performance --> Outcomes
Feedback
Peer Support
Supervisor Support
Openness to Change
Personal Outcomes -Positive
Personal Outcomes -Negative
Supervisor Sanctions
Performance Self -Efficacy
Learner Readiness
Organizational Performance
Personality Traits
Conscientiousness
Neuroticism
Openness to Experience
Goal Orientation
Locus of Control
Job Attitudes
Organizational Commitment
Job Involvement
Perceptions
113. Utility Perceptions
Behavioral Intentions
Linkage to Organization
Goals
External Events
Expected
Utility/Return on
Investment
Learning Design
Ability
FIGURE 3: Revised HRD Evaluation and Research Model
at AHRD on January 26, 2016adh.sagepub.comDownloaded
from
http://adh.sagepub.com/
In conclusion, the validation of this model will clearly be
ambitious and
demanding research. Nonetheless, if the network of causal
influences on
important HRD intervention outcomes is to be understood, then
this type of
research is necessary and should be undertaken.
References
Alliger, G. M., & Janak, E. A. (1989). Kirkpatrick’s levels of
114. training criteria: Thirty
years later. Personnel Psychology, 42, 331-342.
Alliger, G. M., Tannenbaum, S. I., Bennett, W., Trave, H., &
Shotland, A. (1997). A
meta-analysis of the relations among training criteria. Personnel
Psychology, 50(2),
341-358.
Barrick, M. R., & Mount, M. K. (1991). The big five personality
dimensions and job per-
formance: A meta-analysis. Personnel Psychology, 44, 1-26.
Bates, R. A., Holton, E. F., III, Seyler, D. L., & Carvalho, M.
B. (2000). The role of inter-
personal factors in the application of computer-based training in
an industrial setting.
Human Resource Development International, 3, 19-42.
Bates, R. A., & Khasawneh, S. (2004). Organizational learning
culture, transfer climate,
and perceived innovation in Jordan. In T. M. Egan & M. L.
Morris (Eds.), Proceedings
of the 2004 Academy of Human Resource Development
Conference (514-521). Bowl-
ing Green, OH: Academy of Human Resource Development.
Bell, B. S., & Kozlowski, S.W.J. (2002). Goal orientation and
ability: Interactive effects
on self-efficacy, performance and knowledge. Journal of
Applied Psychology, 87,
497-505.
Bookter, A. I. (1999). Convergent and divergent validity of the
learning transfer ques-
tionnaire. Unpublished doctoral dissertation, Louisiana State
115. University, Baton
Rouge.
Chen, G., Gully, S. M., Whiteman, J. A., & Kilcullen, R. N.
(2000). Examination of rela-
tionships among trait-like individual differences, state-like
individual differences,
and learning performance. Journal of Applied Psychology, 85,
835-847.
Chen, H.-C. (2003). Cross-cultural construct validation of
learning transfer system
inventory in Taiwan. Unpublished doctoral dissertation,
Louisiana State University,
Baton Rouge.
Colquitt, J. A., LePine, J. A., & Noe, R. A. (2000). Toward an
integrative theory of train-
ing motivation: A meta-analytic path analysis of 20 years of
research. Journal of
Applied Psychology, 85, 678-707.
Colquitt, J. A., & Simmering, M. J. (1998). Conscientiousness,
goal orientation and moti-
vation to learn during the learning process: A longitudinal
study. Journal of Applied
Psychology, 83, 654-665.
Costa, P. T., & McCrae, R. R. (1992). Revised NEO personality
inventory and the
five-factor inventory professional manual. Odessa, FL:
Psychological Assessment
Resources.
52 Advances in Developing Human Resources Febr uar y 2005
116. at AHRD on January 26, 2016adh.sagepub.comDownloaded
from
http://adh.sagepub.com/
Costa, P. T., & McCrae, R. R. (1995). Solid ground in the
wetlands of personality: A reply
to Block. Psychological Bulletin, 117, 216-220.
Digman, J. M. (1990). Personality structure: Emergence of the
five factor model. Annual
Review of Psychology, 41, 417-440.
Ferguson, E., & Patterson, F. (1998). The five factor model of
personality: Openness a
distinct but related construct. Personality and Individual
Differences, 24, 789-796.
Ford, J. K., Smith, E. M., Weisbein, D. A., & Gully, S. M.
(1998). Relationship of goal ori-
entation, metacognitive activity, and practice strategies with
learning outcomes and
transfer. Journal of Applied Psychology, 83, 218-233.
Goldberg, L. R. (1990). An alternative “description of
personality”: The big-five factor
structure. Journal of Personality and Social Psychology, 59,
1216-1229.
Herold, D. M., Davis, W., Fedor, D. B., & Parsons, C. K.
(2002). Dispositional influences
on transfer of learning in multistage training programs.
Personnel Psychology, 55,
851-869.
117. Holton, E. F., III. (1996). The flawed four-level evaluation
model. Human Resource
Development Quarterly, 7(1), 5-21.
Holton, E. F., III, Bates, R. A., & Ruona, W.E.A. (2000).
Development of a generalized
learning transfer system inventory. Human Resource
Development Quarterly, 11(4),
333-360.
Khasawneh, S. A. (2004). Construct validation of an Arabic
version of the learning
transfer system inventory for use in Jordan. Unpublished
doctoral dissertation, Loui-
siana State University, Baton Rouge.
Kirkpatrick, D. L. (1998). Evaluating training programs: The
four levels (2nd ed.). San
Francisco: Berrett-Koehler.
Kirkpatrick, D. (1995). Techniques for evaluating training
programs. Journal of the
American Society for Training and Development, 13, 3-9.
LePine, J. A., Colquitt, J. A., & Erez, M. (2000). Adaptability
to changing task contexts:
Effects of general cognitive ability, conscientiousness, and
openness to experience.
Personnel Psychology, 53, 563-593.
Montesino, M. U. (2002). Strategic alignment of training,
transfer-enhancing behaviors,
and training usage: A post training study. Human Resource
Development Quarterly,
13, 89-108.
118. Morgan, R. B., & Casper, W. J. (2000). Examining the factor
structure of participant reac-
tions to training: A multidimensional approach. Human
Resource Development
Quarterly, 11(3), 301-317.
Naquin, S. S., & Holton, E. F., III. (2002). The effects of
personality, affectivity, and work
commitment on motivation to improve work through learning.
Human Resource
Development Quarterly, 13, 357-376.
Naquin, S. S., & Holton, E. F., III. (2003). Motivation to
improve work through learning
in human resource development. Human Resource Development
International, 6,
355-370.
Noe, R. A., & Schmitt, N. (1986). The influence of trainee
attitudes on training effective-
ness: Test of a model. Personnel Psychology, 39, 497-523.
Holton / HOLTON’S EVALUATION MODEL 53
at AHRD on January 26, 2016adh.sagepub.comDownloaded
from
http://adh.sagepub.com/
Ruona, W.E.A., Leimbach, M., Holton, E. F., III, & Bates, R. A.
(2002). The relationship
between learner utility reactions and predicted learning transfer
among trainees.
International Journal of Training and Development, 6(4), 218-
228.
119. Seyler, D. L., Holton, E. F., III, Bates, R. A., Burnett, M. F., &
Carvalho, M. B. (1998).
Factors affecting motivation to transfer training. International
Journal of Training
and Development, 2, 2-16.
Swanson, R. A., & Holton, E. F., III. (1999). Results: How to
assess performance, learn-
ing and perceptions in organizations. San Francisco: Berrett-
Koehler.
Tan, J. A., Hall, R. J., & Boyce, C. (2003). The role of
employee reactions in predicting
training effectiveness. Human Resource Development Quarterly,
14, 397-411.
Yamnill, S. (2001). Factors affecting transfer of training in
Thailand. Unpublished doc-
toral dissertation, University of Minnesota, Twin Cities.
Elwood F. Holton, III, is the Jones S. Davis Distinguished
Professor of Human
Resource, Leadership and Organization Development at
Louisiana State University.
He has authored 19 books and more than 200 articles in HRD.
He was the founding
editor of Human Resource Development Review as well as the
president of the
Academy of Human Resource Development. He received the
AHRD Outstanding
Scholar Award in 2001.
Holton, E. F., III. (2005). Holton’s evaluation model: New
evidence and construct
elaborations. Advances in Developing Human Resources, 7(1),
120. 37-54.
54 Advances in Developing Human Resources Febr uar y 2005
at AHRD on January 26, 2016adh.sagepub.comDownloaded
from
http://adh.sagepub.com/
Article Critiques
Objectives
This assignment is designed for students’ self-directed learning
regarding the subject of program evaluation and analysis.
Among others, the objectives include
1. Conduct research oriented learning
1. Practice analytical and critical thinking Assignments
You need to identify a peer-reviewed published paper on the
subject of HRD/Tech measurement and evaluation and following
the requirement below. You may choose any article in the
reading list of this course. You may also select articles outside
the reading list as long as they are relevant to the topic of this
course. (Note: Please do not use articles from general or
commercial websites. It has to have a journal title and
volume/issue and page numbers.)
Requirements:
1. Begin the Critiques with a complete bibliographic citation in
proper APA style [Author, (year of publication). Article title.
Journal Title, volume (issue), page range]. APA style is
established by American Psychological Association for all
psychology related fields. For detailed APA requirements,
please visit www.apastyle.org.
1. Briefly summarize why the article is important for students
measurement and evaluation (M&E) in HRD 5307. (e.g., How
does it relate to M&E in HRD? Why is it important to enhance
121. our understanding in M&E? How important is the article to the
field of HRD?)
1. Summarize the article’s content: No more than 2 pages and
use your own words to paraphrase. Please avoid copying from
the article abstract.
1. Discuss the practical applications (if any) of the article for
practitioners. What should they be able to do or to learn
regarding M&E after reading the article?
1. Be sure to critique the article, discuss any weaknesses or any
occasions when you think the author’s theory, model, process or
ideas won’t work and explain why with literature support. Note
that a major portion of your grade will depend on the quality of
your critiques.
1. The paper should be at least 6 double-spaced typed pages in
length excluding cover page. 20 percent points will be deducted
for late submissions (all critiques must be completed to receive
a grade for the assignment).
1. You are strongly encouraged to reference additional research
or articles for a high quality paper. Please structure your
writing with headings and subheadings.
RESEARCH PROJECT AND PAPER
The goal of the project and paper is for you: 1) to experience in
groups the process of reviewing the literature
and designing and conducting your own study, and 2) to learn
individually to write a research report and
critically evaluate strengths and weaknesses of research
methods based on the experience with your study.
OVERVIEW
You will work in a small group (3-4 people) to design and
122. conduct a simple study about a
communication topic (some example topics that would be suited
to a simple study appear on GauchoSpace).
You will decide as a group which topic to study and whether it
would be appropriate to conduct a survey or
an experiment to investigate your topic.
You and your group members (with some guidance from your
TA) will together research the
literature, propose hypotheses/research questions, select a
design, construct measures, and collect and
analyze data. You will then, ON YOUR OWN, write a 7 - 8
page paper describing what your study was, what
the findings were, and what were the methodological strengths
and weaknesses.
SPECIFICS
Part I – The Project: WITH YOUR GROUP, you must do the
following:
Step 1) Find at least two empirical studies in academic
journals that will provide you with some background
on your topic and that will help you develop the hypotheses and
research questions for your study.
EVERY topic has relevant literature to find (if you find none,
you’ll need either to switch topics or be
more creative in your use of the studies that are there!)
Step 2) Develop at least two hypotheses (i.e., two different
predictions, involving different variables) that you
will attempt to test in your study. Your hypotheses MUST be
based on the literature (i.e., the
empirical studies that you find!). In other words, you must
provide justification from the scientific
literature for what you are predicting! You may also include a
123. research question for some additional
variables that you would like to include/investigate as part of
your study.
Step 3) Develop a research design that helps you test your
hypothesis (i.e., a survey or experiment). --
Steps 2 & 3 may be done simultaneously, as your design should
be guided by the hypotheses you
would like to test. Some designs are better suited to certain
questions/hypotheses than are others.
For example, if you want to examine the relationship between
texting and relationship closeness, a
survey might be appropriate, whereas if you want to know the
effects of texting on perceptions of
relational messages, you would most likely conduct an
experiment.
Step 4) Construct measurement instruments (e.g.,
questionnaire items) and gather other materials you will
need (e.g., experimental manipulations, stimulus videos, etc.).
When deciding how to construct your
measures, remember to consider how you will later analyze
them (i.e., how will you know if your
hypothesis was supported or not?).
Step 5) Collect data. Much of this can be done mid-quarter
during your discussion section, as many of you
will serve as each other's subjects, filling out each other's
surveys and participating in each other's
experiments. This means that you will need to bring copies of
your surveys and questionnaires,
etc., to the relevant sections in order to collect data. Often it is
also necessary to collect data
outside of section, particularly for those studies that need more
male subjects or non-student
populations. REMEMBER TO FOLLOW THE “RULES FOR 88
124. PROJECTS” document!!
Step 6) Compile data and interpret results. You are
encouraged to analyze your data statistically (i.e., see if
your data produce significant differences between group means
or significant correlations between
variables). However, you are not required to use statistics (i.e.,
you may “eyeball” your data in order
to compare means, etc.). Your TA will help you identify what
type of analysis is appropriate for your
study, but most likely you will either compute means (averages)
for your scale items and compare
the means, or you will compute simple correlations among your
variables.
Part II – The Paper: ON YOUR OWN, you will write a paper
that should have FOUR sections:
INTRODUCTION (note that this section doesn’t actually get
its own labeled heading like the others do)
In this first section, you should introduce your topic, review
the literature (the two or more empirical
studies), and state your hypotheses and any additional research
question(s). As you review the
literature, be sure that for each empirical study you briefly
summarize what the study did and describe
the main findings that are relevant to your own study (do not
just pull quotes from the article!). Use the
studies to provide justification for your hypotheses and/or
background for your research questions. It is
important to explain why you are making your prediction(s) and
posing your question(s).
125. METHOD
In the Method section, you should describe specifically what
you did in your study. Using the appropriate
subheadings for your particular study (e.g., sample, procedure,
measures, etc.), you should describe
the overall design, participants, procedure, and variables
(including how they were
operationalized/measured). If you combined several items into
a scale for a particular DV, then describe
that in this section too. You don’t need to write out every
single item in the text of your paper, but give a
couple example items and then direct your reader to the
appendix for the rest (be sure include as an
appendix a copy of any questionnaires or other materials you
used). The content of this section will likely
be very similar for all the members of your group, but the
writing should be in your own words!
RESULTS
In this section you should briefly report what kind of data
analysis you did (e.g., you computed means on
your DV for the different IV groups, or you computed a
correlation between your IV and DV scales), and
then report the resulting data. In other words, report
differences in mean scores between people in
different groups or experimental conditions (e.g., on question
X., men on average scored 5.2 while
women scored 6.8), or report r values for correlations between
variables, etc. You may find that tables or
graphs are useful ways of presenting means and/or percentages.
126. DISCUSSION
This is the most important section! Here you need to interpret
your findings and critique your study.
First, what can you conclude on the basis of your findings?
In other words, were your hypotheses
supported (and if you posed a research question, what was the
answer)? Do the findings relate or
not relate to the previous research you examined (and why or
why not, do you think)? NOTE that
your actual results (what you found) DO NOT AFFECT your
grade—it’s what you SAY about
your results, etc., that matters!
Second, what were the STRENGTHS and WEAKNESSES of
the methodological decisions you made in
your study? What effect(s) do you think your design, your
sample, and/or your measures had on
your results? Note that different issues are important to discuss
in this section depending on what
kind of study you did (experiment or survey). For example,
proper sampling is more important for
surveys, whereas proper random assignment is more crucial for
experiments. Refer back to your
lecture notes or the appropriate textbook chapter to review the
specific issues relevant to your type of
study. Some issues you may want to consider here are:
operationalization (e.g., How might your
definitions/measures have affected your results?); internal
and/or external validity (e.g., How well are
you able to make causal statements [if you are trying to]? How
well are you able to generalize
beyond your sample or to other settings/conditions?). The best
papers will be ones that discuss the
most relevant issues and that provide the most interesting
127. insight and thorough use of course
material.
Finally, suggest ways in which the study could be improved
upon or supported further by future research
(e.g., better definitions, other methods for addressing the topic).
REQUIREMENTS AND POLICIES
See next page for important rules and tips about format, writing
style, grading, late papers, etc.…
REQUIREMENTS AND POLICIES
FORMAT: The paper should be 7-8 pages of text (not counting
title page, references, appendices, graphs).
It should be typed, double-spaced, page-numbered, with roughly
1" margins and Times 12 pt font! Note
that Word’s default settings are usually wrong for this
assignment (margins too big, font too small, extra
line spaces inserted after paragraphs, etc.), so you’ll need to
change these settings! Include a title page
with your name and your TA’s name/section clearly identified
(but do not put your name anywhere else in
the paper, as your TA will be grading “blindly”). You do not
need an “abstract” section, but you should
repeat the title of the paper at the top of the first page of text
(so that your TA can see your title without
knowing who wrote the paper).
128. WRITING STYLE: Your goal is to show that you have learned
the principles of this course and that you can
use the language of this course in appropriate and meaningful
ways! You are reporting on your research
as though it were a “real” study, so you should sound like a
social scientist. Try to avoid “I/we” language
and other ways of sounding too colloquial/casual. But don’t
just throw in big words or convoluted
sentences to try to sound “academic” either, as this usually ends
up just not making sense. The goal is
to present your study and your critique of your study with
CLARITY and AUTHORITY!
APA STYLE CITATIONS and PLAGIARISM: Since this
assignment requires you to make good use of the
thoughts, writings, and work of others, proper citations are
essential. Your paper must follow APA
style for citations within the text of your paper, as well as for
your reference list. You will find some
guidelines for APA style in your reader, you will likely also
have an APA style exercise in section, and
you are encouraged to follow the example you see in most
communication or psychology journal articles.
Plagiarism will result minimally in a zero grade, and will likely
also result in a failing grade in the
course and further disciplinary action.
Be especially carefully not to “borrow” from another student’s
paper, as this is also plagiarism (whether or
not specific words have been changed). I strongly suggest that
you do not even READ a portion of one
your group member’s papers (even just for “ideas”), as it is very
difficult to word things differently once
you’ve seen how someone else has done it. Although the
project was designed and conducted as a
group, the WRITING of the paper (including the ideas) must be
129. entirely YOUR OWN!
TURNING IN PAPERS: Unless your TA officially informs you
differently, paper assignments are due in hard
copy version on the designated date in lecture (see syllabus and
course schedule). Electronic versions
of papers are not accepted, except in the case of verifiable
emergency and with the permission your TA.
Late papers are marked down 5 points per day (note that if your
paper is late, it will be considered
“turned in” when the TA receives the paper). Always keep a
copy of your paper on hand for your
records, and remember that it is your responsibility to see that
your TA receives your paper! In
cases of serious emergency, you must notify your TA and
Professor Matni immediately, and we will
proceed from there, depending on the severity and verifiability
of the emergency.
Note also that if you do not turn in the research paper, you will
fail the course (regardless of your other
scores), and you will not be permitted to take the final exam.
GRADING: Your score will be based on how well your paper
shows, compared to the papers of other
students, accurate and thorough understanding of your study and
of course material and outside
research, depth and effectiveness at articulating and supporting
your criticisms, university level writing
style and organization, and adherence to the assignment. Note
that we DO NOT DEDUCT points from
your paper, but rather you EARN points for writing with clearer
understanding and for making better,
stronger, more insightful arguments than other papers do. The
“average” papers receive the equivalent
of about a B-/C+ grade (the “median” score), and we go up and
130. down from there (with the top scores
being given to the BEST papers). And remember that your
actual results (what you found) DO NOT
DETERMINE your grade—it’s what you SAY about your results
that matters.
I wish you much success with your project and paper!
RUNNING HEAD: Shortened Version of Your Title
Your Title [should be descriptive of your study]
Author [your name -- INCLUDE ONLY ON HARD COPY
VERSION]
Perm [your 7-digit perm #]
Comm 88
Fall 2016
TA: [Your TA’s Name]
University of California, Santa Barbara
[Reminder—You do not need to write an “Abstract” for your
study]
A Running Head is optional
131. for this paper
This document is a “mock up” of the
Comm 88 paper format, with some tips
and help for each of the sections included.
The gray “side bar” to the right is where
you will see reminders of the official
instructions for the assignment for each
section (be sure to review these!)
RUNNING HEAD: Shortened Version of Your Title 1
Your Title Again Here
Start with the introduction, which does not need its own
heading. Your opening
paragraph should tell the issue that you are investigating and
why it needs to be investigated.
Remember, scholarly writing (throughout the paper) should be
clear, succinct, and avoid using “I”
or “We”. One way to do this is to use other ways to refer to
your study, such as “The present
132. study investigates…” (as opposed to “We wanted to
investigate…”). You can also use the
passive voice (as long as you don’t overdo it), such as “An
experiment was conducted…” (as
opposed to “We conducted an experiment…”).
Next in this section is where you’re going to do your literature
review and summarize
your (minimum TWO) empirical studies. You probably do not
need any subheadings in this
section since your literature review is smaller than what would
appear in published studies. For
each study, you should report what it was about, what they did,
and what they found (see .
Your studies DO NOT have to be exactly the same as your
groupmates’; it’s possible
they’re not the same studies you brought in earlier in the
quarter. They MUST be relevant to
your hypotheses, and you MUST include copies of the abstracts
in an appendix at the end of your
paper.
Be sure then to tie the findings to your own study! If you are
using conceptual
definitions of variables from the prior studies, discuss that here
133. too (some variables need more
conceptualization than others). Use the studies to provide a
rationale for your hypotheses—a
clear argument for why, based on logic and the prior research,
you are predicting the specific
relationships between variables in your study. Your hypotheses
DO NOT have to be exactly the
same as your groupmates’. Here’s an example of what your
hypotheses might look like (one is
associational and one is causal, just to give you an example of
each—but yours will be different
Page #1 starts here (the title
page does not count as a page!)
Comment [DM1]: Reminder of the
assignment instructions on GS for this
section:
INTRODUCTION (note that this section
doesn’t actually get its own labeled
heading like the others do)
In this first section, you should introduce
your topic, review the literature (the two or
more empirical studies), and state your
hypotheses and any additional research
question(s). As you review the literature,
be sure that for each empirical study you
briefly summarize what the study did and
134. describe the main findings that are
relevant to your own study (do not just pull
quotes from the article!). Use the studies
to provide justification for your hypotheses
and/or background for your research
questions. It is important to explain why
you are making your prediction(s) and
posing your question(s).
RUNNING HEAD: Shortened Version of Your Title 2
depending on what kind of study you did). Be sure to put each
hypothesis/research question on
its own line, indented like this:
H1: There will be a positive relationship between amount of
communication and
satisfaction in a relationship.
H2: Participants who see an objectifying ad will report lower
self-esteem than
participants who see an empowering ad.
Note that your hyps do not have to be grouped together like this
(especially if you have a
different rationale for each one), and they do not have to be
135. placed at the end of this section. The
placement of hypotheses and research questions depend on how
you organize your literature
review and rationale.
Method
This section is where you describe what you did in your study.
It will have several
subheadings, but the particular headings you use will vary
depending on what kind of study you
did. Here are some typical subheadings that are useful:
Sample
Report your sampling technique (e.g., convenience sample), and
how you gathered it (e.g., sent
survey links to Facebook friends, etc.). Describe your sample
(e.g., how many participants total?
What were the demographics--e.g., gender, age, race--if you
collected info on that).
Procedure
Describe the basic procedure for your study. If you did a
survey, this just means a simple
statement of how you distributed or collected your survey data
(in person, online, etc.). If you
136. did an experiment, identify what the separate conditions were
for your IV (i.e., what was the
manipulation?). Did you use a factorial design? How were
participants assigned to conditions?
If you showed/created anything to show to your subjects
(whether for a survey or an experiment),
Comment [DM2]: Reminder of the
assignment instructions on GS for this
section:
In the Method section, you should
describe specifically what you did in your
study. Using the appropriate
subheadings for your particular study
(e.g., sample, procedure, measures, etc.),
you should describe the overall design,
participants, procedure, and variables
(including how they were
operationalized/measured). If you
combined several items into a scale for a
particular DV, then describe that in this
section too. You don’t need to write out
every single item in the text of your paper,
but give a couple example items and then
direct your reader to the appendix for the
rest (be sure include as an appendix a
copy of any questionnaires or other
materials you used). The content of this
section will likely be very similar for all the
members of your group, but the writing
should be in your own words!
137. RUNNING HEAD: Shortened Version of Your Title 3
it would also help to have a separate heading and section for
“stimulus materials” where you can
describe them (and also add them as an Appendix).
Measures
If you did a survey, it is helpful to split this section up into IVs
and DVs. How were your IVs
operationalized? How were your DVs operationalized? If you
did an experiment, you should
describe your IV in an earlier section (see above), so this
section would be for “Dependent
Measures.”
What kind of scales did you use (e.g., Likert, semantic
differential, etc.)? How many points were
on the scale (e.g., 5, 7, 9…)? If you used an existing measure
(e.g., the Big Five Inventory) cite
where you found it. Include examples of specific questionnaire
items that were used for each
variable, and then direct your reader to an Appendix to see the
complete wording of items.
138. Results
Explain what kind of data analysis you did (e.g., correlation)
and report your results. It
tends to be helpful if you restate a hypothesis first (e.g., “H1
predicted that…”) and then how
your analyses supported it or not (e.g., “Analyses of the mean
scores do not support this
hypothesis. Specifically,…”). Be sure to report the key
numbers. You can either 1) insert
numbers within the text itself (such as “Perception of credibility
was higher for those who saw
the humorous speaker (M = 3.45) than for those who saw the
boring speaker (M = 2.12)”; or “A
positive correlation (r = .37) was found between credibility and
likability…”); or 2) put the
actual numbers in a table or graph (e.g., “Table 1 shows the
mean scores for…”) and just
describe the results within the text like the examples above. The
tables and graphs themselves
should be attached as separate pages at the END of your paper,
so that they do not take up
valuable space for writing.
139. Comment [DM3]: Reminder of the
assignment instructions on GS for this
section:
In this section you should briefly report what
kind of data analysis you did (e.g., you
computed means on your DV for the different
IV groups, or you computed a correlation
between your IV and DV scales), and then
report the resulting data. In other words, report
differences in mean scores between people in
different groups or experimental conditions
(e.g., on question X., men on average scored
5.2 while women scored 6.8), or report r values
for correlations between variables, etc. You
may find that tables or graphs are useful ways
of presenting means and/or percentages.
RUNNING HEAD: Shortened Version of Your Title 4
Remember that hypotheses aren’t “proven true”, rather, they are
140. “supported” or
“evidence was found for”… Also, save for the discussion
section any comments you have about
why you may have gotten the results that you got.
Discussion
**THIS IS THE MOST IMPORTANT SECTION OF THE
PAPER**!! Remember it
doesn’t matter what your results were (such as whether or not
your hypotheses were supported,
etc); what’s important is that you can use course terms to
intelligently discuss your findings and
critique the strengths and weaknesses of your study.
Summarize your findings and explain what they mean. Don’t
repeat the numbers, but
rather explain what the implications are for your findings (Are
your results consistent with or
contradictory to the studies that you used as the basis for your
hypotheses? Why or why not?).
If your hypotheses were not supported (or some were and some
weren’t), can you explain why
not? Your explanation of your findings can be a nice lead-in to
the critique of your study,
141. because some of your study’s limitations may provide an
explanation or insightful understanding
of your findings. That can usually make for a more meaningful
discussion section than just
having a separate part of your discussion where your
list/describe strengths and weaknesses as
separate things that have no connection to your findings.
As you identify strengths and weaknesses, try to avoid just
inserting course terms when
they don’t really relate. Instead think critically about your
study. Dig deep to show that you fully
understand the ins and outs of the scientific process and can
apply the appropriate terms
insightfully. Explain what might have gone wrong or what
could’ve been done differently (where
appropriate, and especially if you can tie those issues to your
findings), and then finally give
suggestions for future research.
Comment [DM4]: Reminder of the
assignment instructions on GS for this
section:
This is the most important section!
Here you need to interpret your findings
and critique your study.
142. First, what can you conclude on the
basis of your findings? In other words,
were your hypotheses supported (and if
you posed a research question, what
was the answer)? Do the findings relate
or not relate to the previous research
you examined (and why or why not, do
you think)? NOTE that your actual
results (what you found) DO NOT
AFFECT your grade—it’s what you
SAY about your results, etc., that
matters!
Second, what were the
STRENGTHS and WEAKNESSES of
the methodological decisions you made
in your study? What effect(s) do you
think your design, your sample, and/or
your measures had on your results?
Note that different issues are important
to discuss in this section depending on
what kind of study you did (experiment
or survey). For example, proper
sampling is more important for surveys,
whereas proper random assignment is
more crucial for experiments. Refer
back to your lecture notes or the
appropriate textbook chapter to review
the specific issues relevant to your type
of study. Some issues you may want to
consider here are: operationalization
(e.g., How might your
definitions/measures have affected your
results?); internal and/or external validity
(e.g., How well are you able to make
143. causal statements [if you are trying to]?
How well are you able to generalize
beyond your sample or to other
settings/conditions?). The best papers
will be ones that discuss the most
relevant issues and that provide the
most interesting insight and thorough
use of course material.
Finally, suggest ways in which the
study could be improved upon or supported
further by future research (e.g., better
definitions, other methods for addressing the
topic).
RUNNING HEAD: Shortened Version of Your Title 5
References
Last Name, F. M. (Year). Article Title. Journal Title, Pages
From - To.
Last Name, F. M. (Year). Book Title. City Name: Publisher
Name.
144. Comment [DM5]: See the APA help
documents posted on GauchoSpace for
formatting help.
RUNNING HEAD: Shortened Version of Your Title 6
Tables and Graphs
Insert your tables and graphs on a separate page that comes
after your References.
RUNNING HEAD: Shortened Version of Your Title 7
Appendix A
Questionnaires/measures should be attached as an appendix.
You may also need to add more
appendices for other printed materials, such as stimulus
materials for an experimental
manipulation (advertisements, facebook threads, etc.).
Form Responses 1Response
#ScoreAge:Gender:Ethnicity:Question OneQuestion
TwoQuestion threeMeaning of songPrefer musictype of
musicpoints
earned10211311120233022000002020402110111241350271101