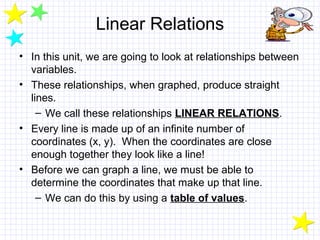
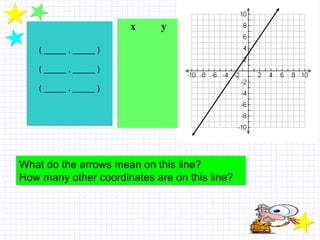
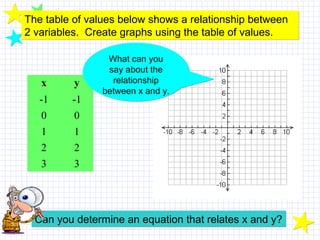
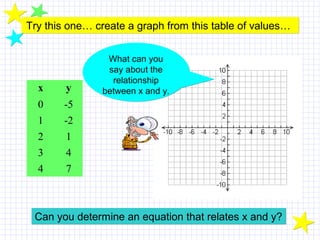
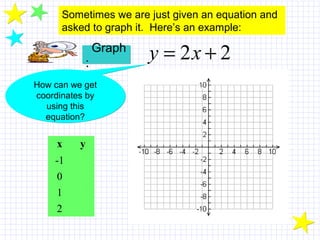
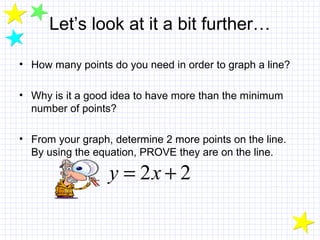
2. Linear Relations
• In this unit, we are going to look at relationships between
variables.
• These relationships, when graphed, produce straight
lines.
– We call these relationships LINEAR RELATIONS.
• Every line is made up of an infinite number of
coordinates (x, y). When the coordinates are close
enough together they look like a line!
• Before we can graph a line, we must be able to
determine the coordinates that make up that line.
– We can do this by using a table of values.
3. x y
What do the arrows mean on this line?
How many other coordinates are on this line?
What do the arrows mean on this line?
How many other coordinates are on this line?
( _____ , _____ )
( _____ , _____ )
( _____ , _____ )
( _____ , _____ )
( _____ , _____ )
( _____ , _____ )
4. x y
-1 -1
0 0
1 1
2 2
3 3
Can you determine an equation that relates x and y?Can you determine an equation that relates x and y?
What can you
say about the
relationship
between x and y.
What can you
say about the
relationship
between x and y.
The table of values below shows a relationship between
2 variables. Create graphs using the table of values.
The table of values below shows a relationship between
2 variables. Create graphs using the table of values.
5. Can you determine an equation that relates x and y?Can you determine an equation that relates x and y?
What can you
say about the
relationship
between x and y.
What can you
say about the
relationship
between x and y.
Try this one… create a graph from this table of values…Try this one… create a graph from this table of values…
x y
0 -5
1 -2
2 1
3 4
4 7
6. 2 2y x= +
Sometimes we are just given an equation and
asked to graph it. Here’s an example:
Graph
:
Graph
:
x y
-1
0
1
2
How can we get
coordinates by
using this
equation?
How can we get
coordinates by
using this
equation?
7. Let’s look at it a bit further…
• How many points do you need in order to graph a line?
• Why is it a good idea to have more than the minimum
number of points?
• From your graph, determine 2 more points on the line.
By using the equation, PROVE they are on the line.
2 2y x= +
8. Example (if needed)
• The first 4 rectangles in a pattern are shown below. The
pattern continues. Each small square has a side length
of 1 cm.
• The perimeter of the rectangle is related to the rectangle
number.
• Express the relationship between the perimeter and the
rectangle number using words, a table of values, an
equation and a graph.
#2 #4#3#1
9. Using a Table of Values
Rectangle
Number, n
Perimeter, p (cm)
1
2
3
4
4 2(2) 8+ =
4 2(3) 10+ =
“As the rectangle
number increases
by 1, the perimeter
increases by 2 cm.”
“As the rectangle
number increases
by 1, the perimeter
increases by 2 cm.”
4 2(1) 6+ =
4 2(4) 12+ =
What is an
equation that
represents this
data?
What is an
equation that
represents this
data?
2 4P n= +
10. Using a Graph
Graph of P against n
6
8
10
12
0
2
4
6
8
10
12
14
0 1 2 3 4 5
n (number of squares)
P(perimeter)
Clearly label each
axis (in this case P
and n). Also, label
your scale (go up
by 1’s, 2’s, 5’s,
etc.)
Clearly label each
axis (in this case P
and n). Also, label
your scale (go up
by 1’s, 2’s, 5’s,
etc.)
Don’t forget your title!Don’t forget your title!
To determine whether
or not to connect the
points, ask yourself if
the points in between
‘matter’.
To determine whether
or not to connect the
points, ask yourself if
the points in between
‘matter’.
Independent variable is on the x-
axis
Independent variable is on the x-
axis
Dependent variable is on the y-axisDependent variable is on the y-axis