The document provides information about direct and inverse variation, including:
1) Examples of direct variation relationships involving weeks in a year, minutes in an hour, and feet in an inch. Equations are given to represent these relationships.
2) Examples are worked through using the direct variation equations to find requested values involving hours in days and inches in a cabinet.
3) Key properties of direct variation are described, such as what happens when one quantity doubles or decreases while the other stays the same.
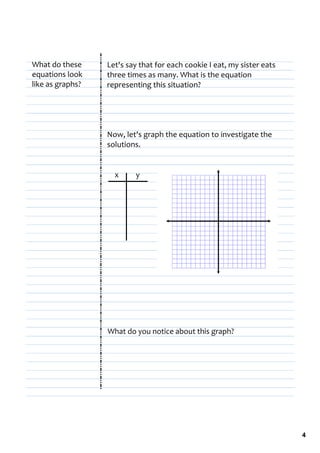
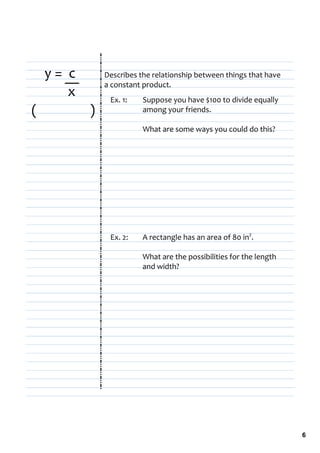
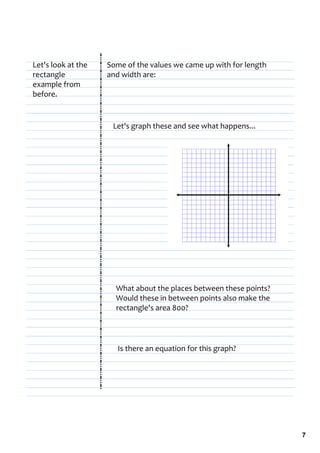
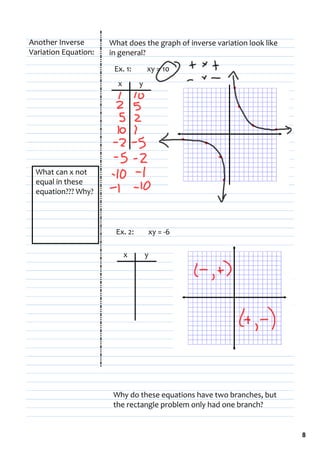
4) An example of an inverse variation relationship involving the area of a rectangle and length/width is given, and the graph of this relationship is discussed.