Download to read offline

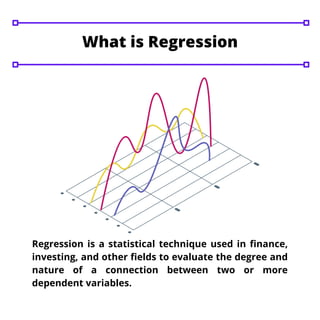
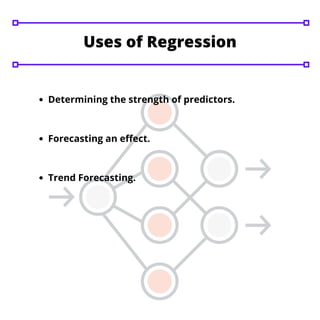
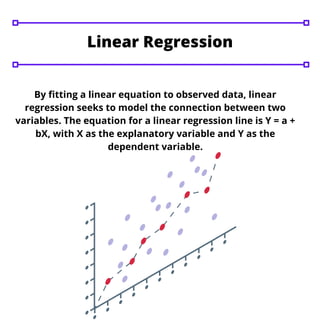
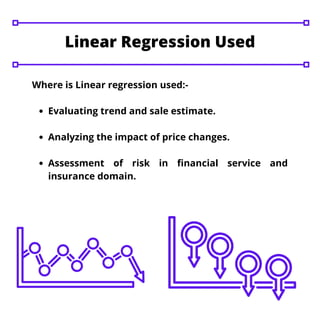
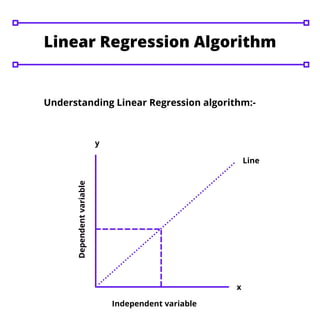
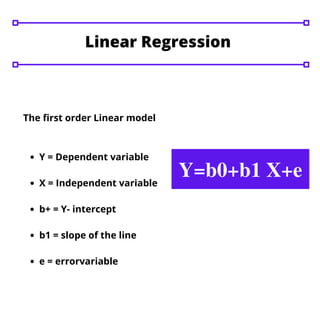

Linear regression is a statistical technique used to model the relationship between variables and predict future outcomes. It fits a linear equation to observed data to represent the connection between a dependent variable and one or more independent variables. Linear regression can be used for tasks like evaluating trends, forecasting effects, analyzing the impact of changes, and assessing risks.