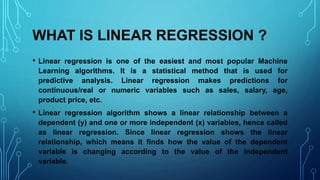
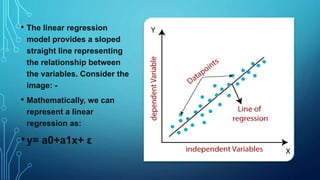
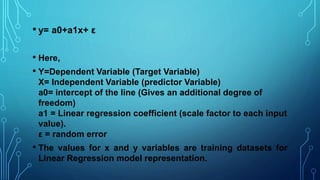
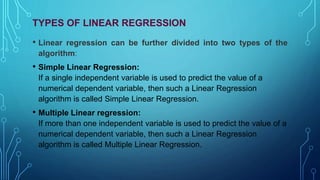
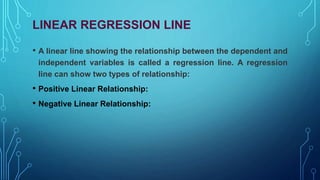
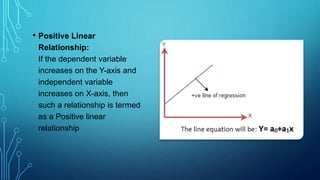
LINEAR REGRESSION
GUIDED BY – PROF. DHIRAJ KUMAR
WHAT IS LINEAR REGRESSION ?
• Linear regression is one of the easiest and most popular Machine
Learning algorithms. It is a statistical method that is used for
predictive analysis. Linear regression makes predictions for
continuous/real or numeric variables such as sales, salary, age,
product price, etc.
• Linear regression algorithm shows a linear relationship between a
dependent (y) and one or more independent (x) variables, hence called
as linear regression. Since linear regression shows the linear
relationship, which means it finds how the value of the dependent
variable is changing according to the value of the independent
variable.
• The linear regression
model provides a sloped
straight line representing
the relationship between
the variables. Consider the
image: -
• Mathematically, we can
represent a linear
regression as:
•y= a0+a1x+ ε
• y= a0+a1x+ ε
• Here,
• Y=Dependent Variable (Target Variable)
X= Independent Variable (predictor Variable)
a0= intercept of the line (Gives an additional degree of
freedom)
a1 = Linear regression coefficient (scale factor to each input
value).
ε = random error
• The values for x and y variables are training datasets for
Linear Regression model representation.
TYPES OF LINEAR REGRESSION
• Linear regression can be further divided into two types of the
algorithm:
• Simple Linear Regression:
If a single independent variable is used to predict the value of a
numerical dependent variable, then such a Linear Regression
algorithm is called Simple Linear Regression.
• Multiple Linear regression:
If more than one independent variable is used to predict the value of a
numerical dependent variable, then such a Linear Regression
algorithm is called Multiple Linear Regression.
LINEAR REGRESSION LINE
• A linear line showing the relationship between the dependent and
independent variables is called a regression line. A regression
line can show two types of relationship:
• Positive Linear Relationship:
• Negative Linear Relationship:
• Positive Linear
Relationship:
If the dependent variable
increases on the Y-axis and
independent variable
increases on X-axis, then
such a relationship is termed
as a Positive linear
relationship
• Negative Linear
Relationship:
If the dependent variable
decreases on the Y-axis and
independent variable
increases on the X-axis, then
such a relationship is called a
negative linear relationship.
THANK YOU

Linear regression presentation explanation.pptx

  • 1.
    LINEAR REGRESSION GUIDED BY– PROF. DHIRAJ KUMAR
  • 2.
    WHAT IS LINEARREGRESSION ? • Linear regression is one of the easiest and most popular Machine Learning algorithms. It is a statistical method that is used for predictive analysis. Linear regression makes predictions for continuous/real or numeric variables such as sales, salary, age, product price, etc. • Linear regression algorithm shows a linear relationship between a dependent (y) and one or more independent (x) variables, hence called as linear regression. Since linear regression shows the linear relationship, which means it finds how the value of the dependent variable is changing according to the value of the independent variable.
  • 3.
    • The linearregression model provides a sloped straight line representing the relationship between the variables. Consider the image: - • Mathematically, we can represent a linear regression as: •y= a0+a1x+ ε
  • 4.
    • y= a0+a1x+ε • Here, • Y=Dependent Variable (Target Variable) X= Independent Variable (predictor Variable) a0= intercept of the line (Gives an additional degree of freedom) a1 = Linear regression coefficient (scale factor to each input value). ε = random error • The values for x and y variables are training datasets for Linear Regression model representation.
  • 5.
    TYPES OF LINEARREGRESSION • Linear regression can be further divided into two types of the algorithm: • Simple Linear Regression: If a single independent variable is used to predict the value of a numerical dependent variable, then such a Linear Regression algorithm is called Simple Linear Regression. • Multiple Linear regression: If more than one independent variable is used to predict the value of a numerical dependent variable, then such a Linear Regression algorithm is called Multiple Linear Regression.
  • 6.
    LINEAR REGRESSION LINE •A linear line showing the relationship between the dependent and independent variables is called a regression line. A regression line can show two types of relationship: • Positive Linear Relationship: • Negative Linear Relationship:
  • 7.
    • Positive Linear Relationship: Ifthe dependent variable increases on the Y-axis and independent variable increases on X-axis, then such a relationship is termed as a Positive linear relationship
  • 8.
    • Negative Linear Relationship: Ifthe dependent variable decreases on the Y-axis and independent variable increases on the X-axis, then such a relationship is called a negative linear relationship.
  • 9.