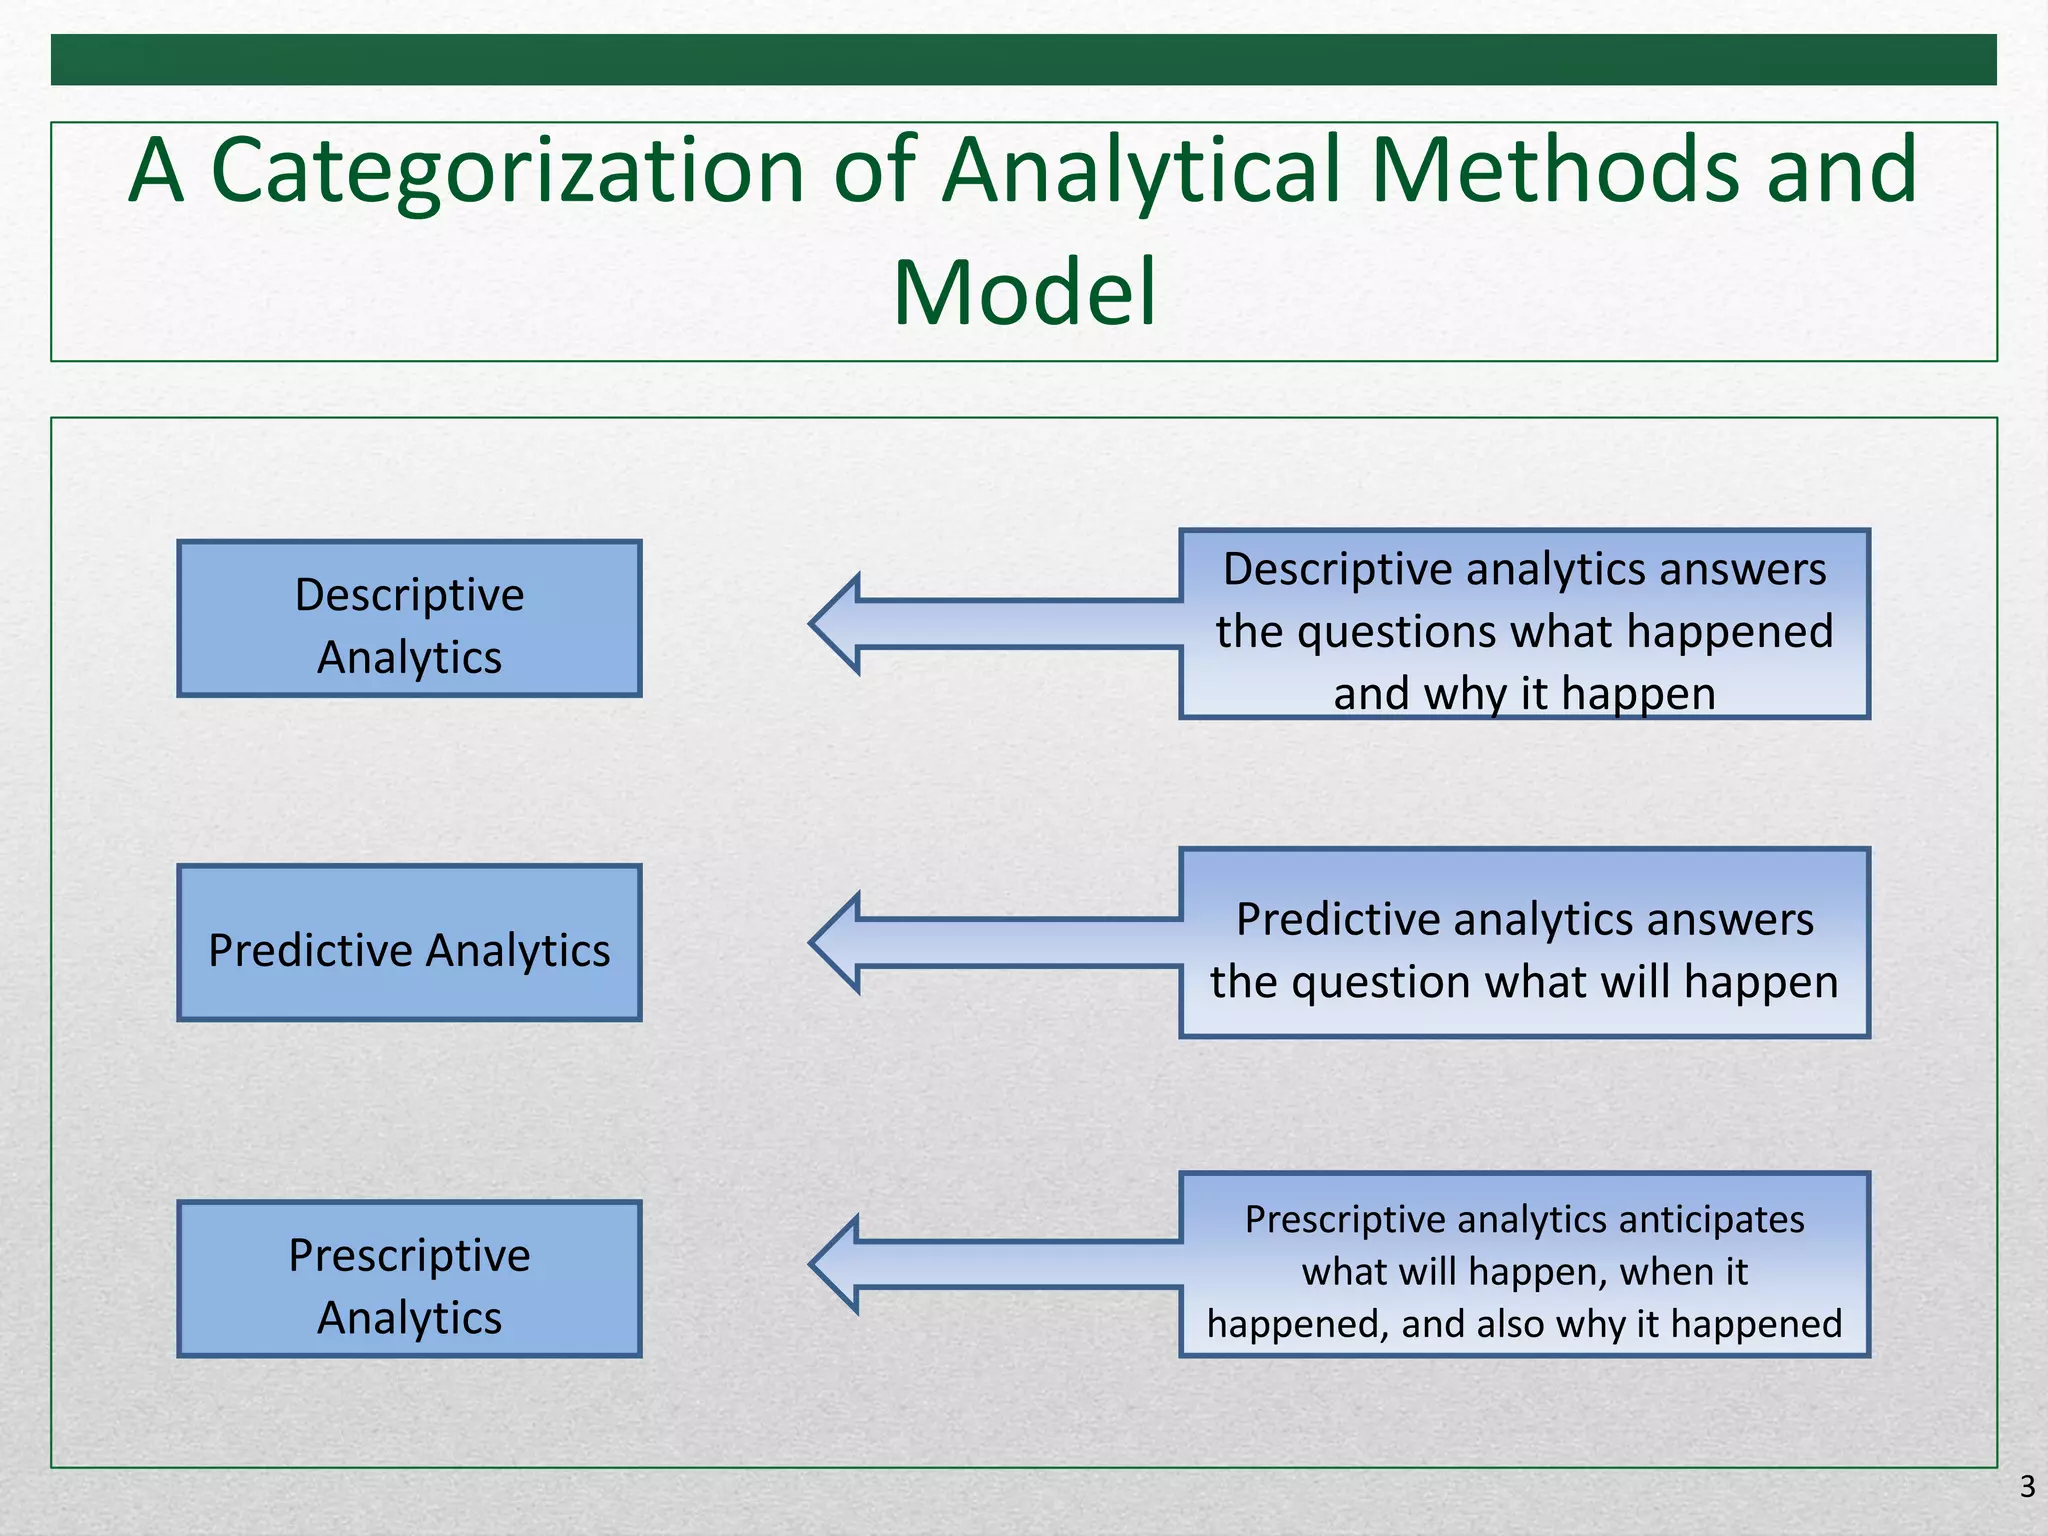
Descriptive, predictive, and prescriptive analytics are three categories of analytical methods. Descriptive analytics answers what happened using techniques like reports and dashboards. Predictive analytics uses models and techniques like data mining to predict the future. Prescriptive analytics provides recommendations for decisions using optimization and simulation models. Big data represents a large volume and variety of data that grows quickly from sources like the web, and presents challenges to analyze with traditional tools due to its size and complexity.
Data Analysis Methods 101 - Turning Raw Data Into Actionable InsightsDataSpace Academy
Data analytics is powerful for organisations. It can help companies improve their overall efficiency and effectiveness. The blog offers a step-by-step narration of the data analysis methods that will help you to comprehend the fundamentals of an analytics project.
BA is used to gain insights that inform business decisions and can be used to automate and optimize business processes. Data-driven companies treat their data as a corporate asset and leverage it for a competitive advantage. Successful business analytics depends on data quality, skilled analysts who understand the technologies and the business, and an organizational commitment to data-driven decision-making.
Business analytics examples
Business analytics techniques break down into two main areas. The first is basic business intelligence. This involves examining historical data to get a sense of how a business department, team or staff member performed over a particular time. This is a mature practice that most enterprises are fairly accomplished at using.
Predictive analytics encompasses a variety of statistical techniques from predictive modelling, machine learning, and data mining that analyze current and historical facts to make predictions about future or otherwise unknown events
Data analytics is the process of examining large and varied datasets to uncover hidden patterns, correlations, trends, and insights. It involves applying statistical and mathematical techniques, as well as computational tools and algorithms, to analyze data and derive meaningful conclusions.
It covers the basic of analytics, types of analytics, tools, and techniques of analytics, and a briefcase study to demonstrate the predictive analytics with decision tree algorithm of machine learning
In this presentation, let's have a look at What is Data Science and it's applications. We discussed most common use cases of Data Science.
I presented this at LSPE-IN meetup happened on 10th March 2018 at Walmart Global Technology Services.
Acetabularia Information For Class 9 .docxvaibhavrinwa19
Acetabularia acetabulum is a single-celled green alga that in its vegetative state is morphologically differentiated into a basal rhizoid and an axially elongated stalk, which bears whorls of branching hairs. The single diploid nucleus resides in the rhizoid.
Biological screening of herbal drugs: Introduction and Need for
Phyto-Pharmacological Screening, New Strategies for evaluating
Natural Products, In vitro evaluation techniques for Antioxidants, Antimicrobial and Anticancer drugs. In vivo evaluation techniques
for Anti-inflammatory, Antiulcer, Anticancer, Wound healing, Antidiabetic, Hepatoprotective, Cardio protective, Diuretics and
Antifertility, Toxicity studies as per OECD guidelines
Macroeconomics- Movie Location
This will be used as part of your Personal Professional Portfolio once graded.
Objective:
Prepare a presentation or a paper using research, basic comparative analysis, data organization and application of economic information. You will make an informed assessment of an economic climate outside of the United States to accomplish an entertainment industry objective.
Model Attribute Check Company Auto PropertyCeline George
In Odoo, the multi-company feature allows you to manage multiple companies within a single Odoo database instance. Each company can have its own configurations while still sharing common resources such as products, customers, and suppliers.
Introduction to AI for Nonprofits with Tapp NetworkTechSoup
Dive into the world of AI! Experts Jon Hill and Tareq Monaur will guide you through AI's role in enhancing nonprofit websites and basic marketing strategies, making it easy to understand and apply.
The French Revolution, which began in 1789, was a period of radical social and political upheaval in France. It marked the decline of absolute monarchies, the rise of secular and democratic republics, and the eventual rise of Napoleon Bonaparte. This revolutionary period is crucial in understanding the transition from feudalism to modernity in Europe.
For more information, visit-www.vavaclasses.com
The Roman Empire A Historical Colossus.pdfkaushalkr1407
The Roman Empire, a vast and enduring power, stands as one of history's most remarkable civilizations, leaving an indelible imprint on the world. It emerged from the Roman Republic, transitioning into an imperial powerhouse under the leadership of Augustus Caesar in 27 BCE. This transformation marked the beginning of an era defined by unprecedented territorial expansion, architectural marvels, and profound cultural influence.
The empire's roots lie in the city of Rome, founded, according to legend, by Romulus in 753 BCE. Over centuries, Rome evolved from a small settlement to a formidable republic, characterized by a complex political system with elected officials and checks on power. However, internal strife, class conflicts, and military ambitions paved the way for the end of the Republic. Julius Caesar’s dictatorship and subsequent assassination in 44 BCE created a power vacuum, leading to a civil war. Octavian, later Augustus, emerged victorious, heralding the Roman Empire’s birth.
Under Augustus, the empire experienced the Pax Romana, a 200-year period of relative peace and stability. Augustus reformed the military, established efficient administrative systems, and initiated grand construction projects. The empire's borders expanded, encompassing territories from Britain to Egypt and from Spain to the Euphrates. Roman legions, renowned for their discipline and engineering prowess, secured and maintained these vast territories, building roads, fortifications, and cities that facilitated control and integration.
The Roman Empire’s society was hierarchical, with a rigid class system. At the top were the patricians, wealthy elites who held significant political power. Below them were the plebeians, free citizens with limited political influence, and the vast numbers of slaves who formed the backbone of the economy. The family unit was central, governed by the paterfamilias, the male head who held absolute authority.
Culturally, the Romans were eclectic, absorbing and adapting elements from the civilizations they encountered, particularly the Greeks. Roman art, literature, and philosophy reflected this synthesis, creating a rich cultural tapestry. Latin, the Roman language, became the lingua franca of the Western world, influencing numerous modern languages.
Roman architecture and engineering achievements were monumental. They perfected the arch, vault, and dome, constructing enduring structures like the Colosseum, Pantheon, and aqueducts. These engineering marvels not only showcased Roman ingenuity but also served practical purposes, from public entertainment to water supply.
3. A Categorization of Analytical Methods and
Model
3
Descriptive
Analytics
Predictive Analytics
Prescriptive
Analytics
Descriptive analytics answers
the questions what happened
and why it happen
Predictive analytics answers
the question what will happen
Prescriptive analytics anticipates
what will happen, when it
happened, and also why it happened
4. A Categorization of Analytical Methods and
Model
• Descriptive analytics: It encompasses the set of techniques that
describes what has happened in the past.
Examples - data queries, reports, descriptive statistics, data
visualization (data dashboards), data-mining
techniques, and basic what-if spreadsheet
models.
• Data query - It is a request for information with certain
characteristics from a database.
4
5. A Categorization of Analytical Methods and
Model
• Data dashboards - Collections of tables, charts, maps, and
summary statistics that are updated as new data become
available.
• Uses of dashboards
• To help management monitor specific aspects of the company’s
performance related to their decision-making responsibilities.
• For corporate-level managers, daily data dashboards might summarize
sales by region, current inventory levels, and other company-wide
metrics.
• Front-line managers may view dashboards that contain metrics related
to staffing levels, local inventory levels, and short-term sales forecasts.
5
6. Process involved using Descriptive Analytics.
Data Analyze
(Descriptive
Model)
Provides and
Generate
Reports
Smart Decisions
7. ▪Descriptive analytics answers the questions what happened and
why it happened.
▪A sample picture shows data of the context of the source data
“Course Pro Campaign” used in a report.
7
8. A Categorization of Analytical Methods and
Model
• Predictive analytics: It consists of techniques that use models
constructed from past data to predict the future or ascertain the
impact of one variable on another.
• Survey data and past purchase behavior may be used to help
predict the market share of a new product.
8
9. A Categorization of Analytical Methods and
Model
• Techniques used in Predictive Analytics: contd.
9
• Used to find patterns or relationships among
elements of the data in a large database; often used
in predictive analytics.
Data mining
• It involves the use of probability and statistics to
construct a computer model to study the impact of
uncertainty on a decision.
Simulation
10. Process involved using Predictive
Analytics.
Data Analyze
(Predictive
Model)
Provides
Predictions and
Forecasting
Smart Decisions
11. ▪Predictive analytics answers the question what will happen, A
sample picture shows predictive analytics workbench. A predictive
analytics workbench allows a user to create, validate, manage, and
deploy predictive analytic models. A predictive analytics workbench
consists of these components
Predictive
Analytics
1
12. A Categorization of Analytical Methods and
Models
• Prescriptive Analytics: It indicates a best course of action to take
• Models used in prescriptive analytics:
12
• Models that give the best decision subject to constraints of the situation.
Optimization models
• Combines the use of probability and statistics to model uncertainty with
optimization techniques to find good decisions in highly complex and highly
uncertain settings.
Simulation optimization
• Used to develop an optimal strategy when a decision maker is faced with
several decision alternatives and an uncertain set of future events.
• It also employs utility theory, which assigns values to outcomes based on
the decision maker’s attitude toward risk, loss, and other factors.
Decision analysis
13. Process involved using Prescriptive
Analytics.
Data Analyze
(Prescriptive
Model)
Provides ,Generate
Recommendation
using Mathematical
Algorithms
Smart Decisions
14. ▪Prescriptive analytics not only anticipates what will happen and
when it will happen. but also why it will happen. Prescriptive
analytics software has the potential to help during each phase of the
oil and gas business through its ability to take in seismic data, well
log data, and their related data sets to prescribe where to drill, how
to drill there and how to minimize the environmental impact.
Prescriptive
Analytics
1
15. A Categorization of Analytical Methods and
Model
• Optimization models
15
Model Field Purpose
Portfolio models Finance Use historical investment return data to
determine the mix of investments that yield the
highest expected return while controlling or
limiting exposure to risk.
Supply network
design models
Operations Provide the cost-minimizing plant and distribution
center locations subject to meeting the customer
service requirements.
Price markdown
models
Retailing Uses historical data to yield revenue-maximizing
discount levels and the timing of discount offers
when goods have not sold as planned.
17. Big Data
• Big data: A set of data that cannot be managed, processed, or
analyzed with commonly available software in a reasonable
amount of time.
• Big data represents opportunities.
• It also presents analytical challenges from a processing point of
view and consequently has itself led to an increase in the use of
analytics.
• More companies are hiring data scientists who know how to
process and analyze massive amounts of data.
17
18. Big Data
18
BIG DATA is characterized
by a large volume of
different types of data (e.g.
social, web, transaction,
etc.) that builds very
quickly. It exceeds the
reach of commonly used
hardware environments
and software tools to
capture, manage and
process in a timely manner
for its users.
23. Type of Data
23
• Structured Data
➢ Stored in tabular format
➢ Clearly defined
➢ Data is stored in a pre-defined
data model
• Unstructured data
➢ No pre-defined structure
➢ No data model
➢ Data is irregular and ambiguous
• Semi-Structured Data
➢ It falls between structured and
unstructured data
➢ It is a combination of both
24. Characteristics of Big Data
24
• Volume – Data Size
• Velocity – Speed of
Change
• Variety – different forms
of Data Sources
• Veracity – Uncertainly of
Data
• Value – Business Value
25. Activity 1.2
1.What do you know about the term “Big
Data”?
1.How is big data analysis helpful in
increasing business revenue?
25