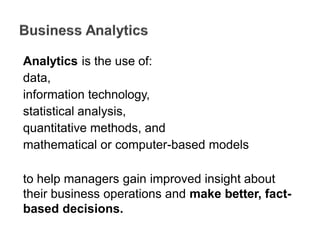
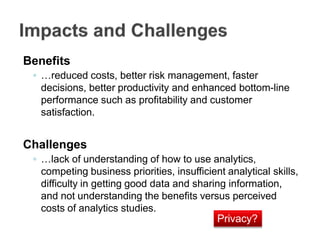
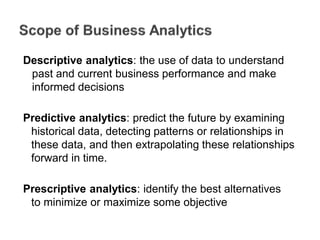
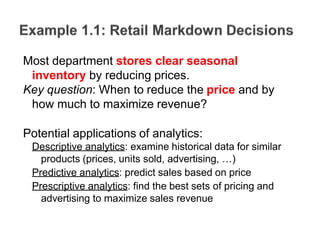
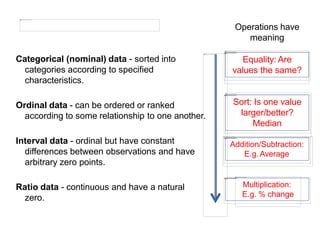
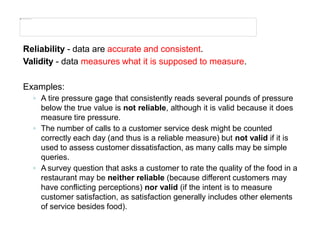
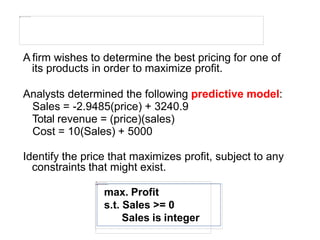
21COM2T463
Dr. NEERUPA CHAUHAN
Asst. Professor
Kristu Jayanti College, Autonomous
(Reaccredited A++ Grade by NAAC with CGPA 3.78/4)
Bengaluru – 560077, India
Analytics is the use of:
data,
information technology,
statistical analysis,
quantitative methods, and
mathematical or computer-based models
to help managers gain improved insight about
their business operations and make better, fact-
based decisions.
Pricing
◦ setting prices for consumer and industrial goods, government
contracts, and maintenance contracts
Customer segmentation
◦ identifying and targeting key customer groups in retail, insurance,
and credit card industries
Merchandising
◦ determining brands to buy, quantities, and allocations
Location
◦ finding the best location for bank branches and ATMs, or where to
service industrial equipment
Social Media
◦ understand trends and customer perceptions; assist marketing
managers and product designers
Benefits
◦ …reduced costs, better risk management, faster
decisions, better productivity and enhanced bottom-line
performance such as profitability and customer
satisfaction.
Challenges
◦ …lack of understanding of how to use analytics,
competing business priorities, insufficient analytical skills,
difficulty in getting good data and sharing information,
and not understanding the benefits versus perceived
costs of analytics studies.
Privacy?
Descriptive analytics: the use of data to understand
past and current business performance and make
informed decisions
Predictive analytics: predict the future by examining
historical data, detecting patterns or relationships in
these data, and then extrapolating these relationships
forward in time.
Prescriptive analytics: identify the best alternatives
to minimize or maximize some objective
Most department stores clear seasonal
inventory by reducing prices.
Key question: When to reduce the price and by
how much to maximize revenue?
Potential applications of analytics:
Descriptive analytics: examine historical data for similar
products (prices, units sold, advertising, …)
Predictive analytics: predict sales based on price
Prescriptive analytics: find the best sets of pricing and
advertising to maximize sales revenue
21COM2T463
Dr. NEERUPA CHAUHAN
Asst. Professor
Kristu Jayanti College, Autonomous
(Reaccredited A++ Grade by NAAC with CGPA 3.78/4)
Bengaluru – 560077, India
Introduction to Analytics
Tools
Data
Models
Problem solving with analytics
Database queries and analysis
Spreadsheets
Data visualization
Dashboards to report key performance measures
Data and Statistical methods
Data Mining basics (predictive models)
Simulation
Forecasting
Scenario and “what-if” analyses
Optimization
Text Mining
Social media, web, and text analytics
SQL various databases
Excel Spreadsheets
Tableau Software Simple drag and drop tools for visualizing data from
spreadsheets and other databases.
IBM Cognos Express An integrated business intelligence and
planning solution designed to meet the needs of midsize companies,
provides reporting, analysis, dashboard, scorecard, planning, budgeting
and forecasting capabilities.
SAS / SPSS / Rapid Miner Predictive modeling and data mining,
visualization, forecasting, optimization and model management, statistical
analysis, text analytics, and more using visual workflows.
R / Python Advanced programing-based data preparation, analytics and
visualization.
Introduction to Analytics
Tools
Data
Models
Problem solving with analytics
Data: numerical or textual facts and figures that
are collected through some type of measurement
process.
Information: result of analyzing data; that is,
extracting meaning from data to support
evaluation and decision making.
Internal
Annual reports
Accounting audits
Financial profitability analysis
Operations management performance
Human resource measurements
External
Economic trends
Marketing research
New developments: Web behavior – Social Media – Mobile - IOT
page views, visitor’s country, time of view, length of time, origin and
destination paths, products they searched for and viewed, products
purchased, what reviews they read, and many others.
Big data to refer to massive amounts of business data
from a wide variety of sources, much of which is
available in real time, and much of which is uncertain or
unpredictable. IBM calls these characteristics volume,
variety, velocity, and veracity (Truthfulness) .
“The effective use of big data has the potential to transform
economies, delivering a new wave of productivity growth and
consumer surplus. Using big data will become a key basis of
competition for existing companies, and will create new competitors
who are able to attract employees that have the critical skills for a
big data world.” - McKinsey Global Institute, 2011
Database - a collection of related tables
containing records on people, places, or things.
◦ In a database table the columns correspond to each
individual element of data (called fields, or attributes),
and the rows represent records of related data elements.
Extract
(SQL)
Data set - a collection of data (often a single
“spread sheet” or data mining table).
◦ Examples: Marketing survey responses, a table of
historical stock prices, and a collection of measurements
of dimensions of a manufactured item.
Discrete - derived from counting something.
◦ For example, a delivery is either on time or not; an
order is complete or incomplete; or an invoice can
have one, two, three, or any number of errors. Some
discrete metrics would be the proportion of on-time
deliveries; the number of incomplete orders each day,
and the number of errors per invoice.
Continuous based on a continuous scale of
measurement.
◦ Any metrics involving dollars, length, time, volume, or
weight, for example, are continuous.
Categorical (nominal) data - sorted into
categories according to specified
characteristics.
Ordinal data - can be ordered or ranked
according to some relationship to one another.
Interval data - ordinal but have constant
differences between observations and have
arbitrary zero points.
Ratio data - continuous and have a natural
zero.
Equality: Are
values the same?
Sort: Is one value
larger/better?
Median
Addition/Subtraction:
E.g. Average
Multiplication:
E.g. % change
Operations have
meaning
Reliability - data are accurate and consistent.
Validity - data measures what it is supposed to measure.
Examples:
◦ A tire pressure gage that consistently reads several pounds of pressure
below the true value is not reliable, although it is valid because it does
measure tire pressure.
◦ The number of calls to a customer service desk might be counted
correctly each day (and thus is a reliable measure) but not valid if it is
used to assess customer dissatisfaction, as many calls may be simple
queries.
◦ A survey question that asks a customer to rate the quality of the food in a
restaurant may be neither reliable (because different customers may
have conflicting perceptions) nor valid (if the intent is to measure
customer satisfaction, as satisfaction generally includes other elements
of service besides food).
21COM2T463
Dr. NEERUPA CHAUHAN
Asst. Professor
Kristu Jayanti College, Autonomous
(Reaccredited A++ Grade by NAAC with CGPA 3.78/4)
Bengaluru – 560077, India
Introduction to Analytics
Tools
Data
Models
Problem solving with analytics
Model - an abstraction or representation of a real
system, idea, or object.
Often a simplification of the real thing.
Captures the most important features.
Can be a written or verbal description, a visual
representation, a mathematical formula, or a
spreadsheet.
The sales of a new product, such as a first-generation iPad or
3D television, often follow a common pattern.
1. Verbal description: The rate of sales starts small as early
adopters begin to evaluate a new product and then begins
to grow at an increasing rate over time as positive
customer feedback spreads. Eventually, the market
begins to become saturated and the rate of sales begins
to decrease.
2. Visual model: A sketch of sales as an S-shaped curve
over time
3. Mathematical model:
S = aebect
• where
• S is sales,
• t is time,
• e is the base of natural logarithms, and
• a, b and c are constants that need to be
estimated.
Model:
Sales = 500 – 0.05(price) + 30(coupons) +
0.08(advertising) + 0.25(price)(advertising)
If the price is $6.99, no coupons are offered, and no advertising is done
(the experiment corresponding to week 1), the model estimates sales as
Sales = 500 - 0.05 × $6.99 + 30 × 0 + 0.08 × 0 + 0.25 × $6.99 × 0 =
500 units
How do we find this model?
In this case: linear regression
Learn model
Assumptions are made to
◦ To simplify a model and make it more tractable; that is, able to be
easily analyzed or solved.
◦ To add prior knowledge about the relationship between
variables.
The task of the modeler is to select or build an
appropriate model that best represents the behavior of
the real situation.
Example: economic theory tells us that demand for a
product is negatively related to its price. Thus, as prices
increase, demand falls, and vice versa.
As price increases, demand falls.
Issues: Demand can become negative + empirical
data has a poor fit.
Assumes price elasticity is constant (constant ratio of
% change in demand to % change in price)
Uncertainty is imperfect knowledge (of what will
happen in the future).
Risk is the potential of (gaining or) losing something of
value. It is the consequence of actions taken under
uncertainty.
Often measured using standard deviation of variables.
(=Deviation risk measure)
“To try to eliminate risk in business enterprise is futile. Risk is inherent in the
commitment of present resources to future expectations. Indeed, economic
progress can be defined as the ability to take greater risks. The attempt to
eliminate risks, even the attempt to minimize them, can only make them
irrational and unbearable. It can only result in the greatest risk of all: rigidity.”
– Peter Drucker
Prescriptive decision models help decision
makers identify the best solution.
Optimization - finding values of decision variables
that minimize (or maximize) something such as
cost (or profit).
Objective function - the equation that minimizes (or
maximizes) the quantity of interest.
Constraints - limitations or restrictions.
Optimal solution - values of the decision variables at the
minimum (or maximum) point.
A firm wishes to determine the best pricing for one of
its products in order to maximize profit.
Analysts determined the following predictive model:
Sales = -2.9485(price) + 3240.9
Total revenue = (price)(sales)
Cost = 10(Sales) + 5000
Identify the price that maximizes profit, subject to any
constraints that might exist.
max. Profit
s.t. Sales >= 0
Sales is integer
Introduction to Analytics
Tools
Data
Models
Problem solving with analytics
1. Recognize a problem
2. Define the problem
3. Structure the problem
4. Analyze the problem
5. Interpret results and
make a decision
6. Implement the solution
Problems exist when there is a gap between what is
happening and what we think should be
happening.
For example, costs are too high compared with
competitors.
Clearly defining the problem is not a trivial task.
Complexity increases when the following occur:
- large number of courses of action
individual
- the problem belongs to a group and not an
- competing objectives
- external groups are affected
- problem owner and problem solver are not the
same person
- time limitations exist
What is part of the problem? What not?
Stating goals and objectives
Characterizing the possible decisions
Identifying any constraints or restrictions
Analytics plays a major role.
Analysis involves some sort of experimentation or
solution process, such as evaluating different
scenarios, analyzing risks associated with various
decision alternatives, finding a solution that meets
certain goals, or determining an optimal
solution.
What do the results found by the model mean for
the application?
Models cannot capture every detail of the real
problem. Managers must understand the
limitations of models and their underlying
assumptions and often incorporate judgment into
making a decision.
Translate the results of the model back to the real
world.
Requires providing adequate resources,
motivating employees, eliminating resistance to
change, modifying organizational policies, and
developing trust.
Introduction to Business Analytics---PPT

Introduction to Business Analytics---PPT

  • 1.
    21COM2T463 Dr. NEERUPA CHAUHAN Asst.Professor Kristu Jayanti College, Autonomous (Reaccredited A++ Grade by NAAC with CGPA 3.78/4) Bengaluru – 560077, India
  • 3.
    Analytics is theuse of: data, information technology, statistical analysis, quantitative methods, and mathematical or computer-based models to help managers gain improved insight about their business operations and make better, fact- based decisions.
  • 4.
    Pricing ◦ setting pricesfor consumer and industrial goods, government contracts, and maintenance contracts Customer segmentation ◦ identifying and targeting key customer groups in retail, insurance, and credit card industries Merchandising ◦ determining brands to buy, quantities, and allocations Location ◦ finding the best location for bank branches and ATMs, or where to service industrial equipment Social Media ◦ understand trends and customer perceptions; assist marketing managers and product designers
  • 6.
    Benefits ◦ …reduced costs,better risk management, faster decisions, better productivity and enhanced bottom-line performance such as profitability and customer satisfaction. Challenges ◦ …lack of understanding of how to use analytics, competing business priorities, insufficient analytical skills, difficulty in getting good data and sharing information, and not understanding the benefits versus perceived costs of analytics studies. Privacy?
  • 7.
    Descriptive analytics: theuse of data to understand past and current business performance and make informed decisions Predictive analytics: predict the future by examining historical data, detecting patterns or relationships in these data, and then extrapolating these relationships forward in time. Prescriptive analytics: identify the best alternatives to minimize or maximize some objective
  • 8.
    Most department storesclear seasonal inventory by reducing prices. Key question: When to reduce the price and by how much to maximize revenue? Potential applications of analytics: Descriptive analytics: examine historical data for similar products (prices, units sold, advertising, …) Predictive analytics: predict sales based on price Prescriptive analytics: find the best sets of pricing and advertising to maximize sales revenue
  • 9.
    21COM2T463 Dr. NEERUPA CHAUHAN Asst.Professor Kristu Jayanti College, Autonomous (Reaccredited A++ Grade by NAAC with CGPA 3.78/4) Bengaluru – 560077, India
  • 10.
  • 11.
    Database queries andanalysis Spreadsheets Data visualization Dashboards to report key performance measures Data and Statistical methods Data Mining basics (predictive models) Simulation Forecasting Scenario and “what-if” analyses Optimization Text Mining Social media, web, and text analytics
  • 12.
    SQL various databases ExcelSpreadsheets Tableau Software Simple drag and drop tools for visualizing data from spreadsheets and other databases. IBM Cognos Express An integrated business intelligence and planning solution designed to meet the needs of midsize companies, provides reporting, analysis, dashboard, scorecard, planning, budgeting and forecasting capabilities. SAS / SPSS / Rapid Miner Predictive modeling and data mining, visualization, forecasting, optimization and model management, statistical analysis, text analytics, and more using visual workflows. R / Python Advanced programing-based data preparation, analytics and visualization.
  • 13.
  • 14.
    Data: numerical ortextual facts and figures that are collected through some type of measurement process. Information: result of analyzing data; that is, extracting meaning from data to support evaluation and decision making.
  • 15.
    Internal Annual reports Accounting audits Financialprofitability analysis Operations management performance Human resource measurements External Economic trends Marketing research New developments: Web behavior – Social Media – Mobile - IOT page views, visitor’s country, time of view, length of time, origin and destination paths, products they searched for and viewed, products purchased, what reviews they read, and many others.
  • 16.
    Big data torefer to massive amounts of business data from a wide variety of sources, much of which is available in real time, and much of which is uncertain or unpredictable. IBM calls these characteristics volume, variety, velocity, and veracity (Truthfulness) . “The effective use of big data has the potential to transform economies, delivering a new wave of productivity growth and consumer surplus. Using big data will become a key basis of competition for existing companies, and will create new competitors who are able to attract employees that have the critical skills for a big data world.” - McKinsey Global Institute, 2011
  • 17.
    Database - acollection of related tables containing records on people, places, or things. ◦ In a database table the columns correspond to each individual element of data (called fields, or attributes), and the rows represent records of related data elements. Extract (SQL) Data set - a collection of data (often a single “spread sheet” or data mining table). ◦ Examples: Marketing survey responses, a table of historical stock prices, and a collection of measurements of dimensions of a manufactured item.
  • 18.
    Discrete - derivedfrom counting something. ◦ For example, a delivery is either on time or not; an order is complete or incomplete; or an invoice can have one, two, three, or any number of errors. Some discrete metrics would be the proportion of on-time deliveries; the number of incomplete orders each day, and the number of errors per invoice. Continuous based on a continuous scale of measurement. ◦ Any metrics involving dollars, length, time, volume, or weight, for example, are continuous.
  • 19.
    Categorical (nominal) data- sorted into categories according to specified characteristics. Ordinal data - can be ordered or ranked according to some relationship to one another. Interval data - ordinal but have constant differences between observations and have arbitrary zero points. Ratio data - continuous and have a natural zero. Equality: Are values the same? Sort: Is one value larger/better? Median Addition/Subtraction: E.g. Average Multiplication: E.g. % change Operations have meaning
  • 20.
    Reliability - dataare accurate and consistent. Validity - data measures what it is supposed to measure. Examples: ◦ A tire pressure gage that consistently reads several pounds of pressure below the true value is not reliable, although it is valid because it does measure tire pressure. ◦ The number of calls to a customer service desk might be counted correctly each day (and thus is a reliable measure) but not valid if it is used to assess customer dissatisfaction, as many calls may be simple queries. ◦ A survey question that asks a customer to rate the quality of the food in a restaurant may be neither reliable (because different customers may have conflicting perceptions) nor valid (if the intent is to measure customer satisfaction, as satisfaction generally includes other elements of service besides food).
  • 21.
    21COM2T463 Dr. NEERUPA CHAUHAN Asst.Professor Kristu Jayanti College, Autonomous (Reaccredited A++ Grade by NAAC with CGPA 3.78/4) Bengaluru – 560077, India
  • 22.
  • 23.
    Model - anabstraction or representation of a real system, idea, or object. Often a simplification of the real thing. Captures the most important features. Can be a written or verbal description, a visual representation, a mathematical formula, or a spreadsheet.
  • 24.
    The sales ofa new product, such as a first-generation iPad or 3D television, often follow a common pattern. 1. Verbal description: The rate of sales starts small as early adopters begin to evaluate a new product and then begins to grow at an increasing rate over time as positive customer feedback spreads. Eventually, the market begins to become saturated and the rate of sales begins to decrease.
  • 25.
    2. Visual model:A sketch of sales as an S-shaped curve over time
  • 26.
    3. Mathematical model: S= aebect • where • S is sales, • t is time, • e is the base of natural logarithms, and • a, b and c are constants that need to be estimated.
  • 27.
    Model: Sales = 500– 0.05(price) + 30(coupons) + 0.08(advertising) + 0.25(price)(advertising) If the price is $6.99, no coupons are offered, and no advertising is done (the experiment corresponding to week 1), the model estimates sales as Sales = 500 - 0.05 × $6.99 + 30 × 0 + 0.08 × 0 + 0.25 × $6.99 × 0 = 500 units How do we find this model? In this case: linear regression Learn model
  • 28.
    Assumptions are madeto ◦ To simplify a model and make it more tractable; that is, able to be easily analyzed or solved. ◦ To add prior knowledge about the relationship between variables. The task of the modeler is to select or build an appropriate model that best represents the behavior of the real situation. Example: economic theory tells us that demand for a product is negatively related to its price. Thus, as prices increase, demand falls, and vice versa.
  • 29.
    As price increases,demand falls. Issues: Demand can become negative + empirical data has a poor fit.
  • 30.
    Assumes price elasticityis constant (constant ratio of % change in demand to % change in price)
  • 31.
    Uncertainty is imperfectknowledge (of what will happen in the future). Risk is the potential of (gaining or) losing something of value. It is the consequence of actions taken under uncertainty. Often measured using standard deviation of variables. (=Deviation risk measure) “To try to eliminate risk in business enterprise is futile. Risk is inherent in the commitment of present resources to future expectations. Indeed, economic progress can be defined as the ability to take greater risks. The attempt to eliminate risks, even the attempt to minimize them, can only make them irrational and unbearable. It can only result in the greatest risk of all: rigidity.” – Peter Drucker
  • 32.
    Prescriptive decision modelshelp decision makers identify the best solution. Optimization - finding values of decision variables that minimize (or maximize) something such as cost (or profit). Objective function - the equation that minimizes (or maximizes) the quantity of interest. Constraints - limitations or restrictions. Optimal solution - values of the decision variables at the minimum (or maximum) point.
  • 33.
    A firm wishesto determine the best pricing for one of its products in order to maximize profit. Analysts determined the following predictive model: Sales = -2.9485(price) + 3240.9 Total revenue = (price)(sales) Cost = 10(Sales) + 5000 Identify the price that maximizes profit, subject to any constraints that might exist. max. Profit s.t. Sales >= 0 Sales is integer
  • 34.
  • 35.
    1. Recognize aproblem 2. Define the problem 3. Structure the problem 4. Analyze the problem 5. Interpret results and make a decision 6. Implement the solution
  • 36.
    Problems exist whenthere is a gap between what is happening and what we think should be happening. For example, costs are too high compared with competitors.
  • 37.
    Clearly defining theproblem is not a trivial task. Complexity increases when the following occur: - large number of courses of action individual - the problem belongs to a group and not an - competing objectives - external groups are affected - problem owner and problem solver are not the same person - time limitations exist What is part of the problem? What not?
  • 38.
    Stating goals andobjectives Characterizing the possible decisions Identifying any constraints or restrictions
  • 39.
    Analytics plays amajor role. Analysis involves some sort of experimentation or solution process, such as evaluating different scenarios, analyzing risks associated with various decision alternatives, finding a solution that meets certain goals, or determining an optimal solution.
  • 40.
    What do theresults found by the model mean for the application? Models cannot capture every detail of the real problem. Managers must understand the limitations of models and their underlying assumptions and often incorporate judgment into making a decision.
  • 41.
    Translate the resultsof the model back to the real world. Requires providing adequate resources, motivating employees, eliminating resistance to change, modifying organizational policies, and developing trust.