Downloaded 86 times


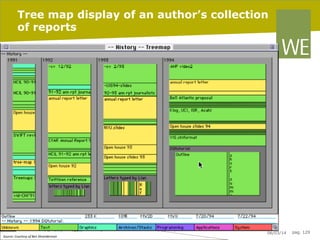
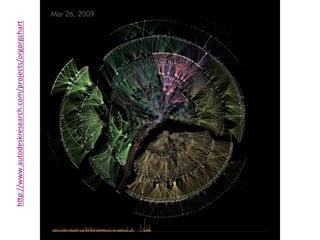
![Steps
to
create
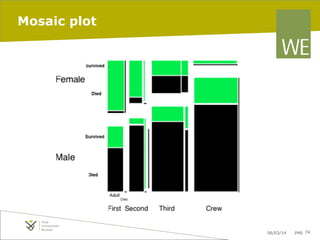
mosaic
plot
325 285
706
885
First Second
2201
Third
Crew
(a)
(b)
Survived
Female
Female
Died
Survived
Male
Male
Died
Adult
[Friendly,
2000]
Child
First Second
Third
(d)
Crew
First Second
Third
(c)
Crew](https://image.slidesharecdn.com/lecture3-representation-140306093217-phpapp02/85/Information-visualization-representation-73-320.jpg)

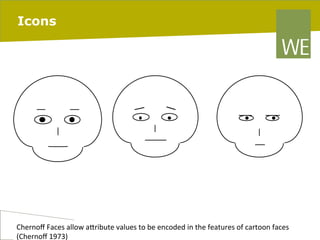
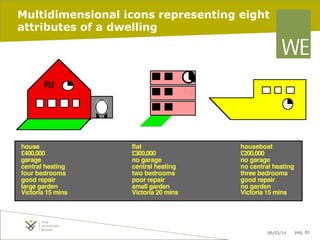
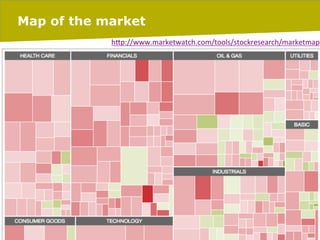
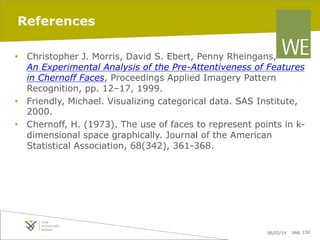
![Some criticism
No evidence for pre-attentive nature
[Morris et al. 1999]
Src:
hIp://joshualedwell.typepad.com/usability_blog/files/final_vizualiza8on.pdf
06/03/14
pag. 80](https://image.slidesharecdn.com/lecture3-representation-140306093217-phpapp02/85/Information-visualization-representation-80-320.jpg)


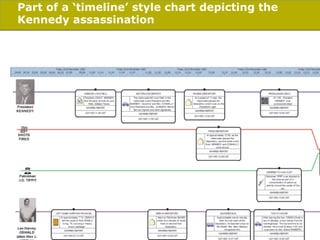


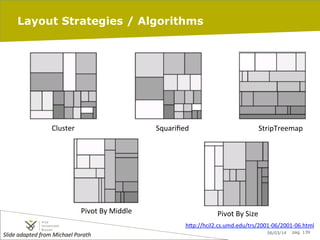


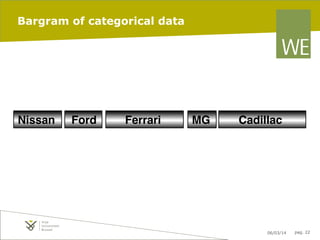
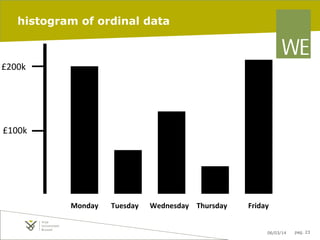
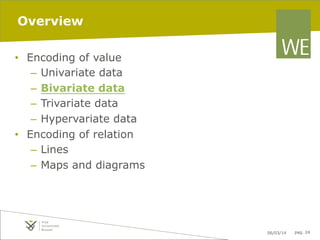
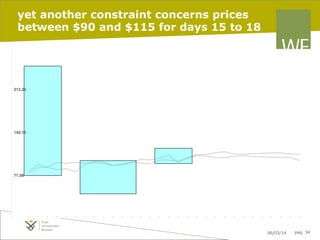
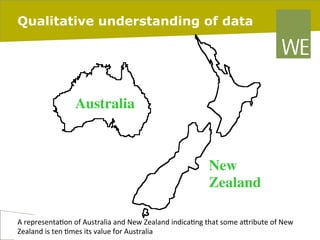
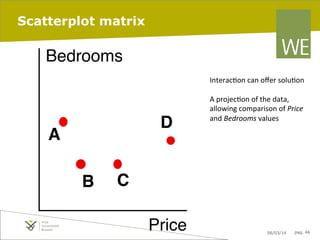
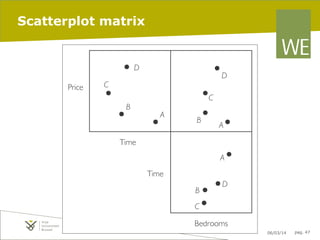
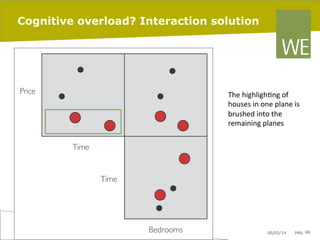
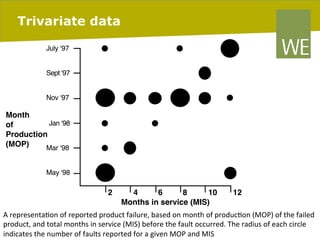
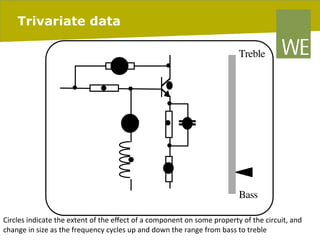
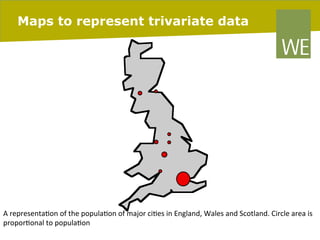
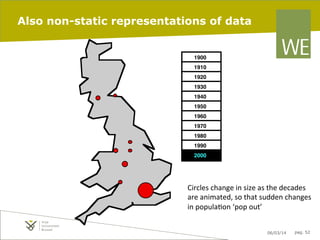
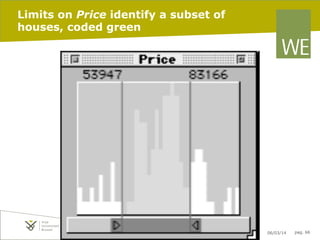
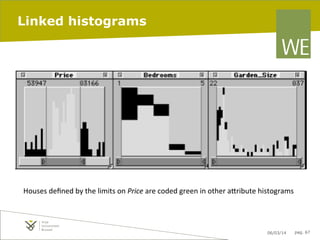
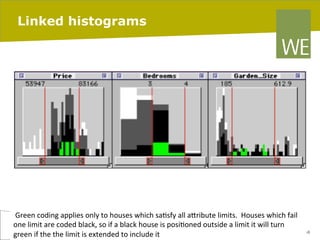
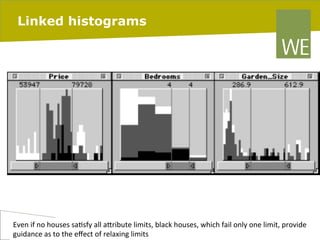
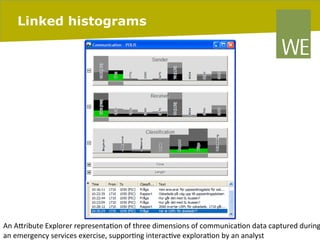
This document contains summaries of various techniques for visually representing data with 1, 2, 3 or more variables. It begins with examples of encoding univariate data using techniques like bar graphs and histograms. It then discusses ways to encode bivariate data, such as scatterplots and linked histograms. Finally, it explores some options for visually encoding trivariate and higher-dimensional data, including bubble plots and maps. The document serves as an overview of fundamental data visualization concepts and techniques.