Downloaded 100 times
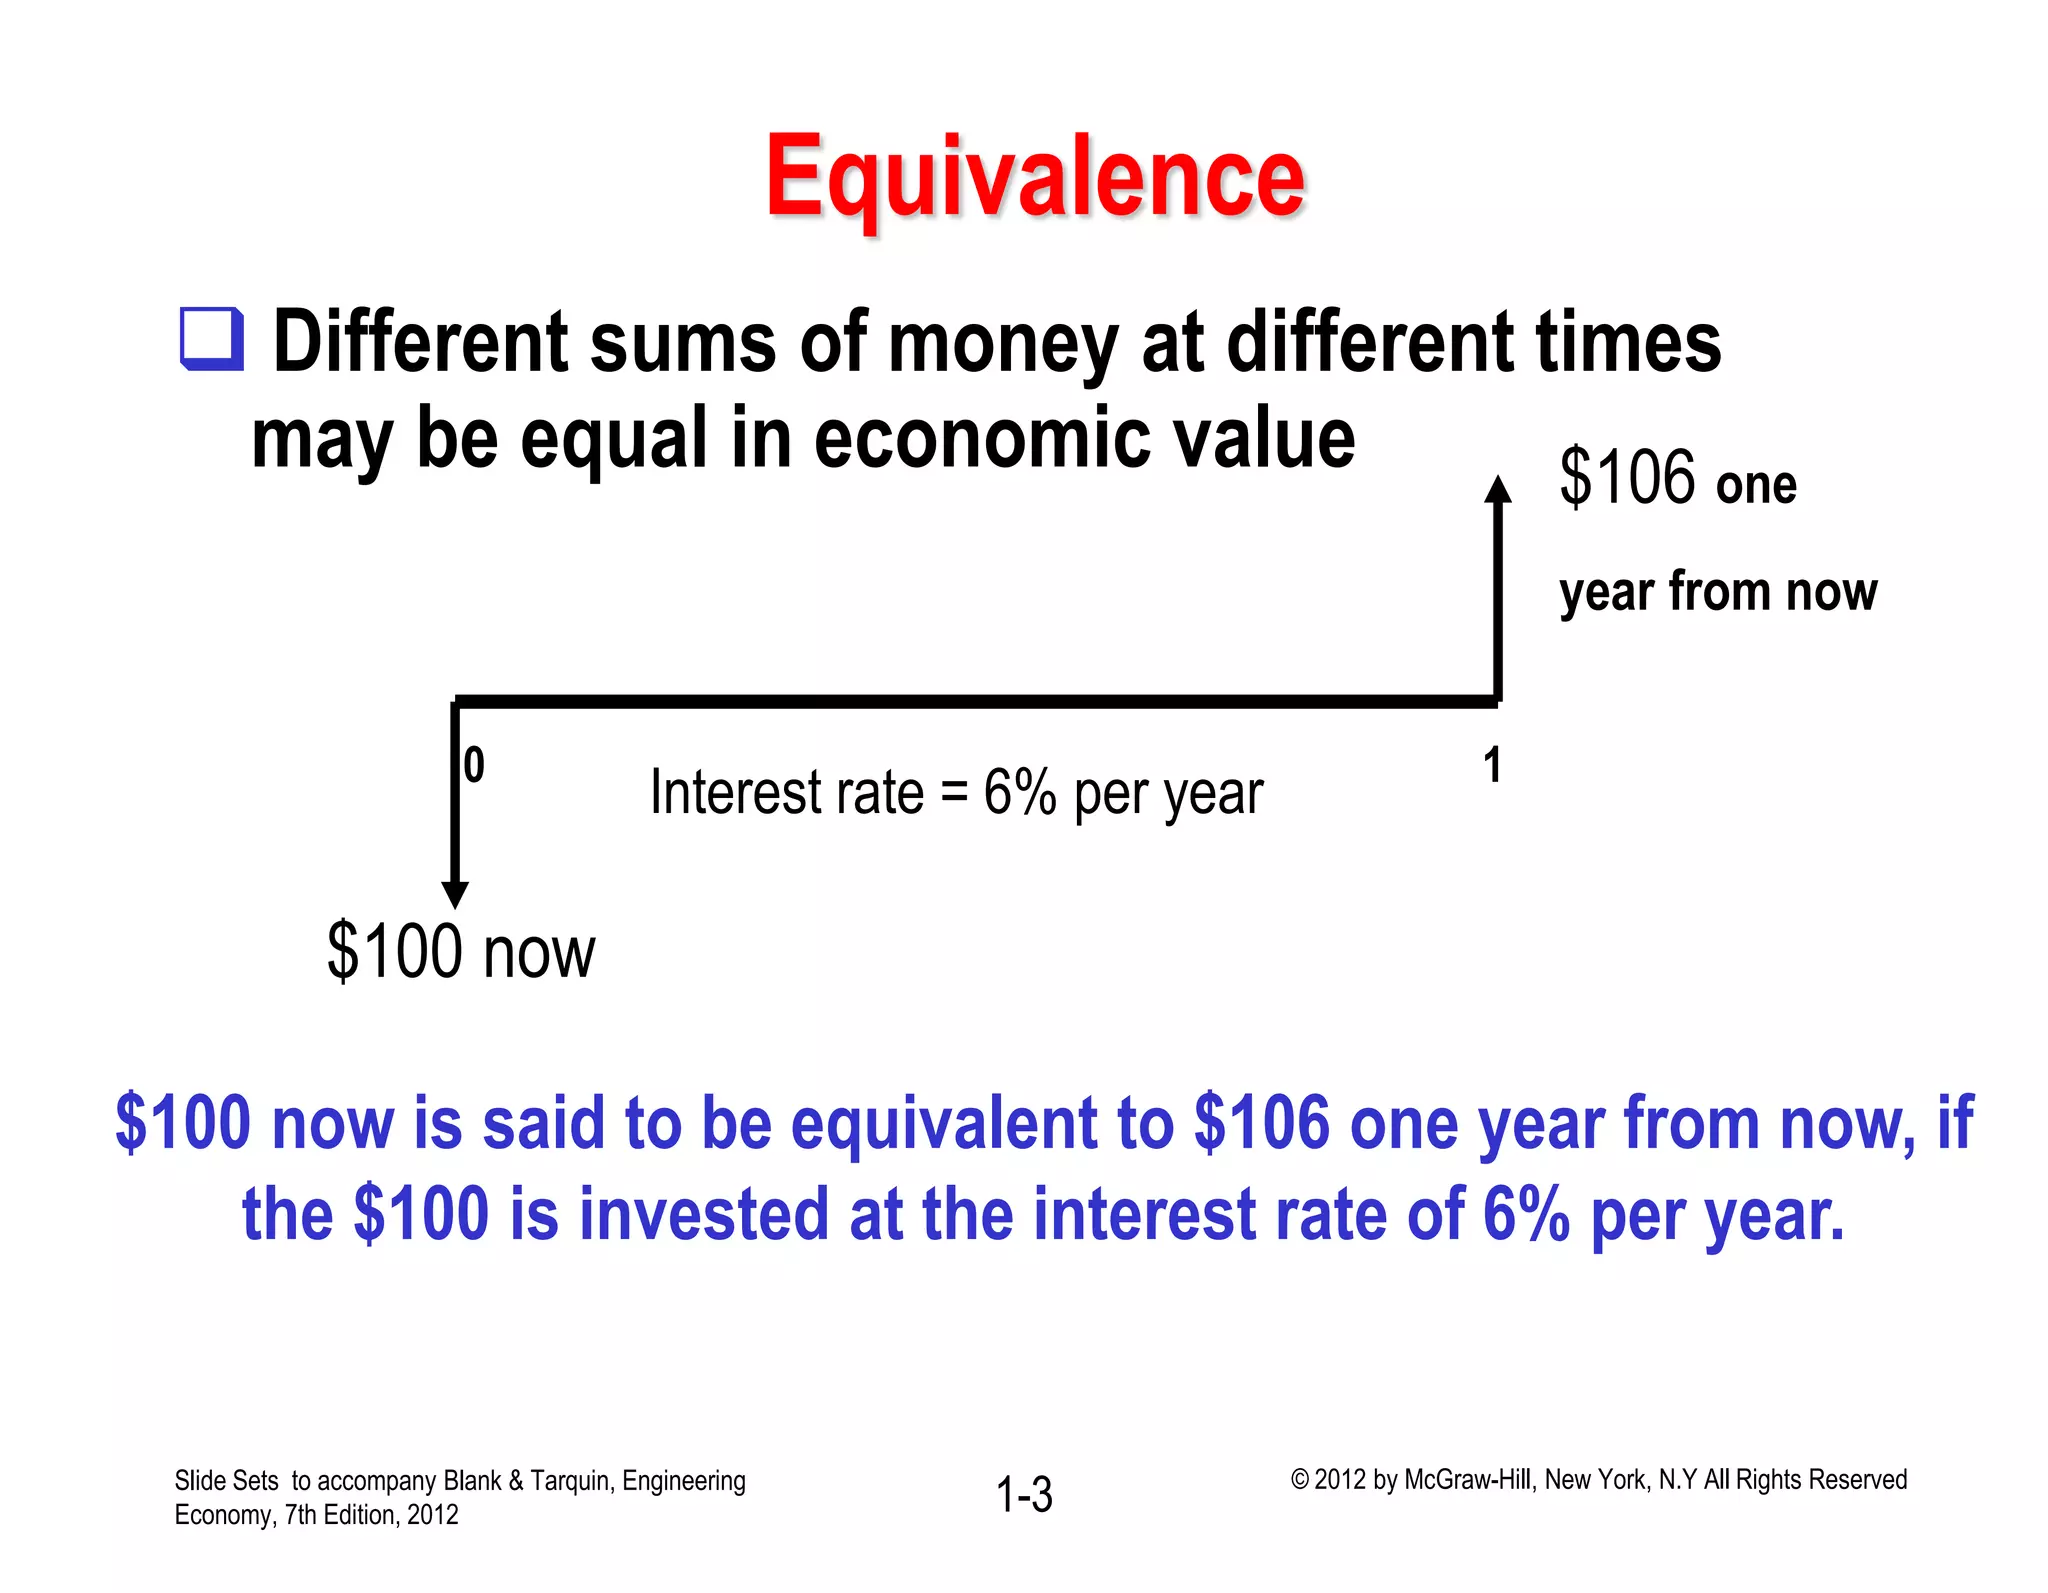
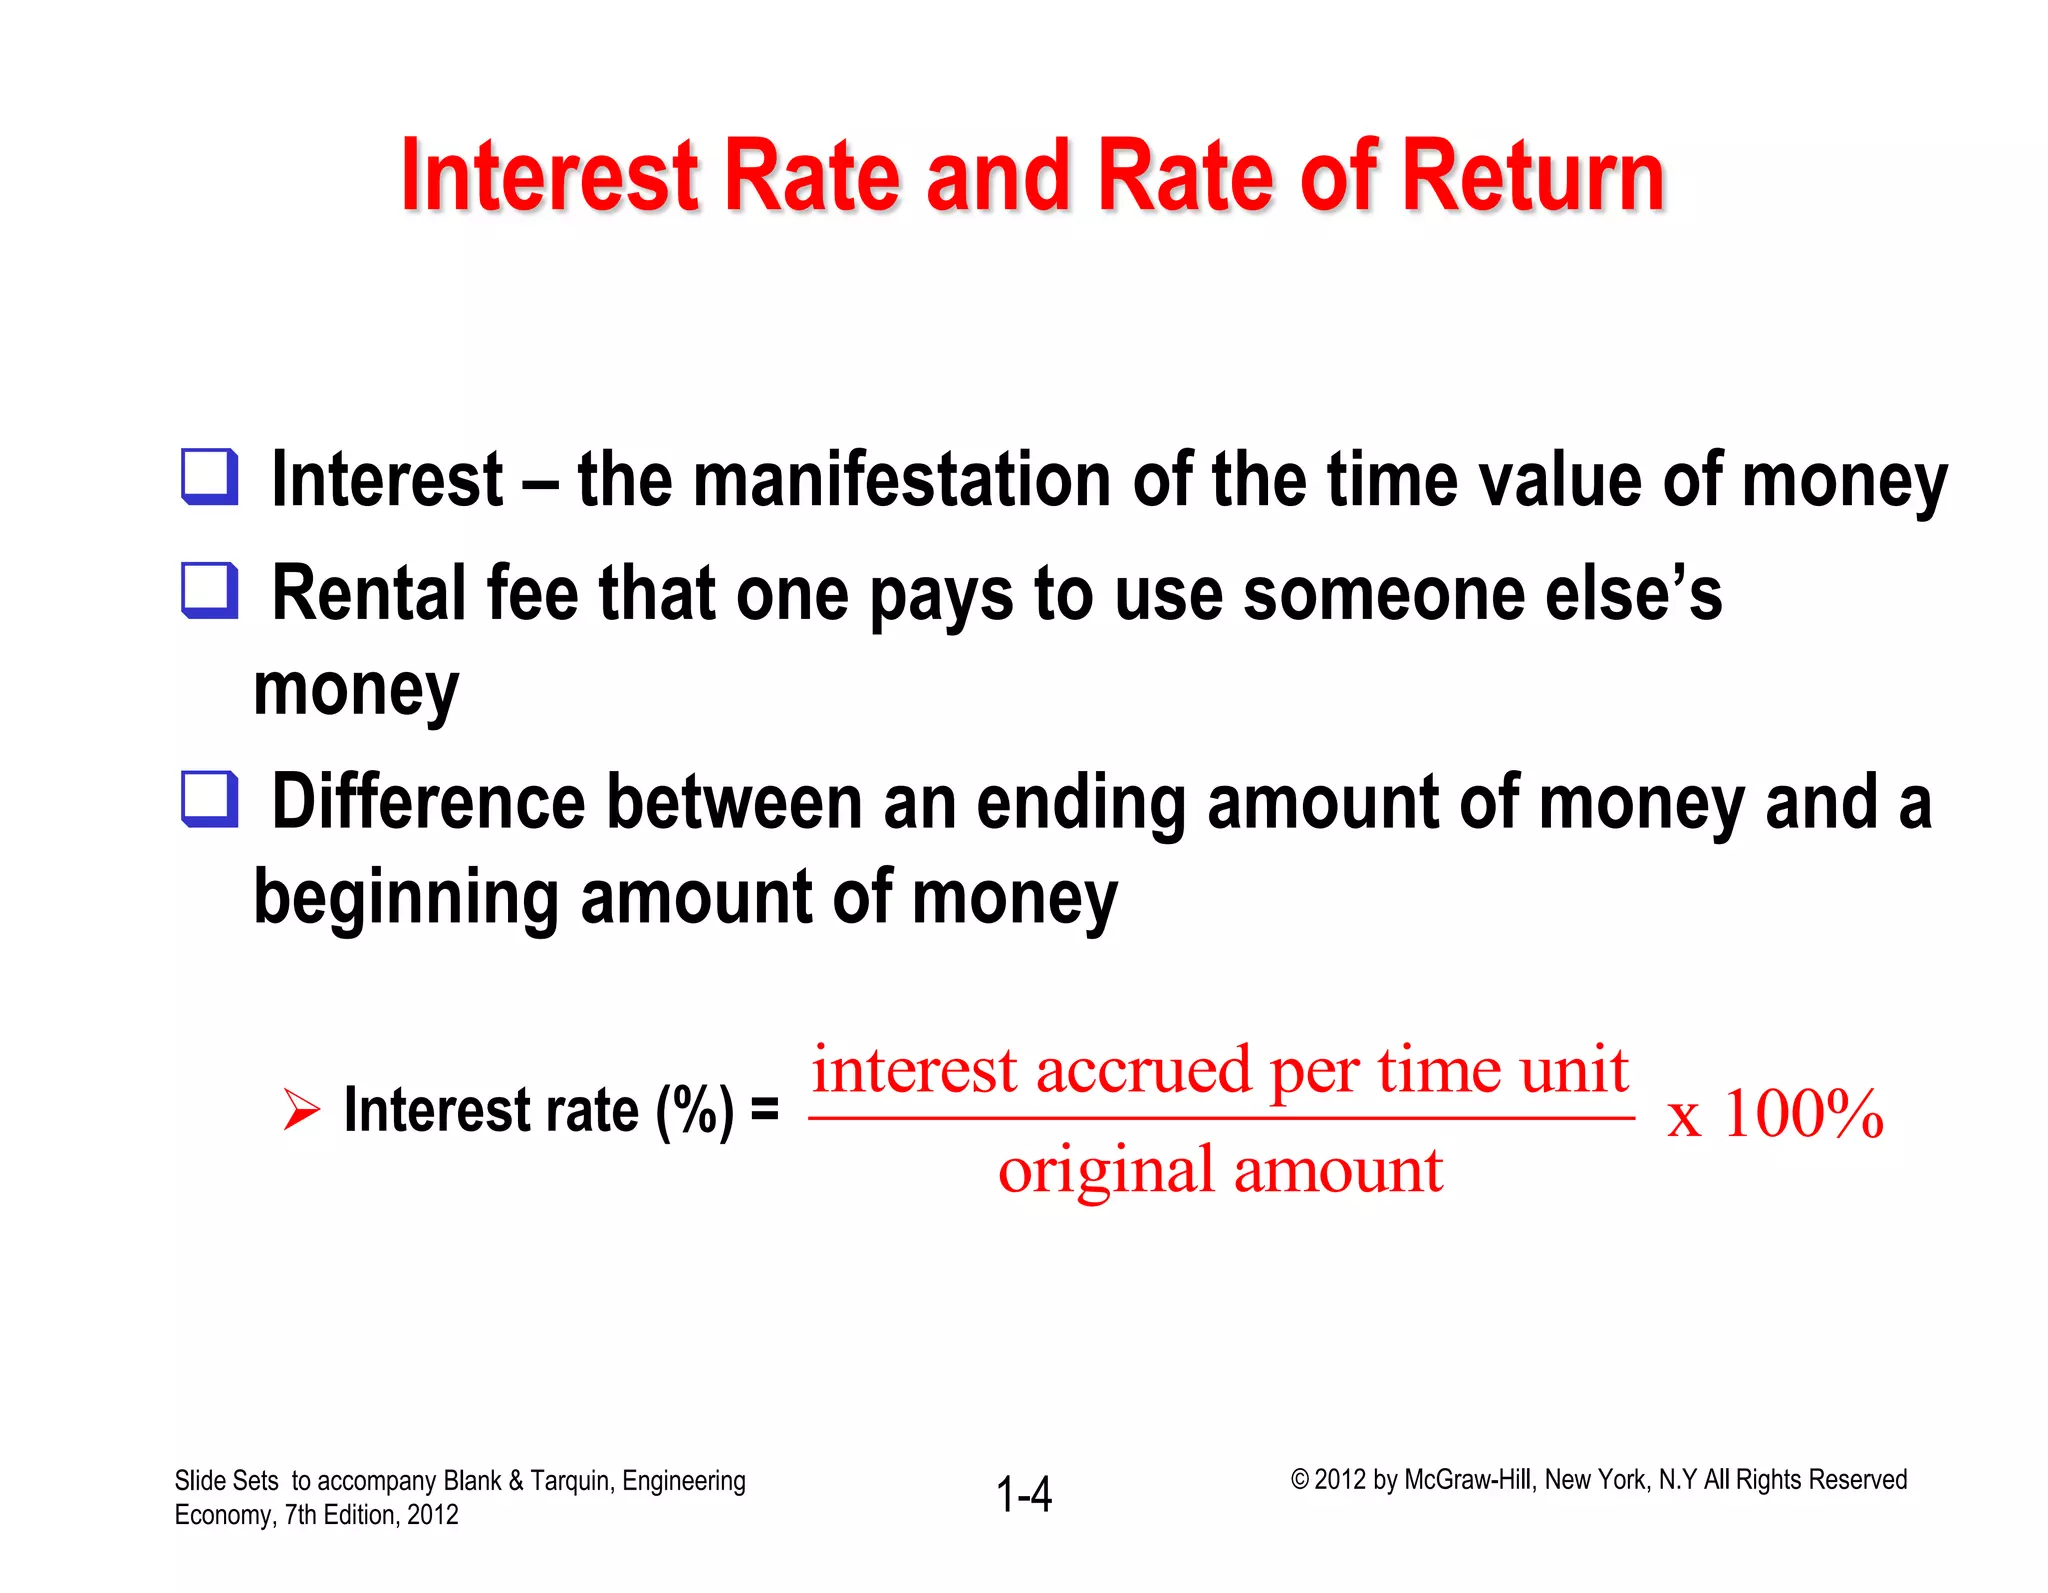
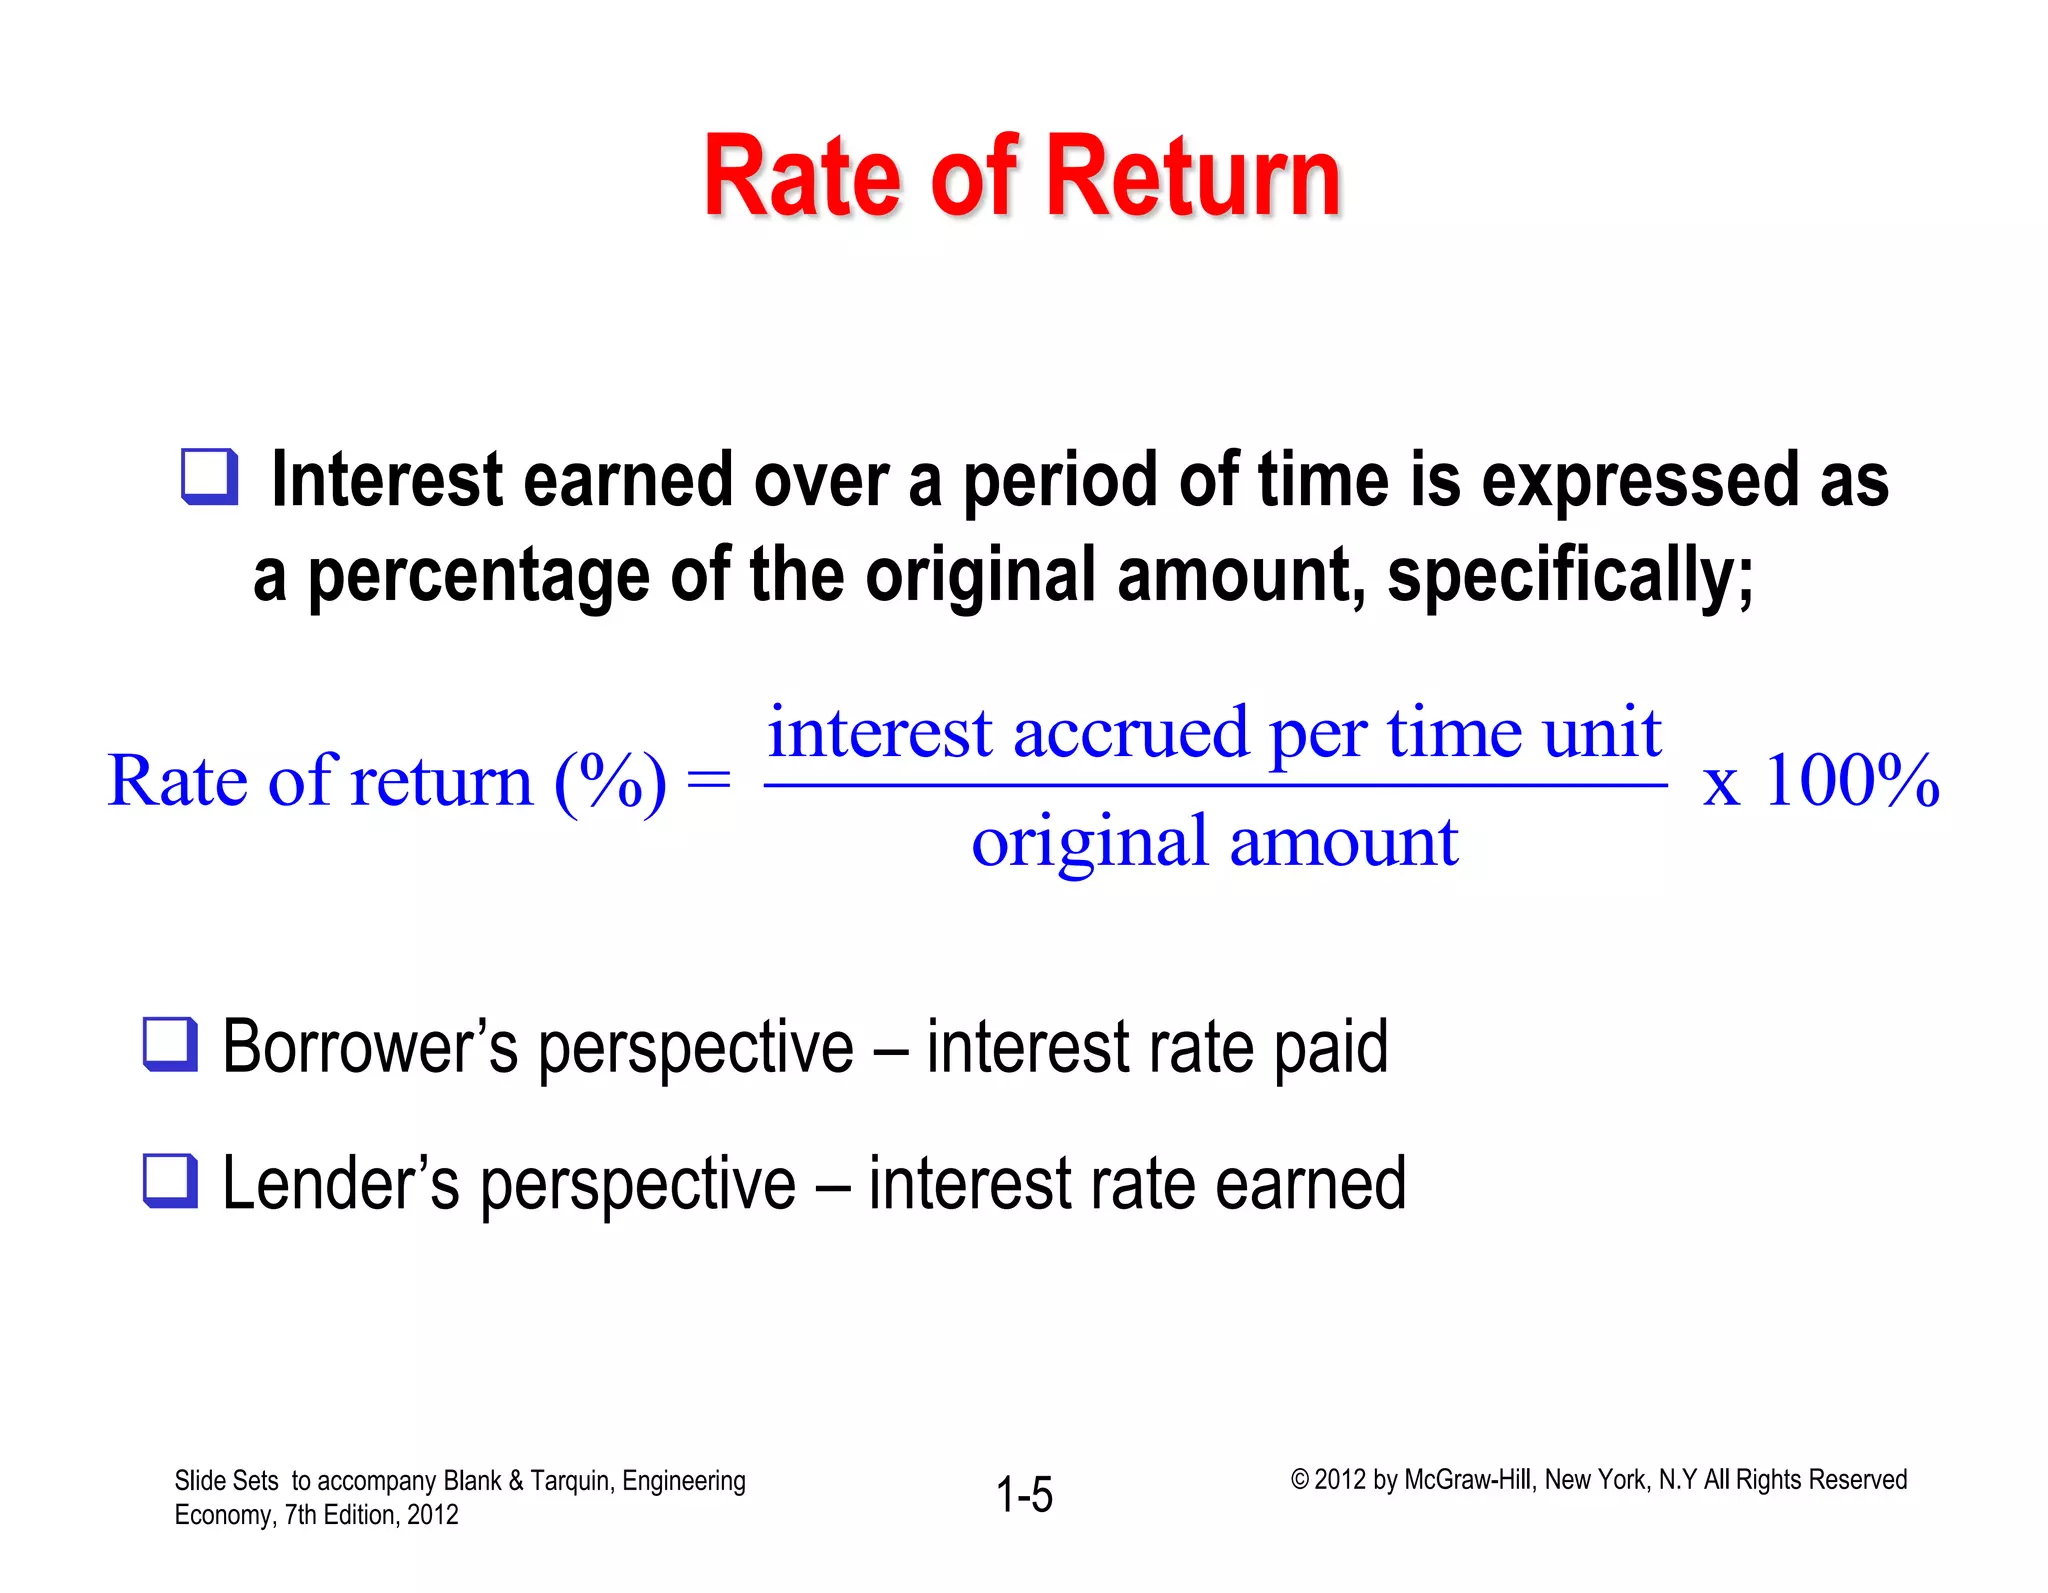
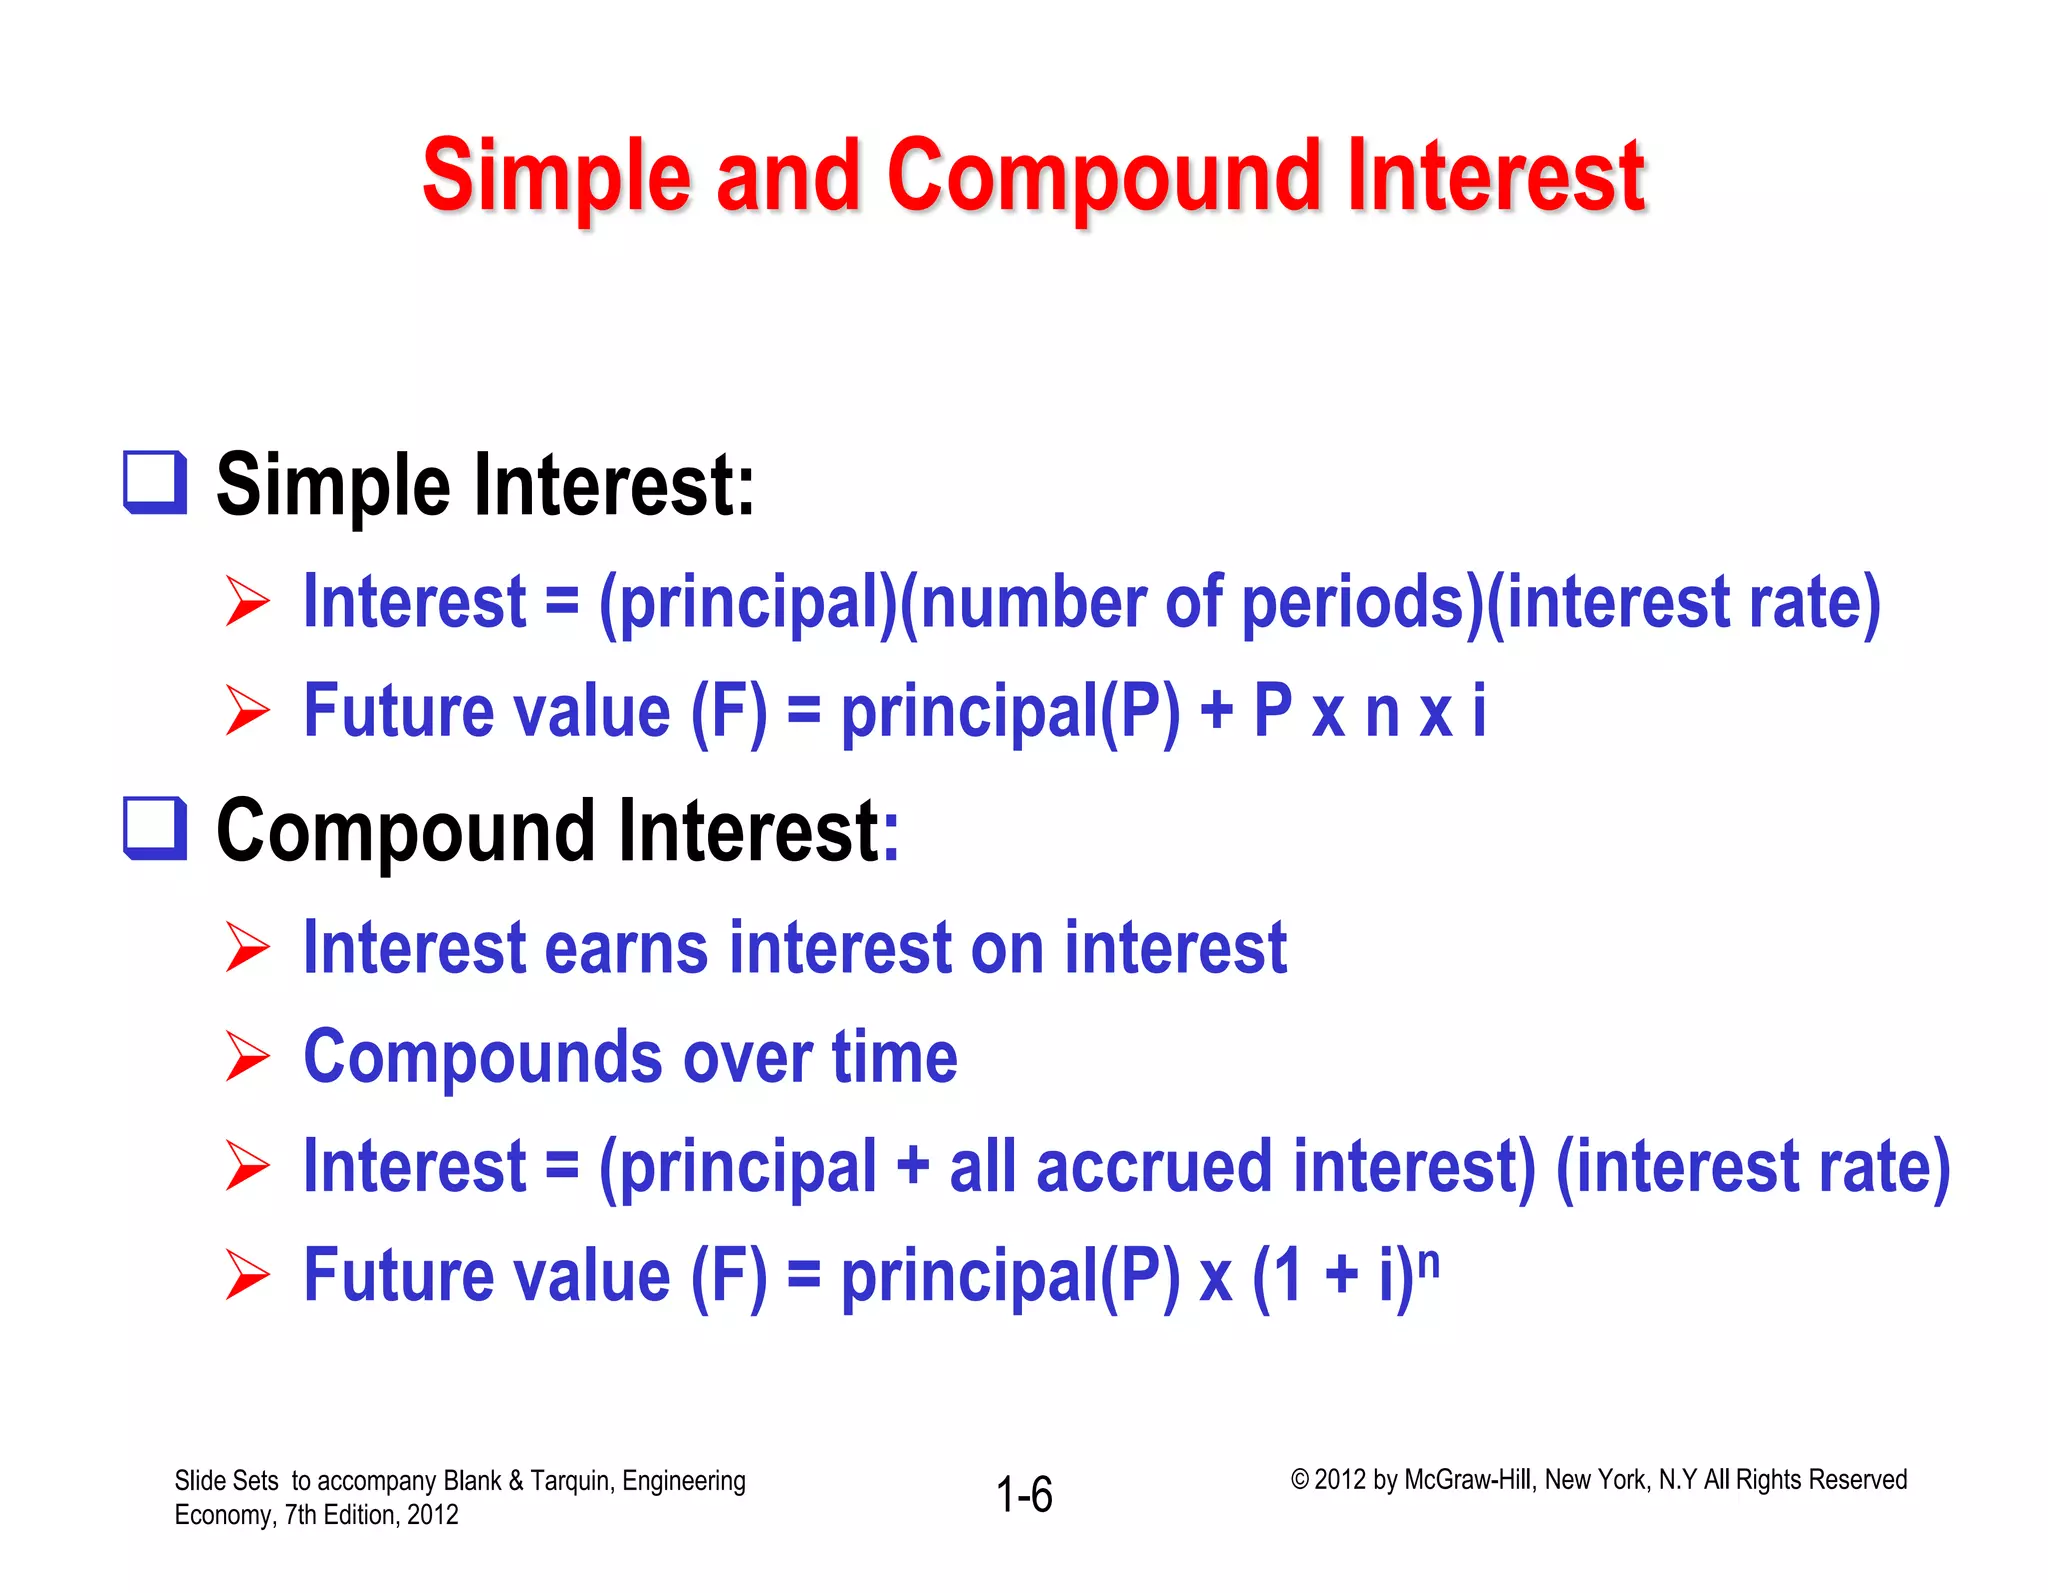
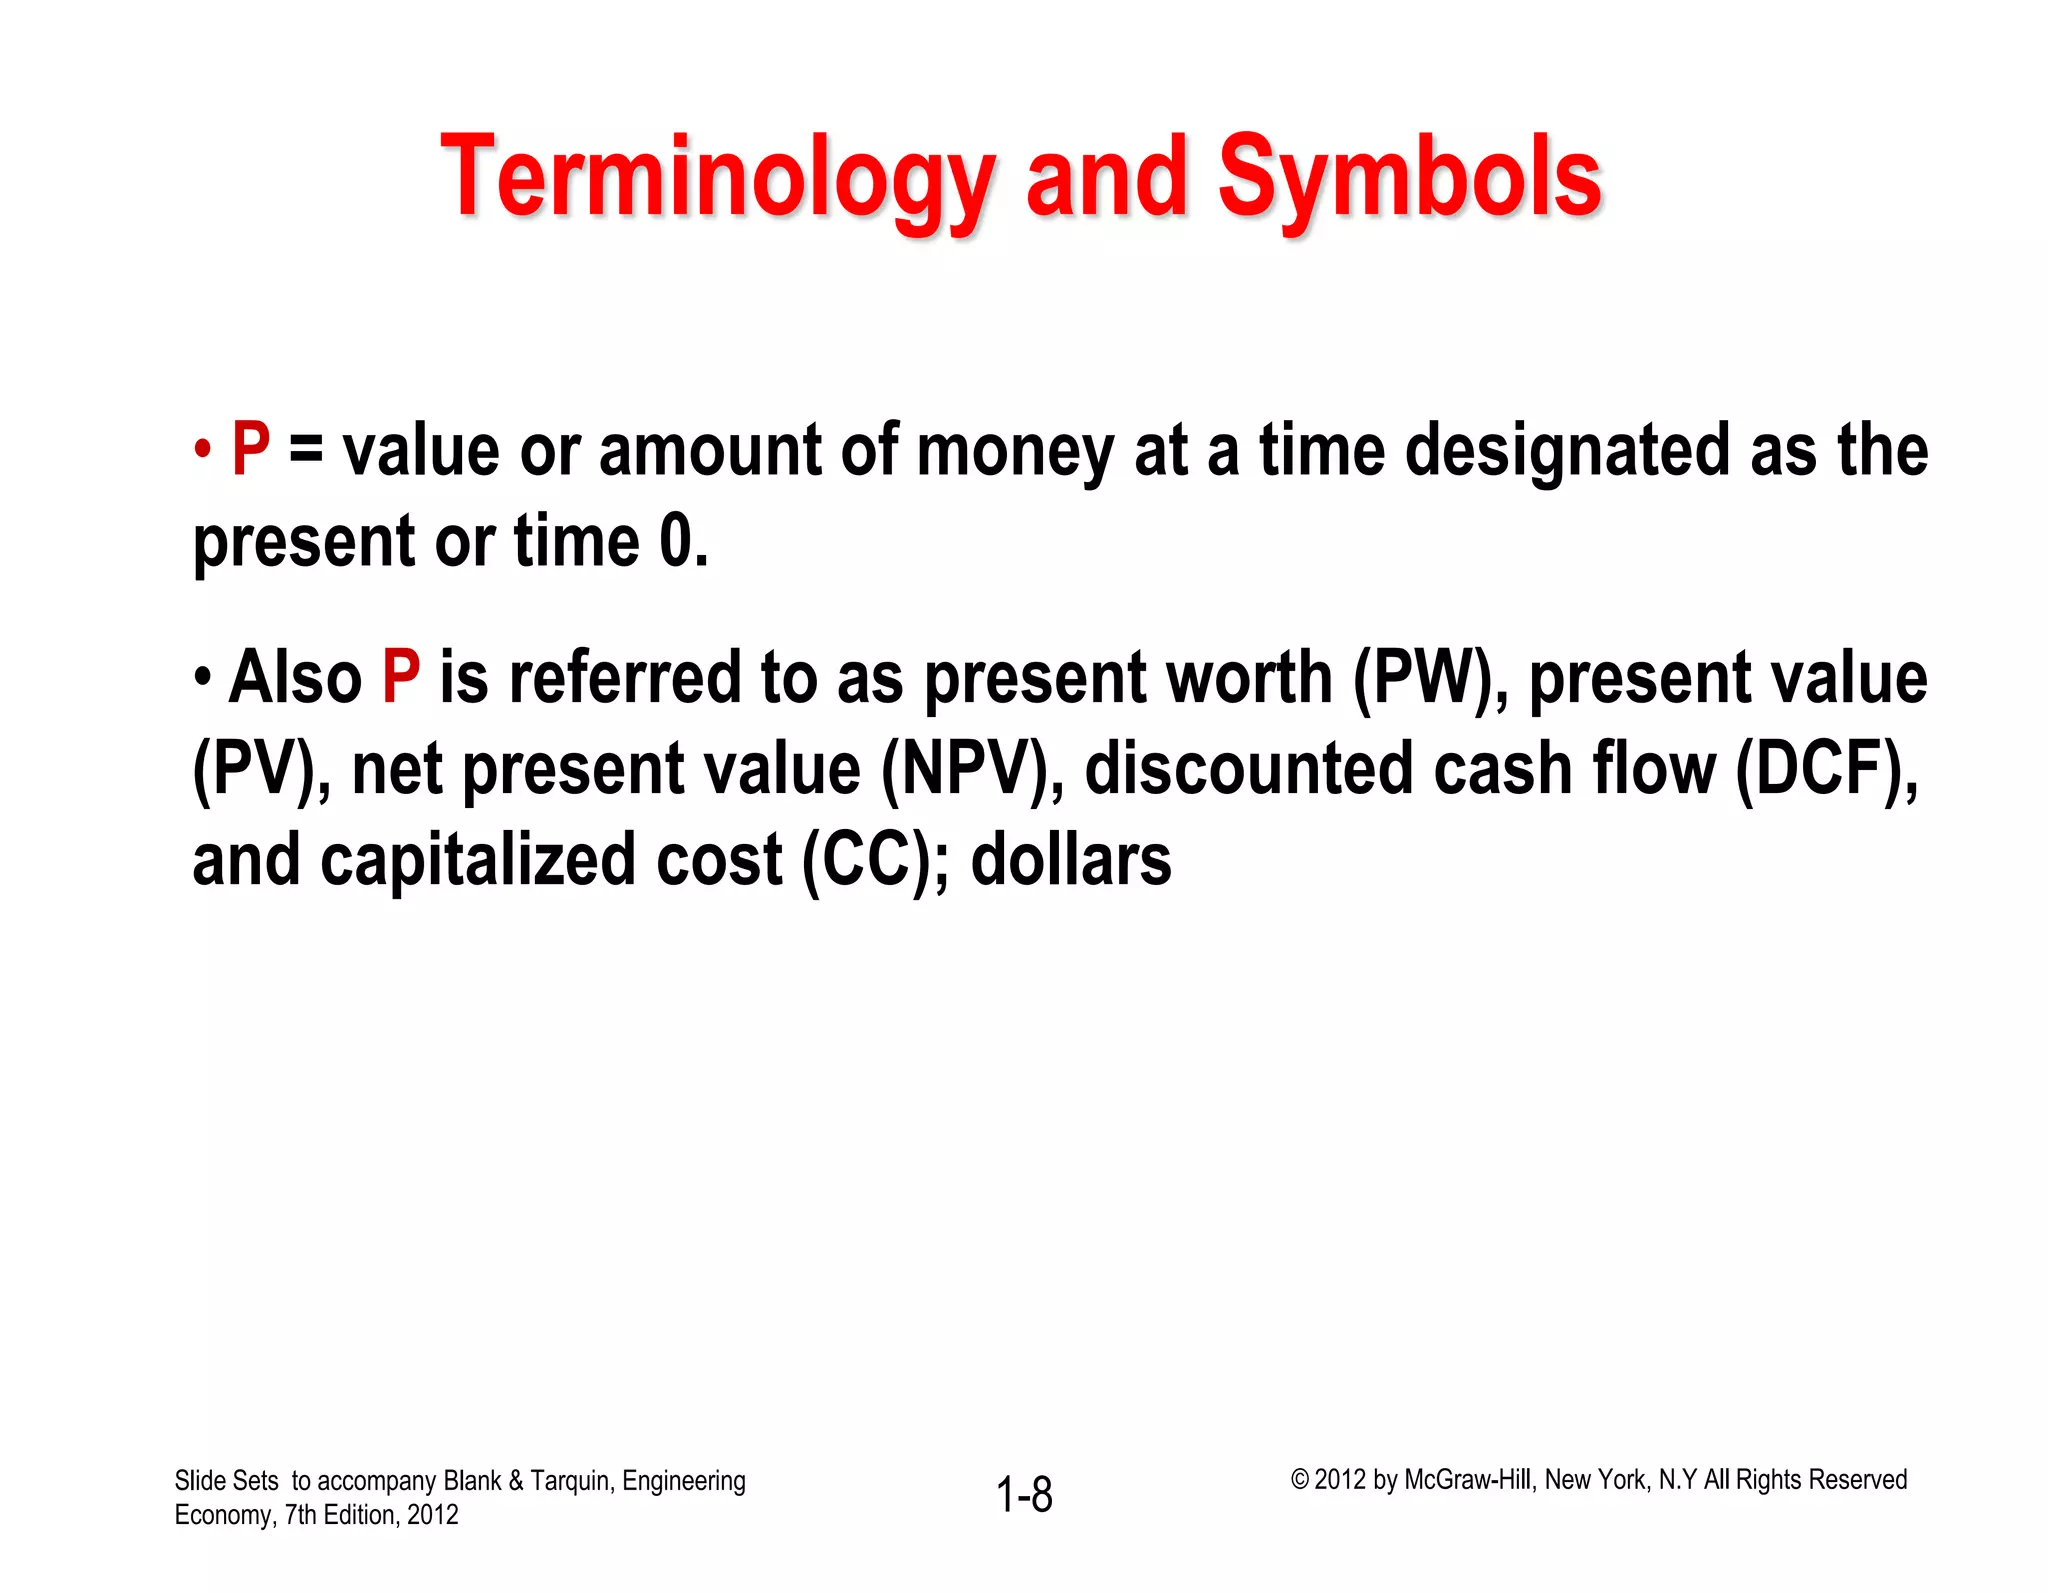
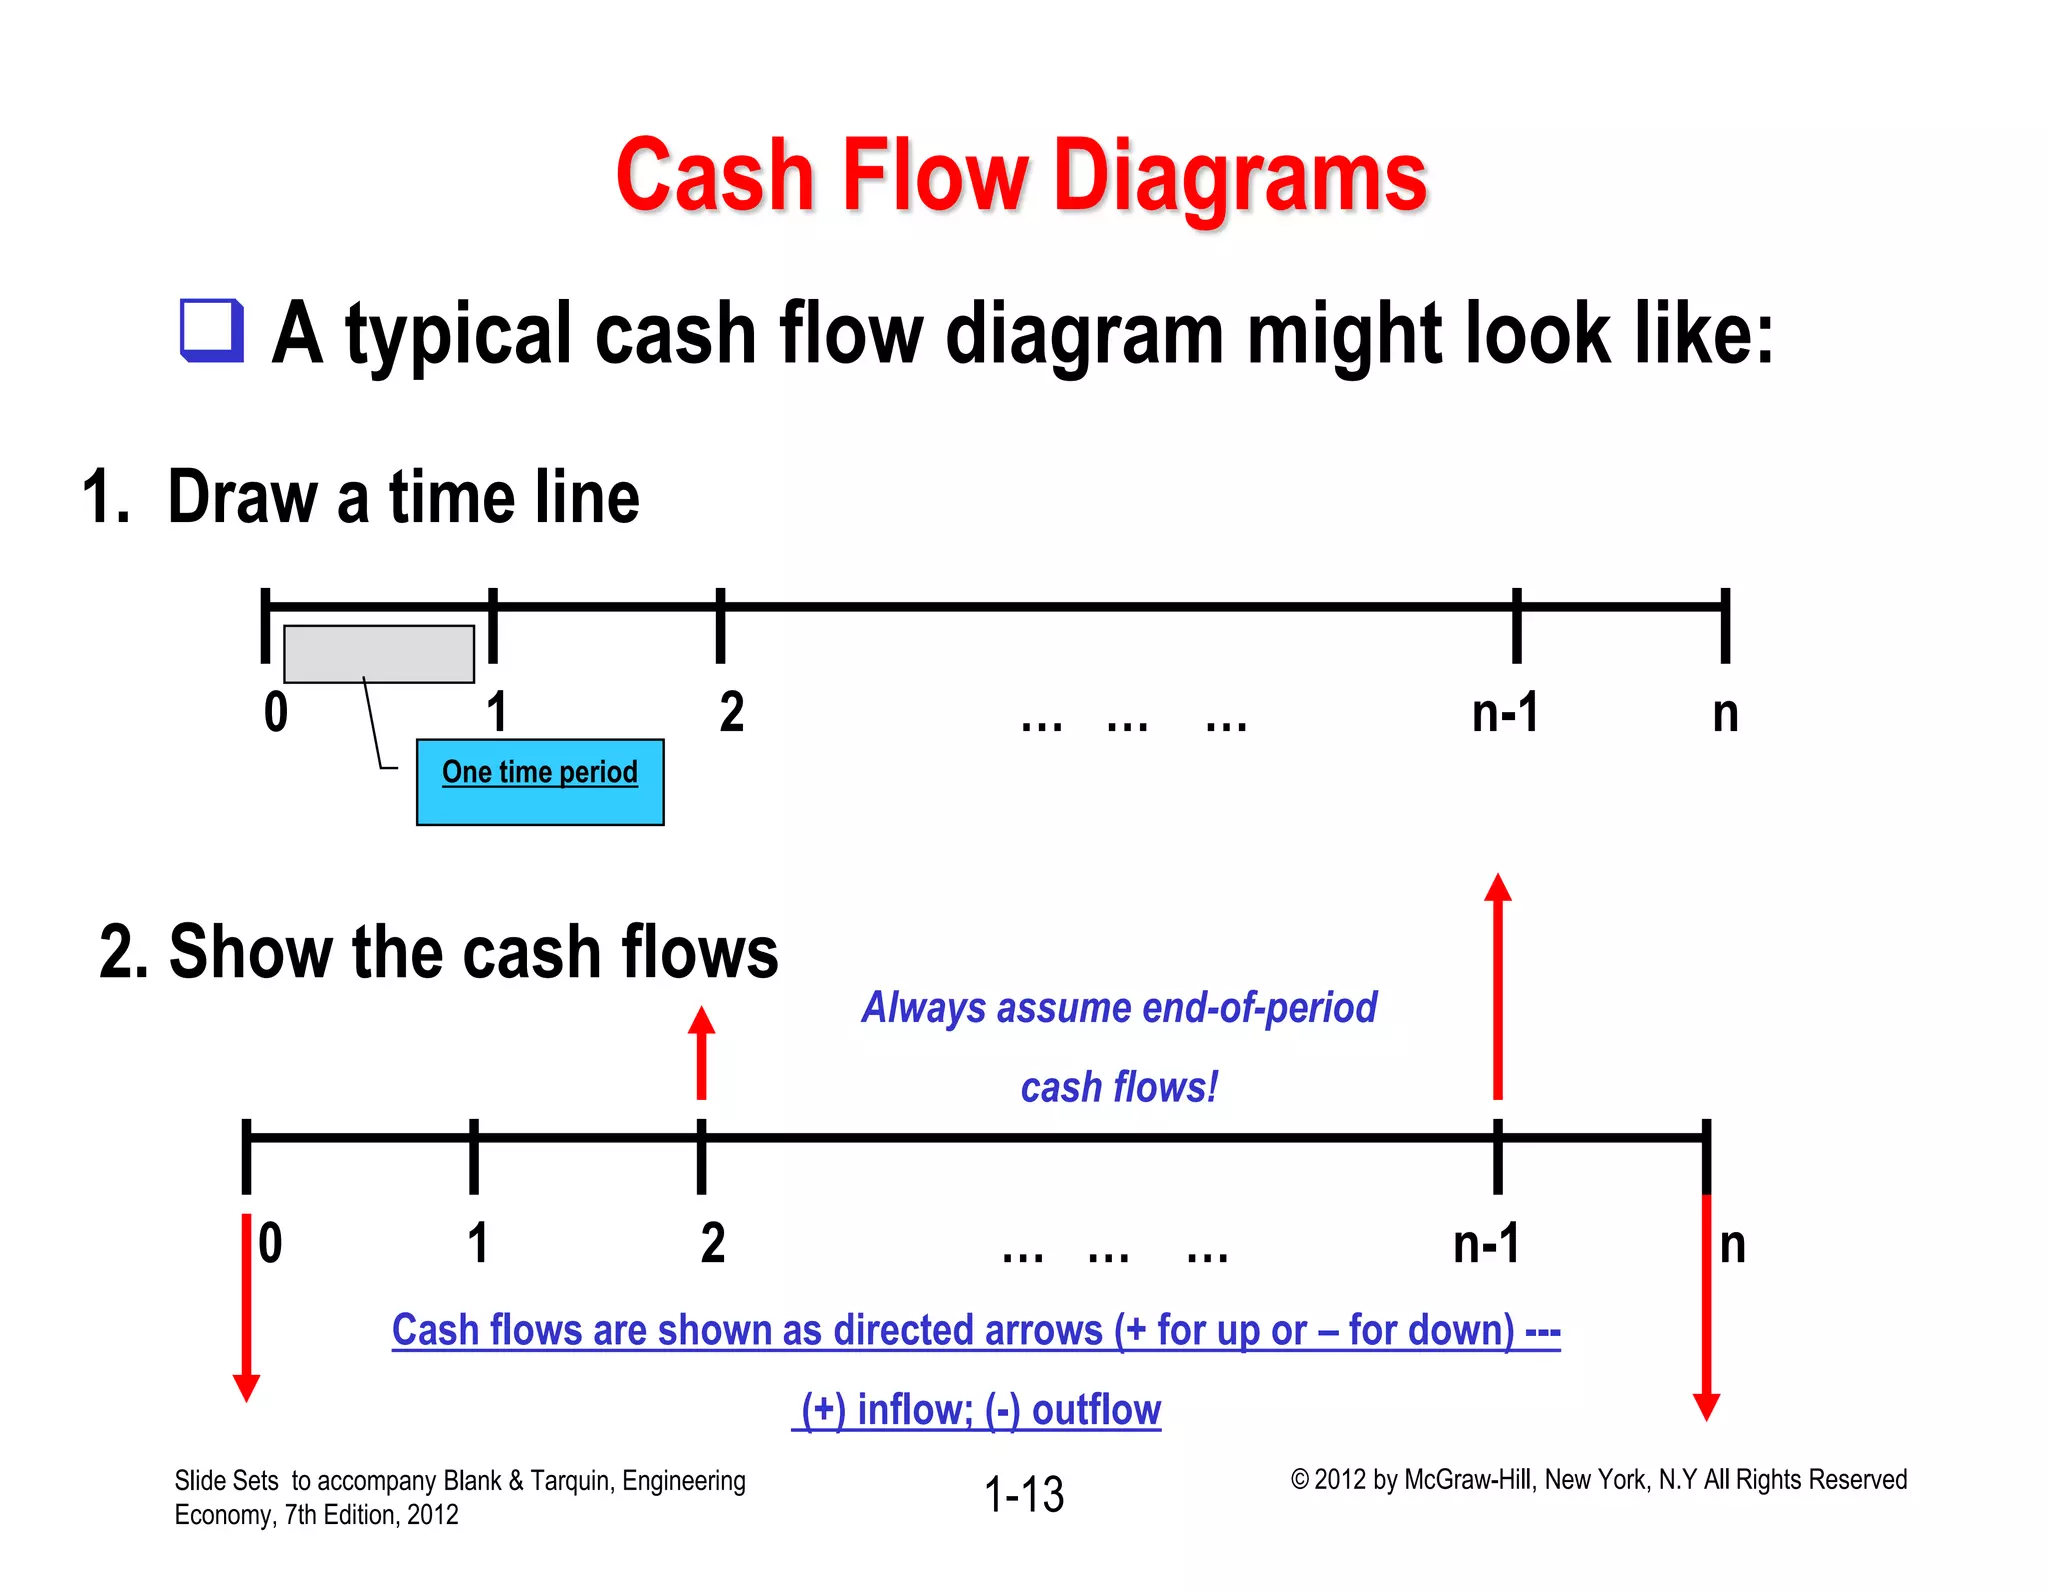
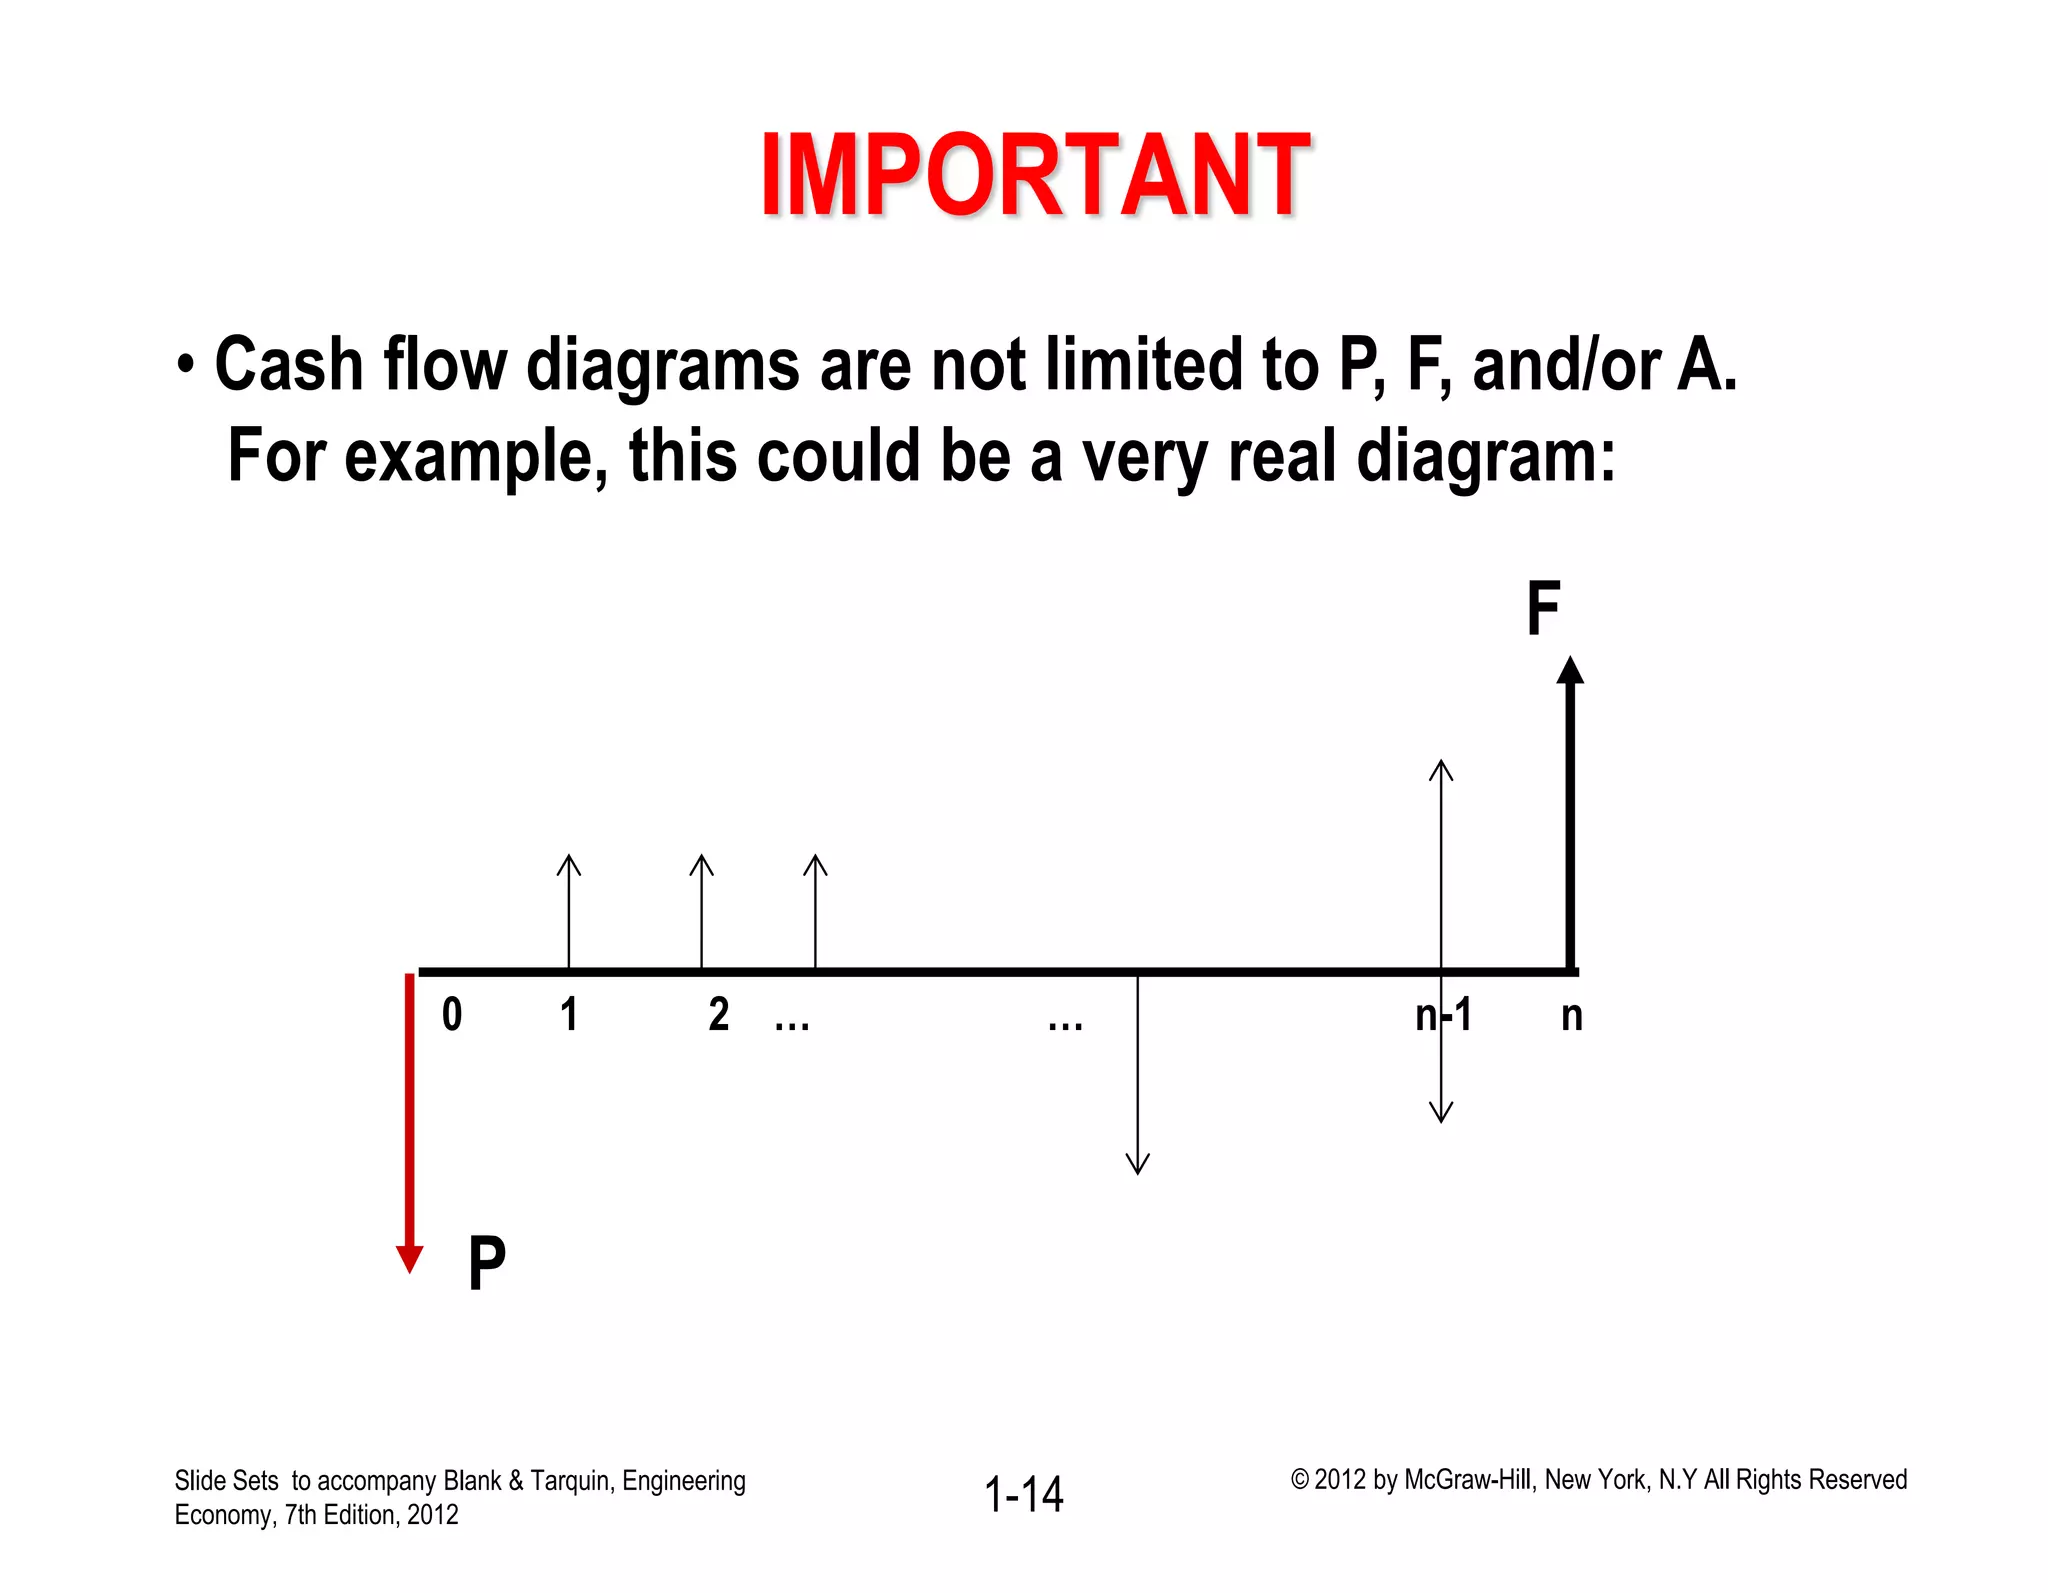
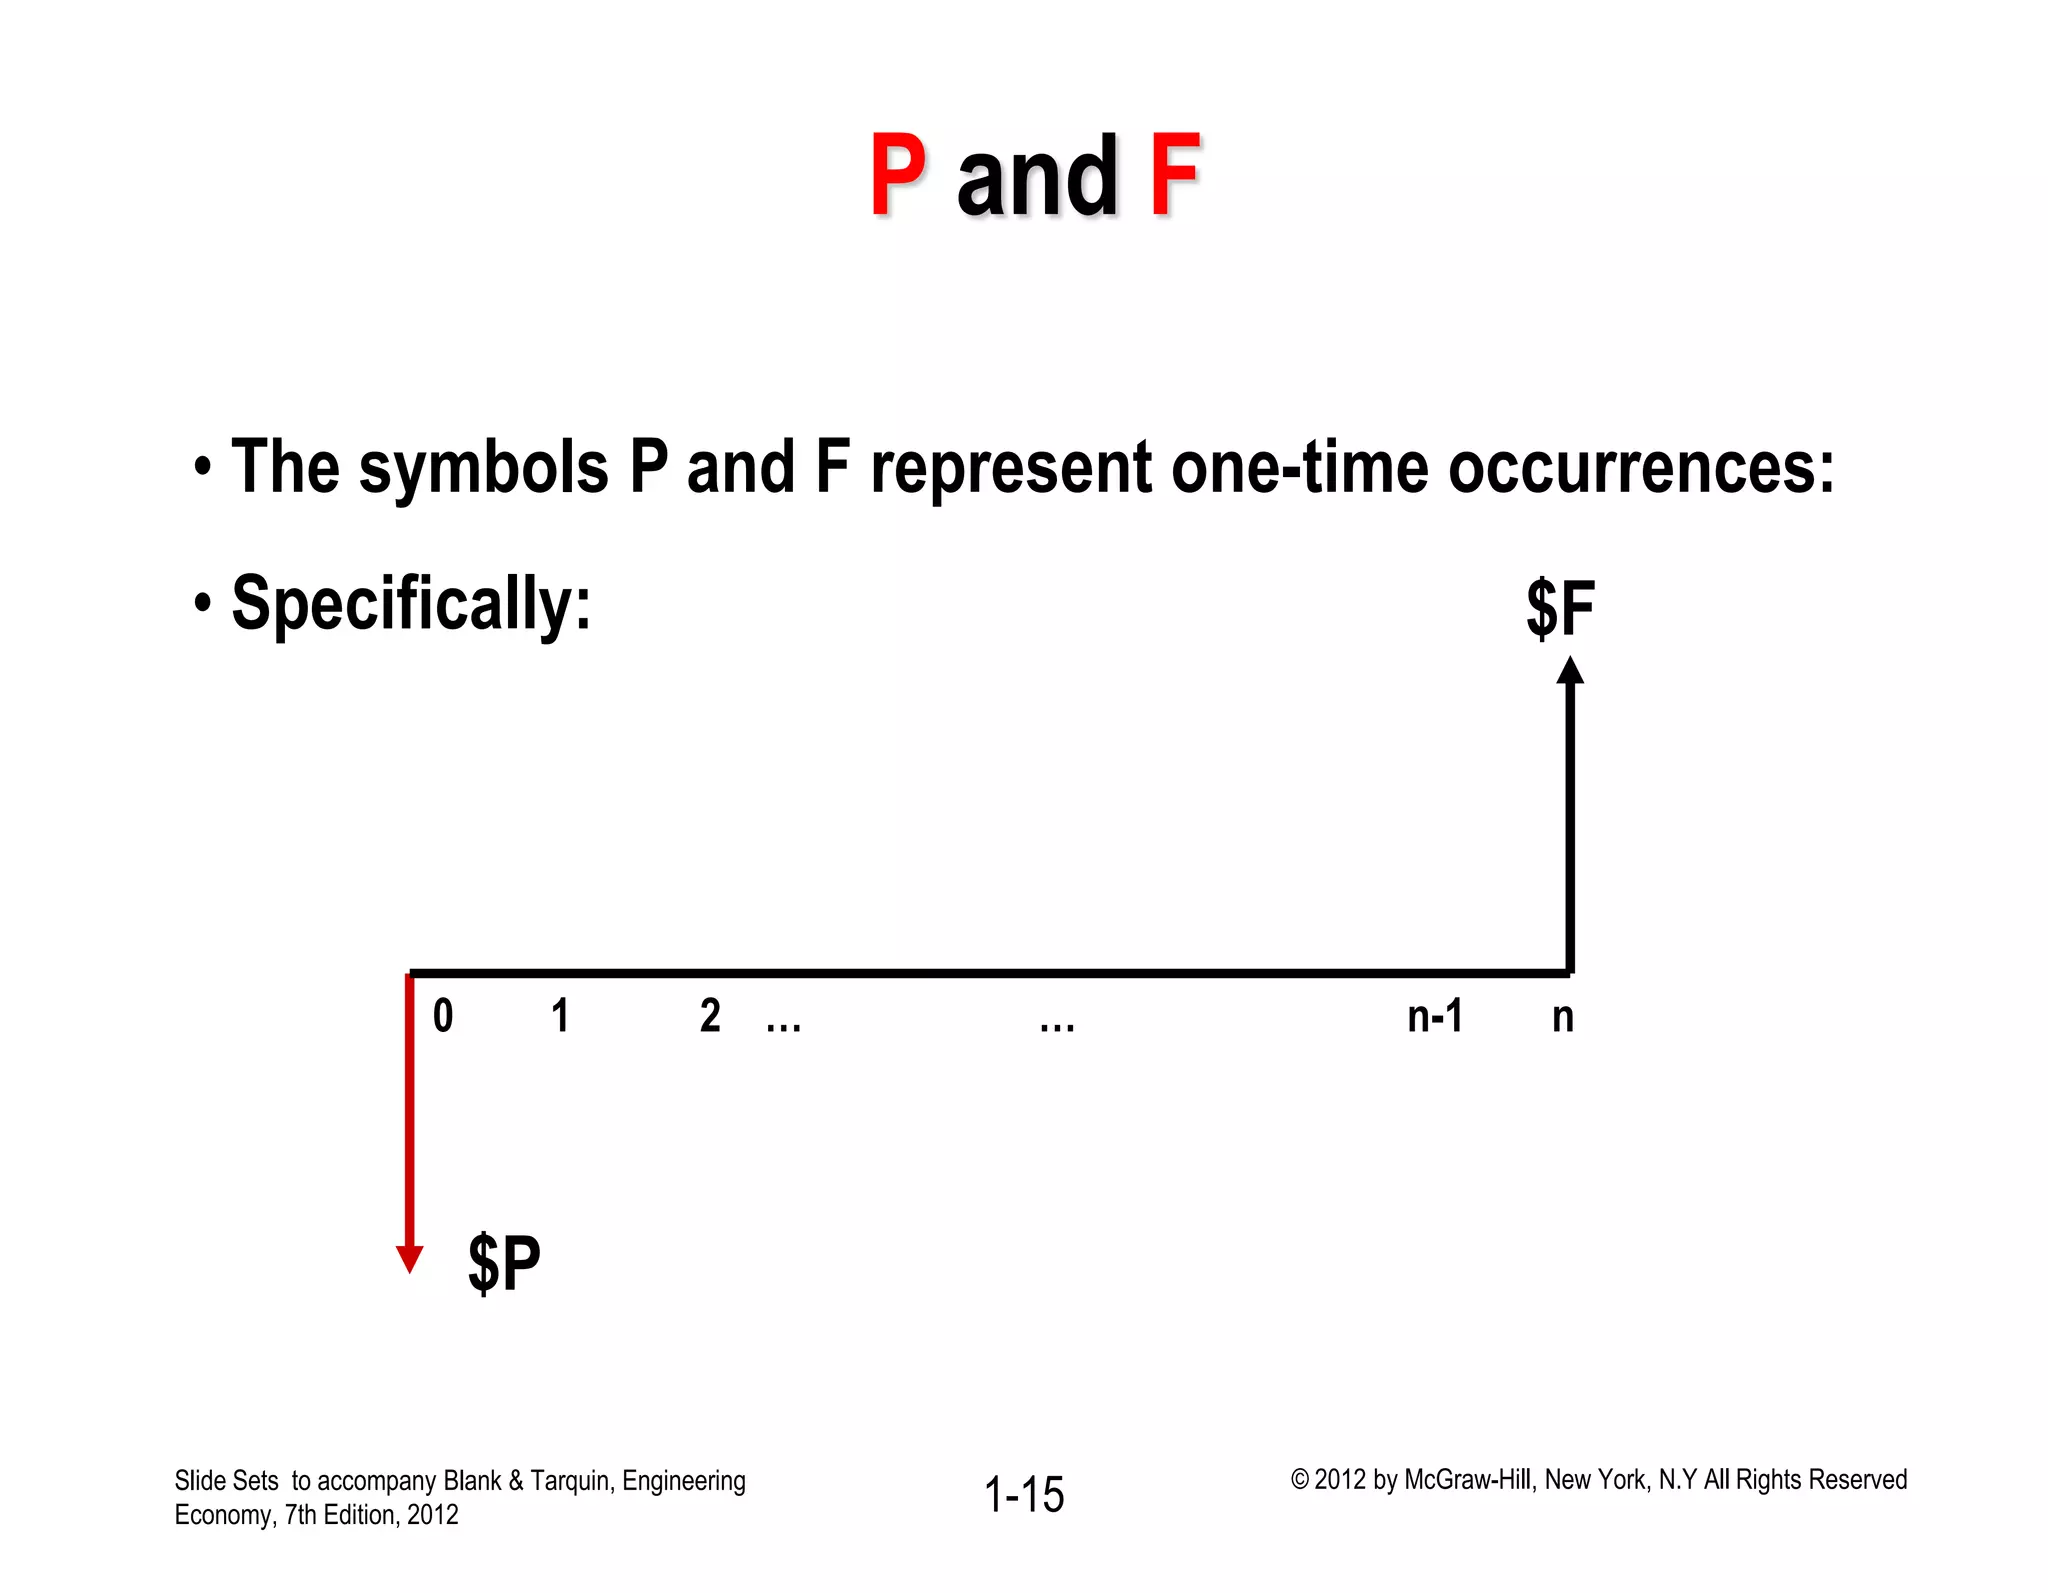
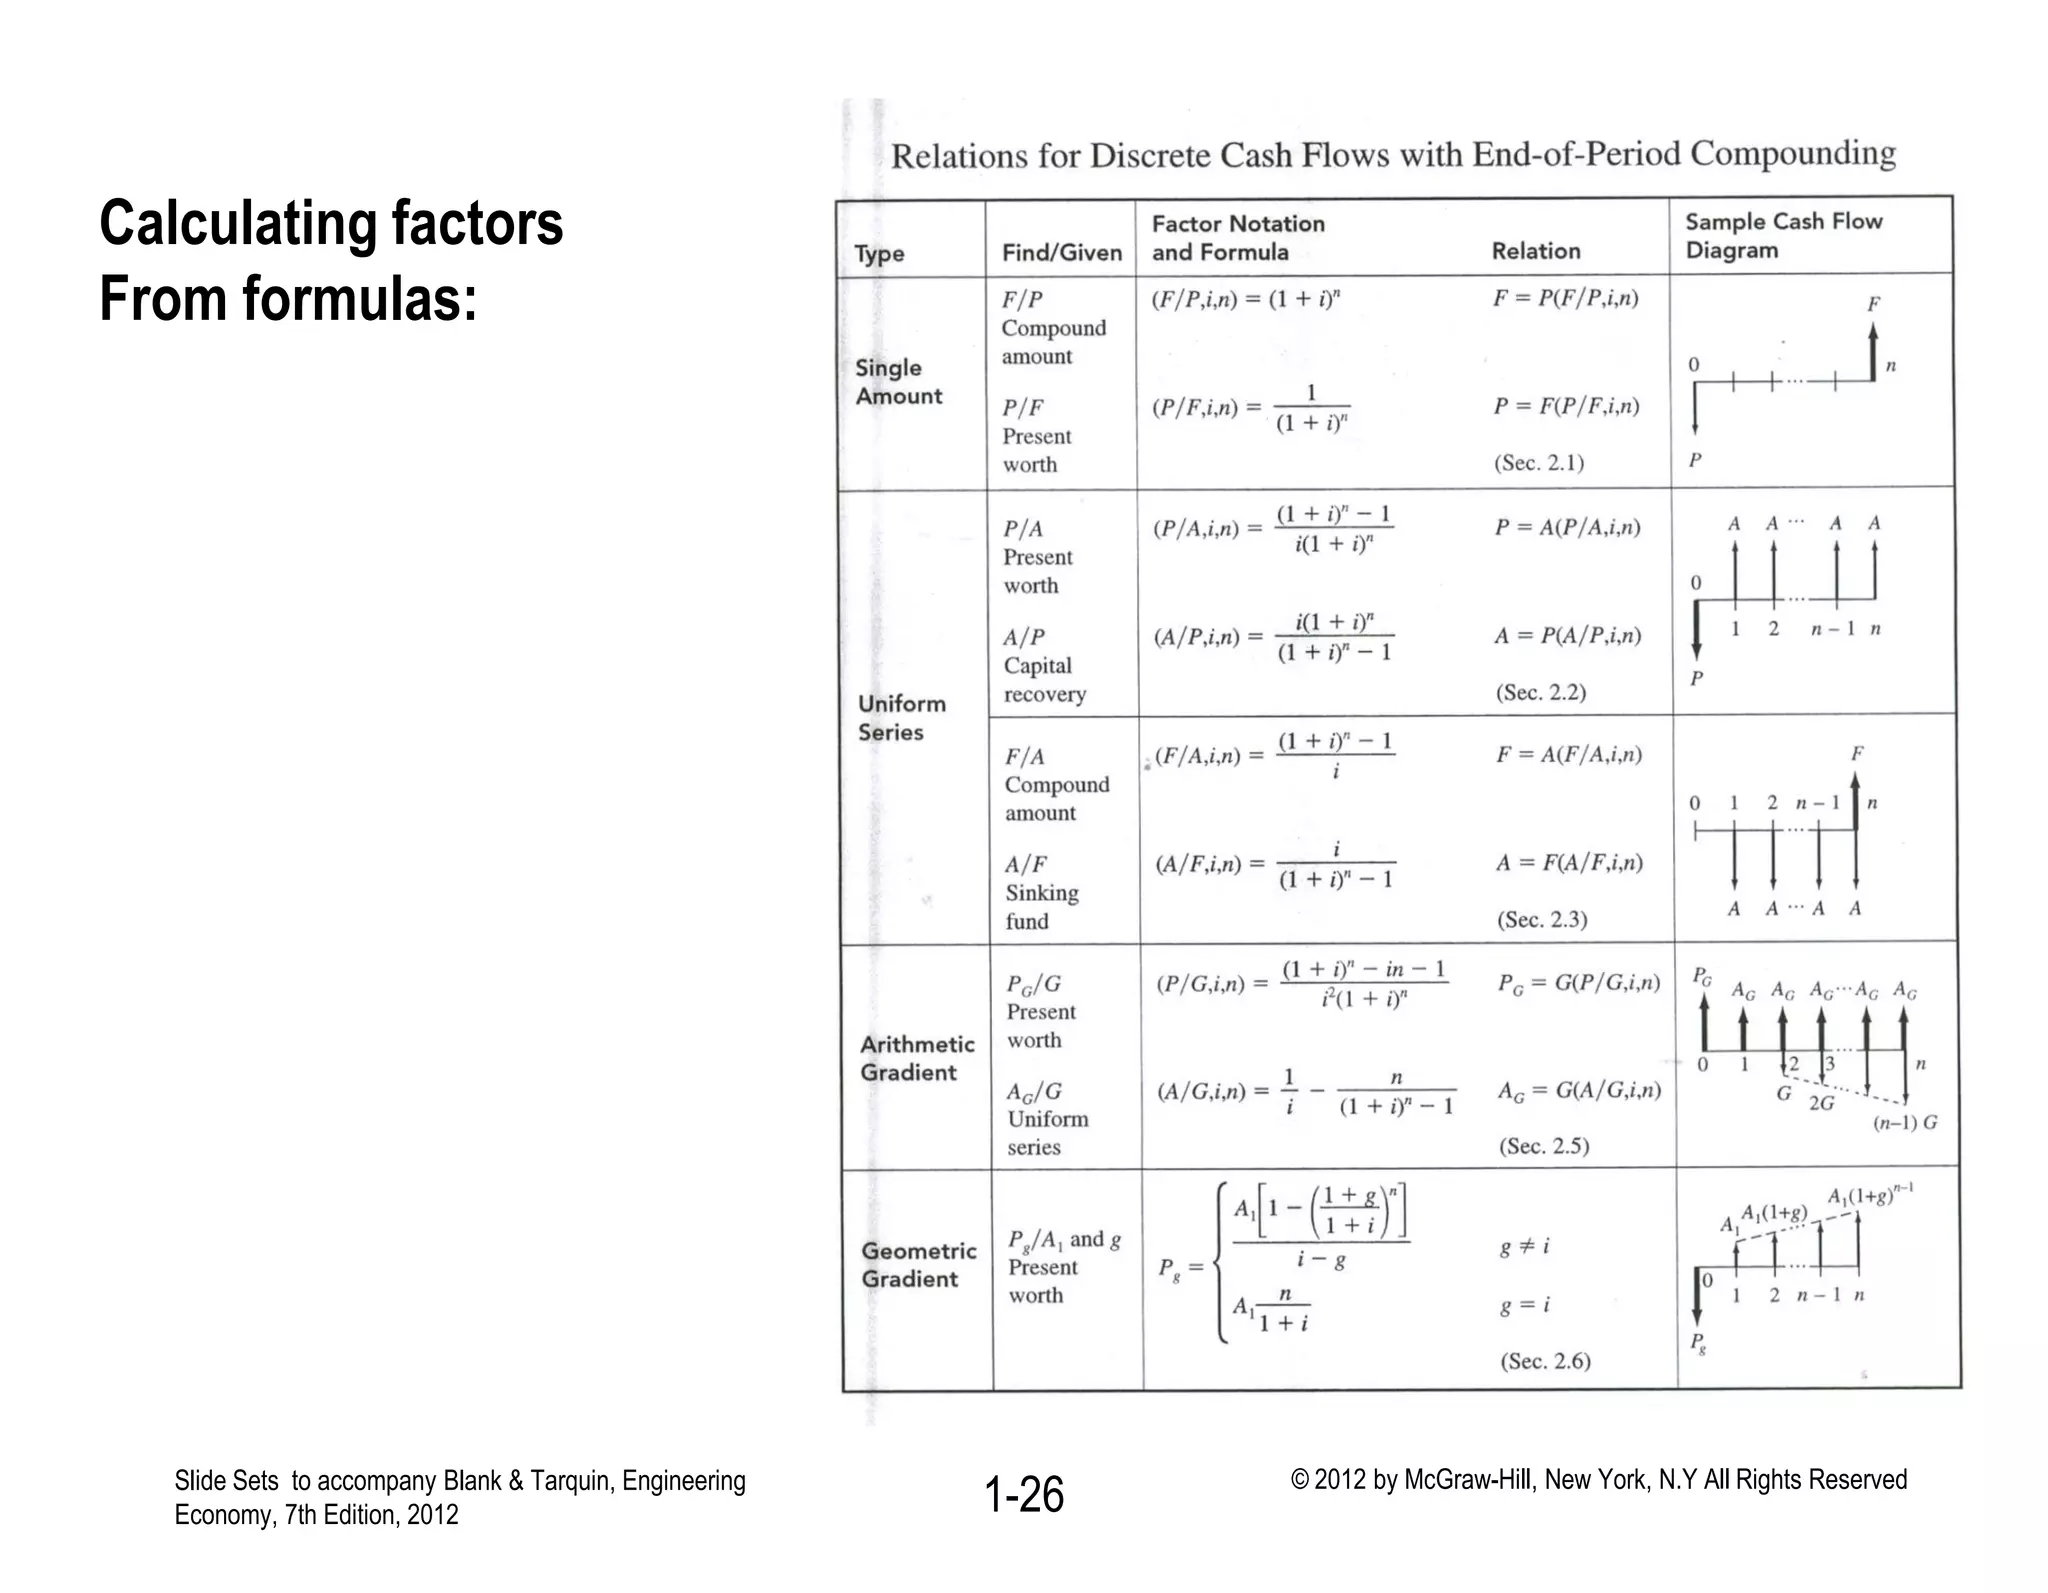
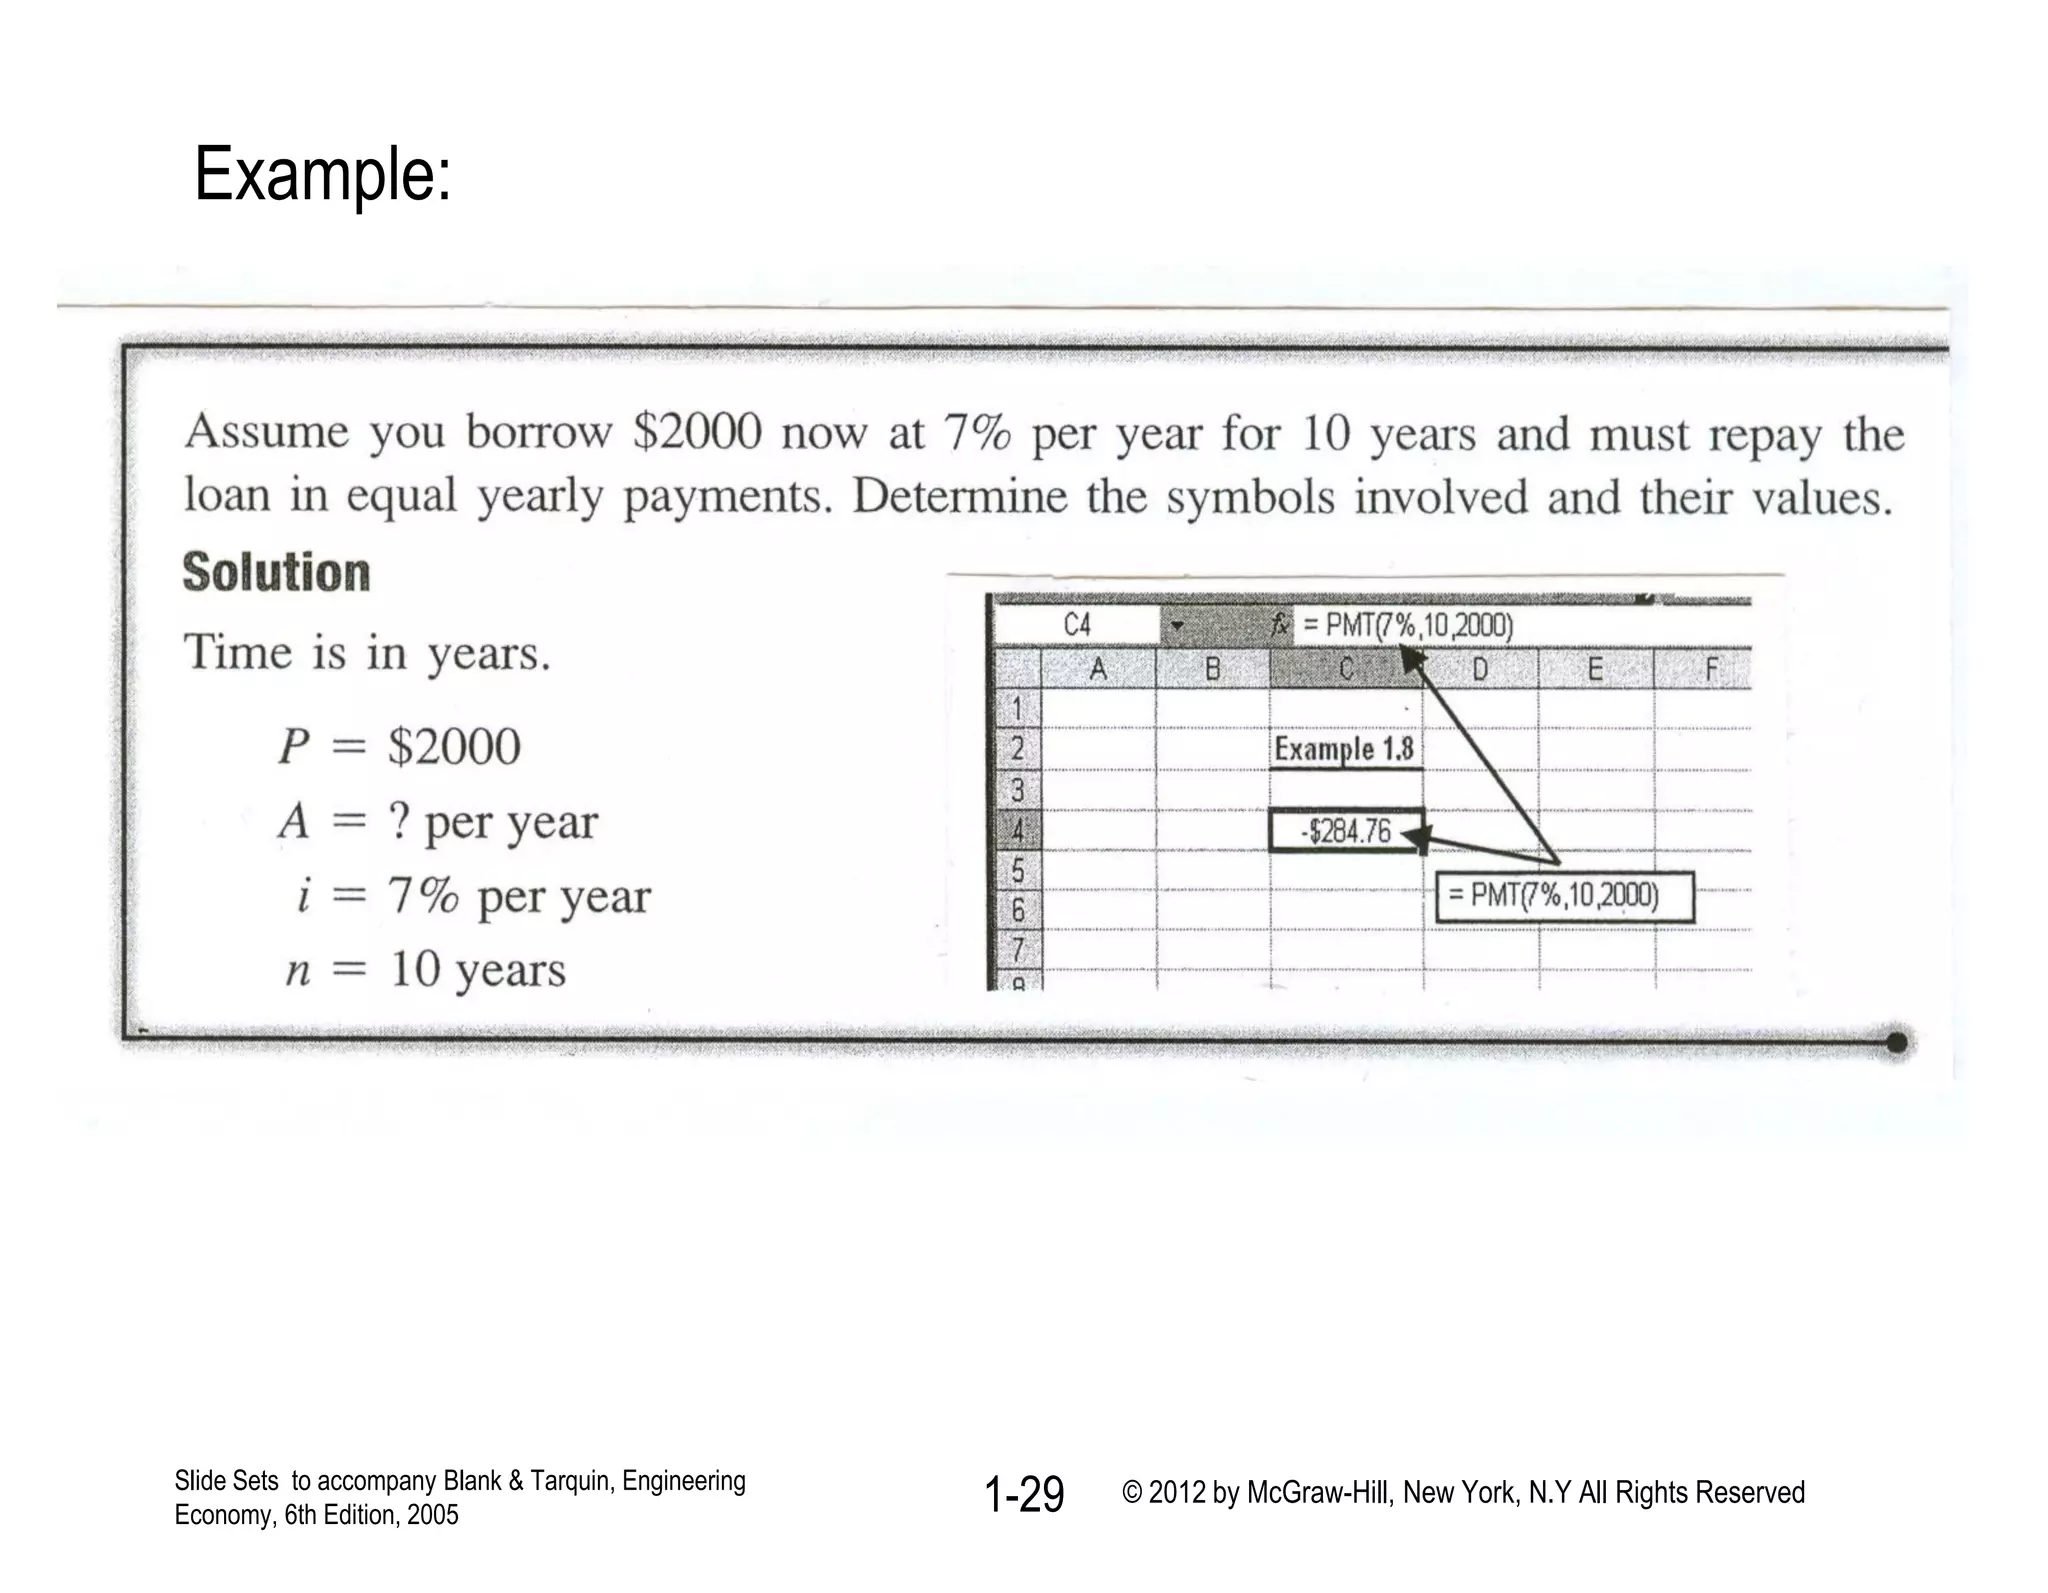

1. The document discusses the time value of money concept in engineering economy. It defines key terms like interest rate, present value, future value, simple interest, and compound interest. 2. Various interest factors like single payment compound amount, uniform series present worth, capital recovery, and sinking fund are introduced. Formulas and cash flow diagrams are provided for calculating these factors. 3. Microsoft Excel functions that can be used to compute time value of money calculations are also presented.


