Download to read offline


![Learning design
| 20
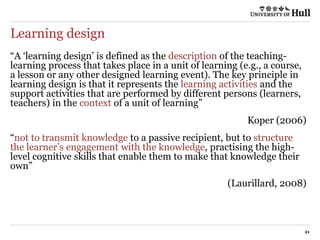
“We are moving from an instructional paradigm to a learning
paradigm — from offering information to designing learning
experiences ... from thinking about [courses and programs] as
an aggregation of separate activities to becoming an integrated
design.”
Bass, R. (2012)](https://image.slidesharecdn.com/live-learninganalyticslearningdesign-170317115320/85/Digifest-2017-Learning-Analytics-Learning-Design-20-320.jpg)


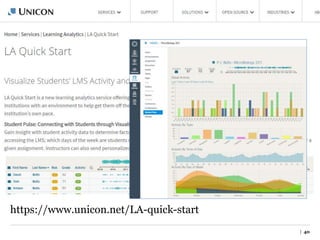

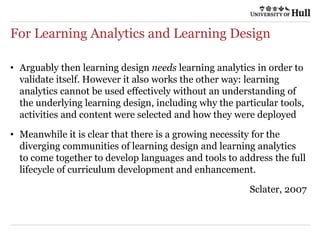


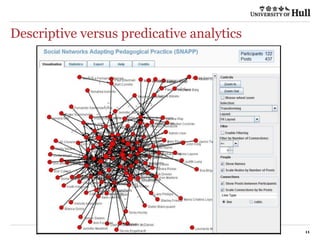
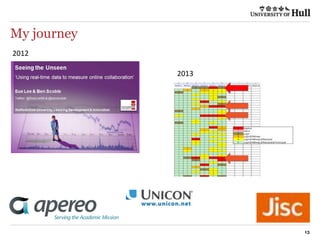
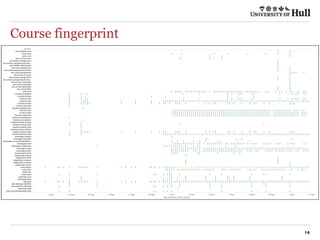
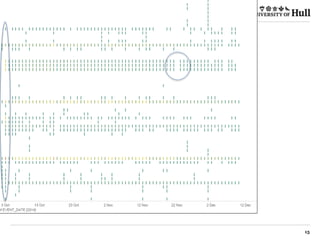
- Patrick Lynch discusses learning analytics and emphasizes the importance of learning design. He argues that learning analytics cannot be used effectively without understanding the underlying learning design and that learning design needs learning analytics to validate itself. - Lynch outlines his journey working with learning analytics since 2012 and describes how he uses analytics to inform course redesigns. He also discusses the need for learning design and analytics communities to work together to address the full lifecycle of curriculum development. - At Hull University, Lynch advocates for design to be a recognized activity with clear goals that identify data collection methods up front and build knowledge through learning design patterns shown to work or not in specific contexts.


