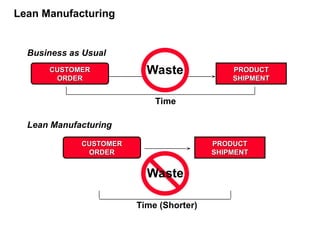
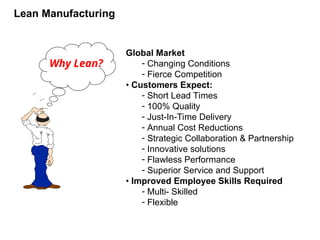
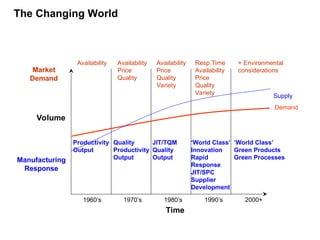
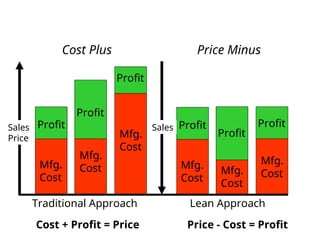
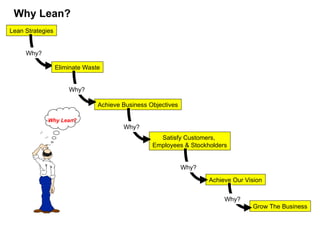
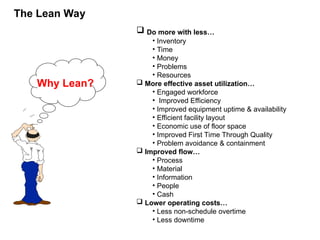
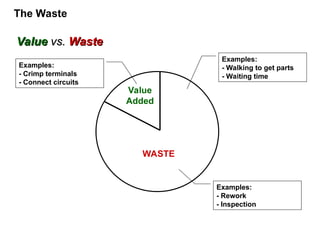
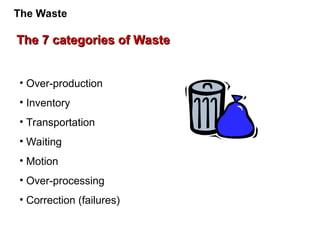
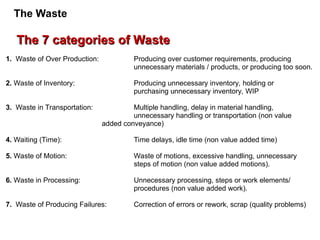
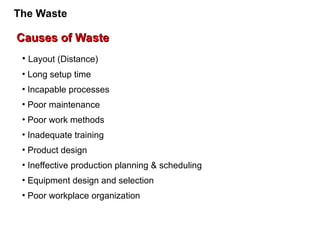
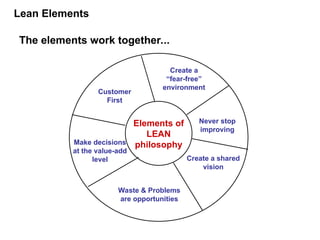
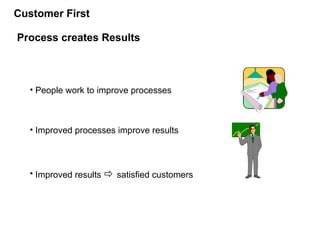
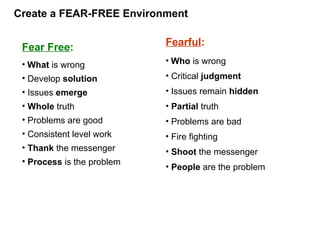
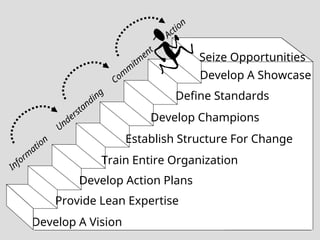
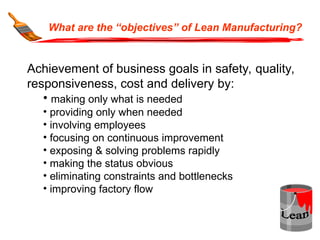
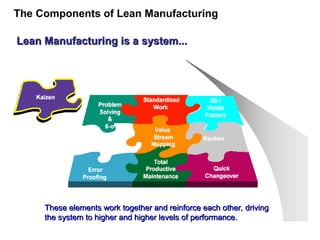
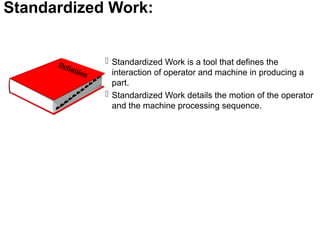
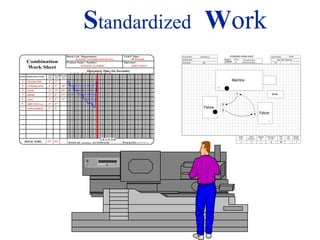
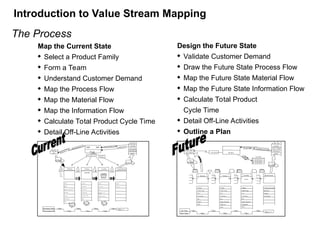
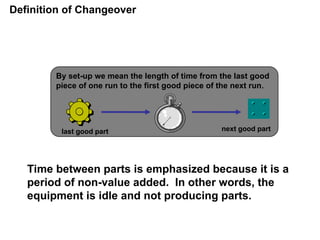
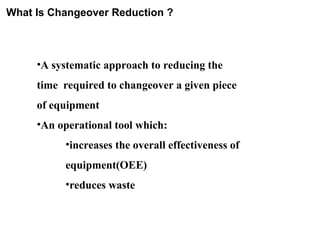
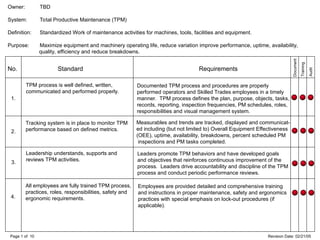
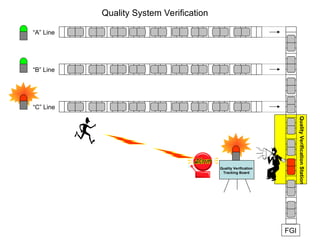
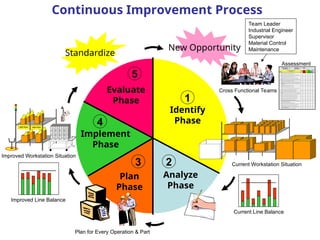
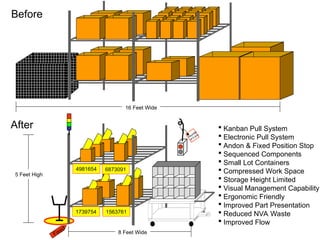
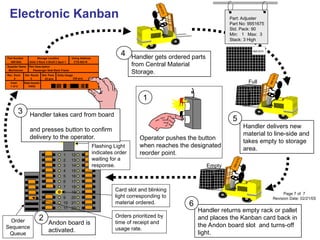
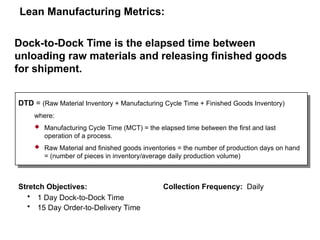
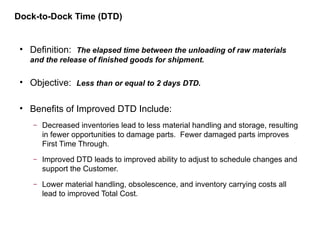
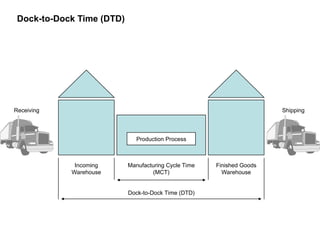
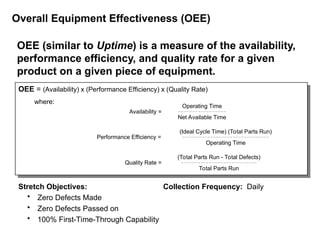
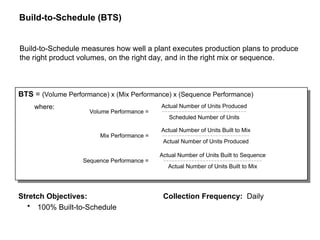
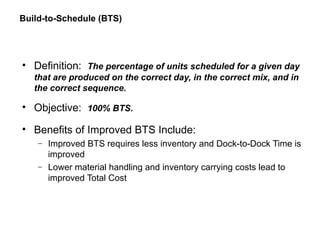
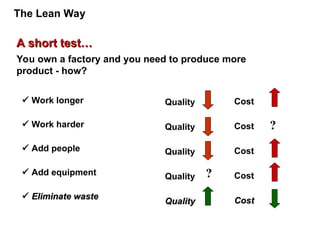
LEAN
LEAN
MANUFACTURING
MANUFACTURING AND
AND
ITS METRICS
ITS METRICS
• What is Lean Manufacturing ?
• What are the objectives of Lean Manufacturing ?
• The Components of Lean Manufacturing
• Lean Manufacturing Metrics
• Conclusion
Lean Manufacturing?
PRODUCT
PRODUCT
SHIPMENT
SHIPMENT
CUSTOMER
CUSTOMER
ORDER
ORDER
Time
Business as Usual
Lean Manufacturing
PRODUCT
PRODUCT
SHIPMENT
SHIPMENT
CUSTOMER
CUSTOMER
ORDER
ORDER
Time (Shorter)
Waste
Waste
Lean Manufacturing
Global Market
- Changing Conditions
- Fierce Competition
• Customers Expect:
- Short Lead Times
- 100% Quality
- Just-In-Time Delivery
- Annual Cost Reductions
- Strategic Collaboration & Partnership
- Innovative solutions
- Flawless Performance
- Superior Service and Support
• Improved Employee Skills Required
- Multi- Skilled
- Flexible
Why Lean?
Lean Manufacturing
Market
Demand
Manufacturing
Response
2000+
1990’s
1980’s
1970’s
1960’s
Time
Volume
Availability Availability
Price
Quality
Availability
Price
Quality
Variety
Resp.Time
Availability
Price
Quality
Variety
+ Environmental
considerations
Productivity
Output
Quality
Productivity
Output
JIT/TQM
Quality
Output
‘World Class’
Innovation
Rapid
Response
JIT/SPC
Supplier
Development
‘World Class’
Green Products
Green Processes
Supply
Demand
The Changing World
Sales
Price
Traditional Approach
Cost + Profit = Price
Cost Plus
Mfg.
Cost
Profit
Mfg.
Cost
Mfg.
Cost
Profit
Profit
Lean Approach
Price - Cost = Profit
Price Minus
Mfg.
Cost
Profit
Mfg.
Cost
Mfg.
Cost
Profit
Profit
Sales
Grow The Business
Achieve Our Vision
Why?
Satisfy Customers,
Employees & Stockholders
Why?
• Safety
• Quality
• Responsiveness
• Costs
Why Lean?
Achieve Business Objectives
Why?
Lean Strategies
Why?
Eliminate Waste
Why?
Why Lean?
 Do more with less…
• Inventory
• Time
• Money
• Problems
• Resources
 More effective asset utilization…
• Engaged workforce
• Improved Efficiency
• Improved equipment uptime & availability
• Efficient facility layout
• Economic use of floor space
• Improved First Time Through Quality
• Problem avoidance & containment
 Improved flow…
• Process
• Material
• Information
• People
• Cash
 Lower operating costs…
• Less non-schedule overtime
• Less downtime
Why Lean?
The Lean Way
It is an integrated system of mutually dependent
strategies that when combined together maximize
operating performance by elimination of wasteful
manufacturing practices.
Not a program!
Not a project!
Not an event!
What is Lean Manufacturing?
Lean Manufacturing Overview
Lean Manufacturing is…..
• A philosophy of eliminating non-value added
activities (i.e. waste)
• A culture of continuous improvement
• A way of thinking and taking a systems approach to
training and implementation
• An approach of empowering people
Lean Manufacturing …..
• FOCUSES ON TIME, (TIME =$$$)
• Reduces all non-value added activities:
• Shortens process time
• Gets products to customer quicker
• Improves productivity
• Improves quality
• Lowers cost and
• Increases customer satisfaction
• VALUE ADDED:
An activity that transforms or shapes raw materials or information to
meet customer needs
• WASTE:
Activities that consume time, resources and space, but do not
contribute to satisfying customer needs
VALUE
VALUE and
and WASTE
WASTE
The Waste
Value
Value vs.
vs. Waste
Waste
WASTE
Examples:
- Walking to get parts
- Waiting time
Examples:
- Crimp terminals
- Connect circuits
Examples:
- Rework
- Inspection
Value
Added
The Waste
The 7 categories of Waste
• Over-production
• Inventory
• Transportation
• Waiting
• Motion
• Over-processing
• Correction (failures)
The Waste
1. Waste of Over Production: Producing over customer requirements, producing
unnecessary materials / products, or producing too soon.
2. Waste of Inventory: Producing unnecessary inventory, holding or
purchasing unnecessary inventory, WIP
3. Waste in Transportation: Multiple handling, delay in material handling,
unnecessary handling or transportation (non value
added conveyance)
4. Waiting (Time): Time delays, idle time (non value added time)
5. Waste of Motion: Waste of motions, excessive handling, unnecessary
steps of motion (non value added motions).
6. Waste in Processing: Unnecessary processing, steps or work elements/
procedures (non value added work).
7. Waste of Producing Failures: Correction of errors or rework, scrap (quality problems)
The 7 categories of Waste
The Waste
Causes of Waste
Causes of Waste
• Layout (Distance)
• Long setup time
• Incapable processes
• Poor maintenance
• Poor work methods
• Inadequate training
• Product design
• Ineffective production planning & scheduling
• Equipment design and selection
• Poor workplace organization
The Waste
The waste of INVENTORY...
The Waste
Elements of
LEAN
philosophy
Create a
“fear-free”
environment
Never stop
improving
Create a shared
vision
Make decisions
at the value-add
level
Waste & Problems
are opportunities
Customer
First
The elements work together...
Lean Elements
Process creates Results
• People work to improve processes
• Improved processes improve results
• Improved results  satisfied customers
Customer First
Fear Free:
• What is wrong
• Develop solution
• Issues emerge
• Whole truth
• Problems are good
• Consistent level work
• Thank the messenger
• Process is the problem
Fearful:
• Who is wrong
• Critical judgment
• Issues remain hidden
• Partial truth
• Problems are bad
• Fire fighting
• Shoot the messenger
• People are the problem
Create a FEAR-FREE Environment
Identification is the First Step
Lean is based on identifying and eliminating waste
• Not all waste can be eliminated immediately
• Identification of waste makes the opportunity for improvement visible
• Process creates results. Use results to define areas for improvement
Waste & Problems are Opportunities
 Develop systems to encourage change to occur where the value is added
• Don’t develop a suggestion system
• Do develop an implementation system
 A plan for improvement is worth nothing until it is implemented
 Implement ideas, this is the true measure of Lean Manufacturing success
 Standardize, Improve... then Innovate
• Lean comes before innovation
• Normally no cost or low cost
Make Decisions at the Value-Add Level
 Lean involves everyone in the organization
 Lean crosses all organizational boundaries and should be a key
component of the organizational strategy
 Departments should strive to understand and support the total
organization, not individual department goals
 LEAN is an umbrella...
Create a Shared Vision
• 6 Sigma
• Error Proofing
• Total Productive
Maintenance (TPM)
• Material control
• TAKT Time
• Standardised work
• Quick Changeovers
• Just in Time (JIT)
• Small Group Activities
• Workshop Organisation
• Visual Management
Lean Manufacturing Umbrella
Develop A Vision
Establish Structure For Change
Provide Lean Expertise
Define Standards
Develop Champions
Train Entire Organization
Develop Action Plans
Develop A Showcase
Inform
ation
Understanding
Com
m
itm
ent
Action
Seize Opportunities
What are the “objectives” of Lean Manufacturing?
Achievement of business goals in safety, quality,
responsiveness, cost and delivery by:
• making only what is needed
• providing only when needed
• involving employees
• focusing on continuous improvement
• exposing & solving problems rapidly
• making the status obvious
• eliminating constraints and bottlenecks
• improving factory flow
Flow Information
Flow Material
Full
Empty
Walk
Install
Walk
Walk
Walk
Install
Install
Install
Flow Operations
Flow Process
FIFO FIFO
● People are comfortable with extra inventory, WIP, manpower and
excess capacity because it covers-up sins.
● People will adamantly defend excesses and what they created.
● Resistance to change is inevitable.
● Lean takes people out of their comfort zone because it exposes things.
● Be prepared (plan) for redeployment of displaced people.
● People issues will arise.
● Some folks view the word “Lean” as “Mean”.
● If we were capable and willing to make productivity gains… we would
have done it already (I.E. talent depth? Training? Politics?)
● Linking headcount reduction directly with Lean Systems implementation
could spell problems.
● There will be some short term pain for long term gain.
Beware!
Lean Manufacturing is a system...
The Components of Lean Manufacturing
These elements work together and reinforce each other, driving
the system to higher and higher levels of performance.
Standardized Work:
 Standardized Work is a tool that defines the
interaction of operator and machine in producing a
part.
 Standardized Work details the motion of the operator
and the machine processing sequence.
Benefits of Standardized Work
• Reduce variations in the process
• Reduce the opportunities for error
• Describe the best method at the
present time
• Clearly illustrate the relationship
between TAKT time and Cycle time.
Standardized Work
Combination
Work Sheet
Work Cell / Department:
Product Name / Number:
TAKT Time:
Operator:
Operation Time (In Seconds)
MASTER CYLINDER MACHINING
MASTER CYLINDER
40 Seconds
MANUAL ----------, AUTOMATIC - - - - - - , WALKING
L E G E N D
JOHN SMITH
1
2
3
4
5
6
7
2"
2"
2"
2"
2"
2"
2"
2"
4"
5"
4"
3"
6"
2"
28"
29"
27"
12"
14" 26"
5 10 15 20 25 30 35 40 45 50 55
Quality
Check
Safety
Precautions
Standard
WIP
# of pieces of
Std. WIP
TAKT
Time
Net
Time
Operator
Number
Process Name:
Model Number:
Model Name:
Date Prepared:
Dept. Head / Supervisor
STANDARD WORK SHEET
Scope of
Operations
From
To
Push palm buttons
Add velcro and pass
Cycle Machine
ABC
1/30/96
Joe
Machine
Fixture
Fixture
1
2
3
4
Grinder
2 62 1
A value stream is all the actions (both value-added
and non value-added) currently required to bring a
product through the main essential flows:
1. The product flow from raw material to the customer
2. The design flow from concept to launch
What is Value Stream Mapping?
Value stream mapping is a pencil and paper tool that helps
you to see and understand the flow of material and
information as a product makes its way through the
value stream
Scrap
Manufacturing
Process
Kaizen
Lightning
Burst
Outside
Source/
Customer
Data Box
Inventory
I
o o o
Truck
Shipment
Finished
Goods to Customer
Push Arrow
Supermarket
Buffer or
Safety Stock
Manual
Information Flow
Electronic
Information Flow
Production Kanban
Withdrawal Kanban
Signal Kanban
Kanban Post
Michigan
Steel CO.
500 ft coils
STAMPIN G
200 T
C/T = 1 second
C/O = 1 hour
Uptime = 85%
27,000 sec. avail.
EPE = 2 weeks
I
C/T = 38 seconds
C/O = 10 minutes
Uptime = 85%
27,000 sec. avail.
EPE = 2 weeks
I
S. WELD # 1
I
S. WELD # 2
I I I
Coils
5 days
4600 L
2400 R
1100 L
600 R
1600 L
850 R
1200 L
640 R
2700 L
1440 R
ASSEMBLY #1
C/T = 45 seconds
C/O = 10 minutes
Uptime = 100%
2 Shifts
27,000 sec. avail.
ASSEMBLY # 2
C/T = 61 seconds
C/O = 0
2 Shifts
Uptime= 100%
27,000 sec. avail.
SHIPPING
Staging
C/T = 39 seconds
C/O = 0
Uptime = 100%
2 Shifts
27,000 sec. avail.
18,400 p cs/mo
-1 2,400 “L”
- 6 ,400 “R ”
Tray = 20 pieces
2 Shifts
State Stre et
Assemb ly
Tues. & Thurs.
1X Daily
6 - week
Forecast
Weekly Fax
PRODUCTIO
CONTROL
MRP
90/60/30 day
Forecasts
Daily Order
Weekly Schedule
Daily Ship
Schedule
5
days 1 second
7.6 days
38 seconds
1.8 days
45 seconds
2.6 days
61 seconds
2 days
39
seconds
4 .5 daysProduction
Lead Time= 23.5 days
Value Added Time=
184 sec.
Mapping the
Current State
What is Value Stream Mapping?
Value Stream Analysis is a powerful, flexible, visual tool, which enables
everybody to interpret the steps of a process, and highlight the lead
time and the waste it contains.
The map if kept dynamic, will help to prioritize the continuous
Improvement (Kaizen) & Six Sigma activities and develop the action
plans for implementing lean strategically into an organization.
Why use Value Stream Mapping?
• It helps you visualize more that just a single process
• Provides a visual model of material and information flow
• Helps identify various sources of waste
• Provides a common language for talking about manufacturing processes
• Makes decisions about the flow apparent
•Demonstrates the linkage between information and material flow
Objectives of Value Stream Mapping
Customer
Demand/month:
Part A =
Part B =
Part C =
# of shifts =
Step 4: Map the Process Flow
Inventory
Part A =
Part B =
Part C =
# of shifts =
Shipping
Assembly
Welding
Stamping
Takt =
C.T. =
D.T. =
FTQ = 90%
C/O Time =
Lot Size =
# of Shifts
WIP =
Takt =
C.T. =
D.T. = 20%
FTQ =
C/O Time =
Lot Size =
# of Shifts
WIP =
Takt =
C.T. =
D.T. =
FTQ =
C/O Time = 4 hrs.
Lot Size =
# of Shifts
WIP =
Changeover Downtime FTQ
Map Current State
Customer
Demand/month:
Part A =
Part B =
Part C =
# of shifts =
Step 5: Map the Material Flow
Inventory
Part A =
Part B =
Part C =
# of shifts =
Shipping
Assembly
Welding
Stamping
Takt =
C.T. =
D.T. =
FTQ = 90%
C/O Time =
Lot Size =
# of Shifts
WIP =
Takt =
C.T. =
D.T. = 20%
FTQ =
C/O Time =
Lot Size =
# of Shifts
WIP =
Takt =
C.T. =
D.T. =
FTQ =
C/O Time = 4 hrs.
Lot Size =
# of Shifts
WIP =
Changeover Downtime FTQ
I I I
I
500 pcs
1,200 pcs 1,500 pcs 800 pcs
Map Current State
Customer
Demand/month:
Part A = 705 pcs.
Part B = 600 pcs.
Part C = 1650 pcs.
# of shifts =
Inventory
Part A = 750 pcs
Part B = 600 pcs
Part C = 1650 pcs
# of shifts =
Shipping
Assembly
Welding
Stamping
Takt =
C.T. =
D.T. =
FTQ = 90%
C/O Time =
Lot Size =
# of Shifts
WIP = 550 pcs.
Takt =
C.T. =
D.T. = 20%
FTQ =
C/O Time =
Lot Size =
# of Shifts
WIP = 60 pcs.
Takt =
C.T. =
D.T. =
FTQ =
C/O Time = 4 hrs.
Lot Size =
# of Shifts
WIP = 25 pcs.
Changeover Downtime FTQ
I I I
I
2 x/
day
2 x/
week
Supplier
1,200 pcs 1,500 pcs 800 pcs 500 pcs
PC & L
Weekly Build Schedule
Daily Ship Schedule
6 week rolling
forecast
6 week rolling
forecast
Weekly Order
Weekly Order
Step 6: Map the Information Flow
Map Current State
Map the Current State
 Select a Product Family
 Form a Team
 Understand Customer Demand
 Map the Process Flow
 Map the Material Flow
 Map the Information Flow
 Calculate Total Product Cycle Time
 Detail Off-Line Activities
The Process
Design the Future State
 Validate Customer Demand
 Draw the Future State Process Flow
 Map the Future State Material Flow
 Map the Future State Information Flow
 Calculate Total Product
Cycle Time
 Detail Off-Line Activities
 Outline a Plan
Tues. & Fri.
PC & L
Weekly Order
MRP MSS
Weekly Order
# times/day
Steel
Supplier
Steel
Pin
# pcs
# days
or shifts
I I
I
I
Stamping
Downtime
Changeover Time=4 hr
2 Shifts
TAKT =
2 Presses
Cycle Time =
Change
Over
Welding
Layout
Scrap/Rework
Downtime = 20%
Uptime
# Operators
Cycle Time =
Weekly Build Schedule
Daily Ship
Schedule
6 Week Rolling Forecast
Finished Goods
Overtime =
# Shifts =
Assembly
DT, Scrap
Rework
WIP =
Cycle Time =
TAKT =
Changeover Time =
Layout
= 10%
Scrap
? days ? days ? days ? days
? days ? days ? days
Inventory Time
Processing Time
TPc/t = ?
TAKT =
WIP =
WIP = WIP =
X pcs/month
Std. Pack Qty.
# shifts
Customer
Finished Goods
Assembly
Layout
Welding
Rolling 6-wk Forecast
Weekly Order
6 x / Day
PC & L
6-wk forecast
Daily
Level Box
DA1
DA2
DA3
C/O Time =
CT =
TAKT Time
3 Shifts
DT =
Scrap =
Stamping
0 Overtime
2 Shifts
Max Size
# Material Handlers
C/O Time =
CT =
TAKT Time
3 Shifts
DT =
Scrap / Rework =
C/O Time =
CT =
TAKT Time
3 Shifts
DT =
Scrap / Rework=
Small Lot # Operators
Customer
X pcs / month
Std Pack Qty
# Shifts
WIP =
WIP = WIP =
Steel Supplier
Inv.Time
Proc .Time
TPc/t = ?
? days ? days ? days ? days
? days ? days ? days
Introduction to Value Stream Mapping
Be Wise…
Observe…it is necessary to physically
observe the value stream. This provides
the greatest opportunity to identify and
eliminate waste.
Be Persistent...
Value stream mapping is an iterative
process. Todays future state is
tomorrows current state. This is what
continuous improvement is all about.
Getting Started
Summary
Safety and emergency equipment
are located and organized to assure
easy access and use.
Fire alarms, hoses, extinguishers, emergency exits, emergency line
stops and evacuation procedures are strategically placed, readily
accessible and easy to locate (not obstructed).
6
7
8
Effective employee training and
awareness is provided.
Workplace Organization (Five ‘S’) training classes and awareness
communications are used on a continuous basis to educate the entire
workforce and to reinforce compliance to the plant Five ‘S’ guidelines.
Material inventory is stored and
arranged in an organized and safe
manner.
All material containers (full and empty) are stored in a designated
location. Safe storage stacking heights are maintained and adequate
clearance is provided at aisle intersections to enable a clear view in all
directions.
No. Standard Requirements
Document
Training
Audit
Page 2 of 8 Revision Date: 02/21/05
Owner: TBD
Subject: Workplace Organization (Five ‘S)
Definition: A safe, clean, neat and orderly arrangement of the workplace.
Purpose: To provide a place for everything and assure that everything is in the correct location by providing the ability to
see the status at a glance and distinguish between standard or out-of-standard conditions.
Five “S” Workplace Organization
training is provided and improvement
activities are in place.
Five “S” Kaizen events are periodically conducted to train the entire
workforce in Workplace Organization principles. A “Red Tag” process
Is in place and events are conducted to identify Excess and
obsolete tools, equipment and material are tagged and segregated for
disposition.
9
Owner: TBD
System: Practical Problem Solving Process
Definition: Simple analytical methodology for analyzing and resolving out of standard conditions.
Purpose: To fully engage employees in finding solutions to recurring issues and implementation of permanent countermeasures.
Page 1 of 6 Revision Date: 02/21/05
No. Standard Requirements
Document
Training
Audit
Problems are effectively resolved at the appropriate level with
permanent countermeasures implemented before being
elevated to higher level or more technical analytical tools.
Communication process is in place to
transfer information from problem solving
activities.
On-going Practical Problem Solving training
is provided to all employees.
Practical Problem Solving is used first as a
means of resolving issues before higher
level tools are applied.
Practical Problem Solving (PPS) process is in
place and employees are actively engage in
on-going activities.
Structured approach and standardized methodology is used
in a common manner throughout the entire organization.
Teams meet and use the PPS to solve problems.
Bulletin boards, publications, website, team meetings and
structured PPS progress reviews are used to explain results
and showcase improvement ideas.
Continuous PPS training is provided to all employees. Training
schedules are posted and classes conducted. Adequate
resources and time is allocated to conduct training.
Top Leadership is actively involved in
mentoring and conducting regular progress
reviews.
Job responsibilities and incentives are in place to assure that
top Leaders mentor, coach and educate and employees.
Leaders are expected to mentor direct reports.
1.
2.
3.
4.
5.
Practical Problem Solving Model
Identify
Phase
Analyze
Phase
Plan
Phase
Implement
Phase
Evaluate
Phase Identify
Phase
Identify
Phase
Analyze
Phase
Analyze
Phase
Plan
Phase
Plan
Phase
Implement
Phase
Implement
Phase
Evaluate
Phase
Evaluate
Phase
Problem
Description
Problem
Definition
Locate
Point of Cause
(Root Cause)
Cause
Investigation
Short &
Long-term
Countermeasure
Follow-Up &
Check
2
1
3
4
5
6
Plan
Do
Check
Act
S
e
l
e
c
t
C
o
n
t
a
i
n
P
r
e
v
e
n
t
C
o
r
r
e
c
t
Problem
Description
Problem
Definition
Locate
Point of Cause
(Root Cause)
Cause
Investigation
Short &
Long-term
Countermeasure
Follow-Up &
Check
2
1
3
4
5
6
Plan
Do
Check
Act
S
e
l
e
c
t
C
o
n
t
a
i
n
P
r
e
v
e
n
t
C
o
r
r
e
c
t
Problem
Description
Problem
Definition
Locate
Point of Cause
(Root Cause)
Cause
Investigation
Short &
Long-term
Countermeasure
Follow-Up &
Check
2
1
3
4
5
6
Plan
Do
Check
Act
Plan
Do
Check
Act
S
e
l
e
c
t
C
o
n
t
a
i
n
P
r
e
v
e
n
t
C
o
r
r
e
c
t
S
e
l
e
c
t
C
o
n
t
a
i
n
P
r
e
v
e
n
t
C
o
r
r
e
c
t
Institutionalize New Opportunity
Page 3 of 6 Revision Date: 02/21/05
Problem Solving
PLAN
DO
CHECK
ACT
Collect Data
Understand
Process
Relentless
Root Cause
Mistake
Proof
Page 6 of 6 Revision Date: 02/21/05
Owner: TBD
Subject: Error Proofing/ Poka-Yoke
Definition: The principle that defects are prevented by controlling the performance of a process
so it cannot produce defects – even when a mistake is made by a machine or a person.
Purpose: To provide error free processing to our customers.
Workers have been trained
in the basics of error-proofing
and there is a team responsible
for analyzing production defects
and identifying error proofing
opportunities.
Error Proofing workshops are periodically conducted to train
selected workers in error proofing. Cross functional team exists
and is supported by management to work on applying error proofing
to the workplace.
Error-proofing devices and
methods have been applied to
both manual operations and
automated process.
Error-proofing devices and
methods have been implemented
or are being developed to
eliminate the top production
defects for each work area
in the plant.
1
4
2
3
No. Standard Requirements
Document
Training
Audit
Page 1 of 2 Revision Date: 02/21/05
Error-proofing devices that
have been installed are
monitored for effectiveness,
and are maintained and kept in
sound working condition.
Manual processes have been improved using check fixtures,
locating devices, Poka- Yoke, etc. Automated machines are
equipped with self-inspecting technology.
Priority has been given to top production defects for error proofing
efforts. There is a checklist of existing error proofing devices and it has
reference to future devices to be developed.
Periodic effectiveness monitoring system exists and is kept current.
Proofing
• Level 1: Prevent an error from occurring
at the source
• Level 2: Detect error as it is being made
• Level 3: Prevent the defect from reaching
the next operation
Types of Mistake- Proof Devices
• Guide/reference/interference rod or pin*
• Alarm*
• Limit switch/microswitch*
• Counter*
• Checklist*
• Template
• Odd-part-out method
• Sequence restriction
• Standardize and solve
• Critical condition indicator
• Stopper/gate
• Sensor
Definition of Changeover
By set-up we mean the length of time from the last good
piece of one run to the first good piece of the next run.
last good part next good part
Time between parts is emphasized because it is a
period of non-value added. In other words, the
equipment is idle and not producing parts.
What Is Changeover Reduction ?
•A systematic approach to reducing the
time required to changeover a given piece
of equipment
•An operational tool which:
•increases the overall effectiveness of
equipment(OEE)
•reduces waste
Page 1 of 10 Revision Date: 02/21/05
No. Standard Requirements
Document
Training
Audit
Leadership understands, supports and
reviews TPM activities.
Leaders promote TPM behaviors and have developed goals
and objectives that reinforces continuous improvement of the
process. Leaders drive accountability and discipline of the TPM
process and conduct periodic performance reviews.
Tracking system is in place to monitor TPM
performance based on defined metrics.
Measurables and trends are tracked, displayed and communicat-
ed including (but not limited to) Overall Equipment Effectiveness
(OEE), uptime, availability, breakdowns, percent scheduled PM
inspections and PM tasks completed.
TPM process is well defined, written,
communicated and performed properly.
Documented TPM process and procedures are properly
performed operators and Skilled Trades employees in a timely
manner. TPM process defines the plan, purpose, objects, tasks,
records, reporting, inspection frequencies, PM schedules, roles,
responsibilities and visual management system.
All employees are fully trained TPM process,
practices, roles, responsibilities, safety and
ergonomic requirements.
Employees are provided detailed and comprehensive training
and instructions in proper maintenance, safety and ergonomics
practices with special emphasis on lock-out procedures (if
applicable).
Owner: TBD
System: Total Productive Maintenance (TPM)
Definition: Standardized Work of maintenance activities for machines, tools, facilities and equipment.
Purpose: Maximize equipment and machinery operating life, reduce variation improve performance, uptime, availability,
quality, efficiency and reduce breakdowns.
1.
2.
3.
4.
Machine Operator Checklist (cont.)
Daily Total Preventive Maintenance Check Sheet
Month/ Year/
______ ______
Process/
Cell
Name:
Process/
Cell
Number:
1. If the condition of the check item is normal, mark (0) in proper box.
2. If the condition of the check item is not to standard, mark (x) in proper box.
PICTURE
NO. DAILY CHECK STANDARD
1
2
3
4
5
6
7
Check each tool
board in work cell
daily by shift
All tools must be
present and accounted
for daily by shift
Prod. Mgr.:
Plant Eng.:
Prod. Supvr.:
Maint. Tech.:
M
I
S
C
1 2 3 4 5 6 7 8 9 10 11 12 13 14 15 16 17 18 19 20 21 22 23 24 25 26 27 28 29
1
2
3
1
1
1
1
1
1
2
2
3
3
3
2
2
2
2
3
3
3
sign
sign
sign
sign
Page 10 of 10 Revision Date: 02/21/05
Sight Gage Visual Aid
Green: Normal
Operating Range
Yellow:
Caution
Red: Requires
Immediate
Attention
Visual Indicator
Direction of Rotation
Inspection & Adjustment Opening
(without need to lock-out)
Page 7 of 10 Revision Date: 02/21/05
Page 1 of 4 Revision Date: 02/21/05
No. Standard Requirements
Document
Training
Audit
1.
Parts are ordered based on actual
consumption.
Manual or electronic Kanban system is used to order and
replenish consumed material each day. Plant does not order
more parts than are needed and supplier does not over or under
ship.
Material is received when needed at a
specified time and receiving.
Truck deliveries arrive at a predetermined scheduled time and
dock. Arrivals are leveled during each shift to evenly distribute
and balance receiving dock workloads and minimize inventory
levels. Receiving is within plus or minus 15 minutes of the
designated time. Trucks are live unloaded in a timely manner.
Receiving areas are visually managed. Receiving locations are clearly labeled on the inside and outside
of the docks. Receiving display boards are strategically
positioned at or near the docks to monitor performance. Display
boards include receiving dock numbers, carrier names by dock
location, scheduled arrival time (in), actual arrival time,
scheduled departure time (out), actual departure time, late/
on-time performance status. Receiving docks are organized
and with visual indicators for drop zones, staging area lanes
and empty returnable container locations.
2.
3.
Owner: TBD
System: External Material Pull & Conveyance
Definition: Material replenishment system between suppliers and the plant based on actual consumption.
Purpose: To order, deliver and receive material on a just-in-time basis to minimize inventory and freight costs by optimizing
transportation, logistics and containerization.
Owner: TBD
System: Lean Containers and Packaging
Definition: Containers designed to be operator friendly, ergonomically correct and economically sized to optimize transportation
while minimizing space utilization at all manufacturing workstations.
Purpose: To reduce non-value added work of Direct Labor Operators.
No. Standard Requirements
Document
Training
Audit
Page 1 of 10 Revision Date: 02/21/05
Process is in place to determine the most appropriate container
dimensions, weight and standard pack quantity.
Container sizes are reduced to the smallest economic quantity
to minimize workstation layout space.
PFEP profile is completed for all components by a Material
Packaging Engineer.
First priority for all packaging decisions is to assure that the
all containers are operator friendly and minimize non-value
added handling and waste of motion.
Small hand delivered durable plastic returnable containers:
• are the packaging of choice to eliminate disposable materials.
• are ergonomically sized to assure that the containers and
parts do not exceed the NIOSH ergonomic lifting weight
guidelines.
• have rigid walls and are stackable (nest together).
• designed with lift straps or side slots to facilitate lifting and
handling.
• have an integrated clip to hold Kanban cards.
• selected from a standard menu of approved configurations.
Plan For Every Part (PFEP) profile is created
for all components for new model programs
(Material Packaging Engineers).
1.
4527864 9973421
5673021 9856482
Small Lot Delivery to Workstation.
Returnable container with
lift handles or slots weighing
less than 38 lbs. each.
Maximize Trailer Liquid Cube Utilization
“A” Line
“B” Line
“C” Line
Quality Verification
Tracking Board
Quality
Verification
Station
FGI
Quality System Verification
Continuous Improvement Process
Identify
Phase
Analyze
Phase
Plan
Phase
Implement
Phase
Evaluate
Phase
Standardize
Cross Functional Teams
Current Workstation Situation
New Opportunity
Plan for Every Operation & Part
Current Line Balance
Improved Line Balance
Improved Workstation Situation
4981654
Reorder
at 5
pcs.
4981654
4981654
Reorder
at 5
pcs.
Reorder
at 5
pcs.
4981654
0 0%
0 0
0 0
BP TOTAL
PRIOR 0 0 0 0 0
Op. Std.
Ref. #
P/F/G/N
Does Not
Meet Std.
Partially
Meets Std.
Fully Meets
Std.
Not
Applicable
Best
Practices
Poor Fair Good N/A B/P
1
2 & 16
2
2
3, 4 & 9
4
5
5
6
7
8
10
8 & 12
5 & 12
13
6 & 14
14
14
14
14
14
14
15
16
17 Operator(s) workloadsare balanced to minimize non-value added functions?
Distrance traveled to walk and get parts is minimized with the use of aprons, tracking devices, carts,
trays andstands.
Operators begin theirwork cycle at the "start mark" and end at or nearthe "finish mark"?
Operator makes no more than 2 trips during each job cycle to the workbench or material to get tools or
parts.
Parts, tools and fixtures are located/positioned for ease of access?
Indirect Labor work functions that are performed on a regular and frequent basis are performed
according written Standardized Work?
Standardized Work document is current and includesaccurate validated information?
Operators do not perform ergonomically stressful functions (i.e. excessive tugging, prying, pulling
apart, stretching, effort, bending, reaching)?
Operators do not perform difficult blind attachements or movements?
Operators do not perform awkward movements that require body repositioning or extra effort?
Operators understand and follow the Standardized Work instructions?
All operators (including new hires and temporaries) have been trained using Standardized Work?
Standardized Work
System Description/Element Questions
Percentage Ranking
Team/operators were involved in developing the Standardized Work?
Total Points Earned
Total Points Possible
Build document, manifest orinstructions are clearlyvisible and easy to understand?
Handling of dunnage/containers is minimized to 1 every 4 cycles?
Audit Date:
TOTAL POINTS
Auditor Name:
Total Elements for Department
Elements Not Applicable
Total Elements Audited
Operator decsions are minimized to between 1 -3 per job cycle?
Operators do not perform complicated movements requiring adegree high dexterity?
All non-value added and unecessary movements and efforts are minimized?
Operator work envelop size is minimized to reduce walking distance (i.e. heigth, depth and width)?
Operators cycle equipment and perform other value added work while machinescomplete theircycle?
Operators do not perform movements that require change of control or double handling of tools and
parts?
Operator delays are minimized (i.e. holding, waiting, fumbling, loss of control)?
Operator movements are not restricted orobstructed causing deviation from the most direct path?
Standardized Work instructions are posted, protected, clearly visible and updated?
Opportunities to combine, simplify and eliminate work elements has been achieved?
Team Leader
Industrial Engineer
Supervisor
Material Control
Maintenance
Assessment
1
2
3
4
5
16 Feet Wide
Before
 Kanban Pull System
 Electronic Pull System
 Andon & Fixed Position Stop
 Sequenced Components
 Small Lot Containers
 Compressed Work Space
 Storage Height Limited
 Visual Management Capability
 Ergonomic Friendly
 Improved Part Presentation
 Reduced NVA Waste
 Improved Flow
8 Feet Wide
4981654
Reorder
at 5 pcs.
6873091
5 Feet High
1739754 1563761
After
Fixed
Electronic Kanban
Operator pushes the button
when reaches the designated
reorder point.
Handler returns empty rack or pallet
and places the Kanban card back in
the Andon board slot and turns-off
light.
6
Part Number
4981654
Storage Location
Aisle 3 Rack 4 Shelf 2 Spot 1
Using Address
Part Description
Passenger Seat Back Frame
Supplier Name
Morristown
Rec. Dock
4
Del. Route
3
Std. Pack
42 pcs.
Daily Usage
336 pcs.
Card
1 of 2
Date Issued
1/9/03
CTS-003-R
1
2
3
4
5
6
7
8
9
10
11
12
13
14
15
16
17
18
19
20
21
22
Flashing Light
indicates order
waiting for a
response.
Card slot and blinking
light corresponding to
material ordered.
Andon board is
activated.
2
Handler takes card from board
and presses button to confirm
delivery to the operator.
Order
Sequence
Queue
Handler delivers new
material to line-side and
takes empty to storage
area.
5
Handler gets ordered parts
from Central Material
Storage.
4
1
3
9
9
5
1
6
7
5
Full
Orders prioritized by
time of receipt and
usage rate.
9
9
5
1
6
7
5
Part: Adjuster
Part No: 9951675
Std. Pack: 90
Min: 1 Max: 3
Stack: 3 High
9951675
Empty
9
9
5
1
6
7
5
Page 7 of 7
Revision Date: 02/21/05
Stretch Objectives:
 1 Day Dock-to-Dock Time
 15 Day Order-to-Delivery Time
Collection Frequency: Daily
DTD = (Raw Material Inventory + Manufacturing Cycle Time + Finished Goods Inventory)
where:
 Manufacturing Cycle Time (MCT) = the elapsed time between the first and last
operation of a process.
 Raw Material and finished goods inventories = the number of production days on hand
= (number of pieces in inventory/average daily production volume)
Lean Manufacturing Metrics:
Dock-to-Dock Time is the elapsed time between
unloading raw materials and releasing finished goods
for shipment.
Dock-to-Dock Time (DTD)
• Definition: The elapsed time between the unloading of raw materials
and the release of finished goods for shipment.
• Objective: Less than or equal to 2 days DTD.
• Benefits of Improved DTD Include:
– Decreased inventories lead to less material handling and storage, resulting
in fewer opportunities to damage parts. Fewer damaged parts improves
First Time Through.
– Improved DTD leads to improved ability to adjust to schedule changes and
support the Customer.
– Lower material handling, obsolescence, and inventory carrying costs all
lead to improved Total Cost.
Dock-to-Dock Time (DTD)
Production Process
Incoming
Warehouse
Finished Goods
Warehouse
Manufacturing Cycle Time
(MCT)
Dock-to-Dock Time (DTD)
Receiving Shipping
Overall Equipment Effectiveness (OEE)
Stretch Objectives:
 Zero Defects Made
 Zero Defects Passed on
 100% First-Time-Through Capability
Collection Frequency: Daily
OEE = (Availability) x (Performance Efficiency) x (Quality Rate)
where:
OEE (similar to Uptime) is a measure of the availability,
performance efficiency, and quality rate for a given
product on a given piece of equipment.
Availability =
Operating Time

Net Available Time
Performance Efficiency =
(Ideal Cycle Time) (Total Parts Run)

Operating Time
Quality Rate =
(Total Parts Run - Total Defects)

Total Parts Run
Overall Equipment Effectiveness (OEE)
• Definition: A measure of the availability, performance
efficiency, and quality rate of a given piece of equipment.
• Objective: To improve the OEE on the constraint piece of
equipment.
• Benefits of Improved OEE Include:
– More stable processes improve production predictability,
therefore improving Build-to-Schedule
– Lower rework and scrap costs, and higher throughput, lead to
improved Total Cost results
Overall Equipment Effectiveness (OEE)
Overall
Equipment
Effectiveness
Availability
Performance
Efficiency
Quality
= X X
Identifiable Minor
Stoppages
Equipment Breakdowns
and Tooling Losses
Setup and Adjustment
Losses
Reduced Speed Losses
Idling and Minor
Stoppage Losses
Quality Defects in
Process Losses
Startup Losses
Stretch Objectives:
 1 Day Dock-to-Dock Time
 15 Day Order-to-Delivery Time
Collection Frequency: Daily
FTT =
First Time Through Capability (FTT)
The percentage of units that complete a production
process and meet quality guidelines the first time. (i.e.
not rerun, re-tested, diverted for off-line repair,
returned or scrapped)
Units Entering the Process - (Scrap + Reruns + Restarts + Units Repaired Off-Line)

Units Entering the Process
First Time Through Capabilities (FTT)
• Definition: The percentage of units that complete a process and meet quality guidelines
the first time without being scrapped, rerun, re-tested, diverted for off-line repair, or
returned.
• Objective: 100% FTT Capability; zero defects made or passed on.
• Benefits of Improved FTT Include:
– Increased quality reduces the need for excess inventory thereby improving Dock-to-Dock Time
– Improves the ability to maintain sequence throughout the process thereby improving Build-to-
Schedule
– Increased quality before the constraint ensures that it only receives “good parts”, which reduces
wasted output at the constraint, improving OEE
– Total Cost is reduced through lower warranty, scrap, rework, and repair costs
• If Things Were Done Correctly 99.9% of the Time…
– There would be 2 unsafe plane landings at O’Hare Airport every day.
– 20,000 drug prescriptions would be improperly filled each week.
– 32,000 checks would be deducted from the wrong bank account each hour.
Build-to-Schedule (BTS)
Stretch Objectives:
 100% Built-to-Schedule
Collection Frequency: Daily
BTS = (Volume Performance) x (Mix Performance) x (Sequence Performance)
where:
Build-to-Schedule measures how well a plant executes production plans to produce
the right product volumes, on the right day, and in the right mix or sequence.
Volume Performance =
Actual Number of Units Produced

Scheduled Number of Units
Mix Performance =
Actual Number of Units Built to Mix

Actual Number of Units Produced
Sequence Performance =
Actual Number of Units Built to Sequence

Actual Number of Units Built to Mix
Build-to-Schedule (BTS)
• Definition: The percentage of units scheduled for a given day
that are produced on the correct day, in the correct mix, and in
the correct sequence.
• Objective: 100% BTS.
• Benefits of Improved BTS Include:
– Improved BTS requires less inventory and Dock-to-Dock Time is
improved
– Lower material handling and inventory carrying costs lead to
improved Total Cost
A short test…
A short test…
You own a factory and you need to produce more
product - how?
 Work longer
 Work harder
 Add people
 Add equipment
 Eliminate waste
Eliminate waste
Quality
Quality
Quality
Quality
Quality
Quality
?
?
Cost
Cost
Cost
Cost
Cost
Cost
The Lean Way
The
End
Leanville
or bust!
The
Beginning

introduction dans les prarique de Lean.ppt

  • 1.
  • 2.
    • What isLean Manufacturing ? • What are the objectives of Lean Manufacturing ? • The Components of Lean Manufacturing • Lean Manufacturing Metrics • Conclusion Lean Manufacturing?
  • 3.
    PRODUCT PRODUCT SHIPMENT SHIPMENT CUSTOMER CUSTOMER ORDER ORDER Time Business as Usual LeanManufacturing PRODUCT PRODUCT SHIPMENT SHIPMENT CUSTOMER CUSTOMER ORDER ORDER Time (Shorter) Waste Waste Lean Manufacturing
  • 4.
    Global Market - ChangingConditions - Fierce Competition • Customers Expect: - Short Lead Times - 100% Quality - Just-In-Time Delivery - Annual Cost Reductions - Strategic Collaboration & Partnership - Innovative solutions - Flawless Performance - Superior Service and Support • Improved Employee Skills Required - Multi- Skilled - Flexible Why Lean? Lean Manufacturing
  • 5.
  • 6.
    Sales Price Traditional Approach Cost +Profit = Price Cost Plus Mfg. Cost Profit Mfg. Cost Mfg. Cost Profit Profit Lean Approach Price - Cost = Profit Price Minus Mfg. Cost Profit Mfg. Cost Mfg. Cost Profit Profit Sales
  • 7.
    Grow The Business AchieveOur Vision Why? Satisfy Customers, Employees & Stockholders Why? • Safety • Quality • Responsiveness • Costs Why Lean? Achieve Business Objectives Why? Lean Strategies Why? Eliminate Waste Why? Why Lean?
  • 8.
     Do morewith less… • Inventory • Time • Money • Problems • Resources  More effective asset utilization… • Engaged workforce • Improved Efficiency • Improved equipment uptime & availability • Efficient facility layout • Economic use of floor space • Improved First Time Through Quality • Problem avoidance & containment  Improved flow… • Process • Material • Information • People • Cash  Lower operating costs… • Less non-schedule overtime • Less downtime Why Lean? The Lean Way
  • 9.
    It is anintegrated system of mutually dependent strategies that when combined together maximize operating performance by elimination of wasteful manufacturing practices. Not a program! Not a project! Not an event! What is Lean Manufacturing? What is Lean Manufacturing? Lean Manufacturing Overview
  • 10.
    Lean Manufacturing is….. •A philosophy of eliminating non-value added activities (i.e. waste) • A culture of continuous improvement • A way of thinking and taking a systems approach to training and implementation • An approach of empowering people
  • 11.
    Lean Manufacturing ….. •FOCUSES ON TIME, (TIME =$$$) • Reduces all non-value added activities: • Shortens process time • Gets products to customer quicker • Improves productivity • Improves quality • Lowers cost and • Increases customer satisfaction
  • 12.
    • VALUE ADDED: Anactivity that transforms or shapes raw materials or information to meet customer needs • WASTE: Activities that consume time, resources and space, but do not contribute to satisfying customer needs VALUE VALUE and and WASTE WASTE The Waste
  • 13.
    Value Value vs. vs. Waste Waste WASTE Examples: -Walking to get parts - Waiting time Examples: - Crimp terminals - Connect circuits Examples: - Rework - Inspection Value Added The Waste
  • 14.
    The 7 categoriesof Waste The 7 categories of Waste • Over-production • Inventory • Transportation • Waiting • Motion • Over-processing • Correction (failures) The Waste
  • 15.
    1. Waste ofOver Production: Producing over customer requirements, producing unnecessary materials / products, or producing too soon. 2. Waste of Inventory: Producing unnecessary inventory, holding or purchasing unnecessary inventory, WIP 3. Waste in Transportation: Multiple handling, delay in material handling, unnecessary handling or transportation (non value added conveyance) 4. Waiting (Time): Time delays, idle time (non value added time) 5. Waste of Motion: Waste of motions, excessive handling, unnecessary steps of motion (non value added motions). 6. Waste in Processing: Unnecessary processing, steps or work elements/ procedures (non value added work). 7. Waste of Producing Failures: Correction of errors or rework, scrap (quality problems) The 7 categories of Waste The 7 categories of Waste The Waste
  • 16.
    Causes of Waste Causesof Waste • Layout (Distance) • Long setup time • Incapable processes • Poor maintenance • Poor work methods • Inadequate training • Product design • Ineffective production planning & scheduling • Equipment design and selection • Poor workplace organization The Waste
  • 17.
    The waste ofINVENTORY... The waste of INVENTORY... The Waste
  • 18.
    Elements of LEAN philosophy Create a “fear-free” environment Neverstop improving Create a shared vision Make decisions at the value-add level Waste & Problems are opportunities Customer First The elements work together... Lean Elements
  • 19.
    Process creates Results •People work to improve processes • Improved processes improve results • Improved results  satisfied customers Customer First
  • 20.
    Fear Free: • Whatis wrong • Develop solution • Issues emerge • Whole truth • Problems are good • Consistent level work • Thank the messenger • Process is the problem Fearful: • Who is wrong • Critical judgment • Issues remain hidden • Partial truth • Problems are bad • Fire fighting • Shoot the messenger • People are the problem Create a FEAR-FREE Environment
  • 21.
    Identification is theFirst Step Lean is based on identifying and eliminating waste • Not all waste can be eliminated immediately • Identification of waste makes the opportunity for improvement visible • Process creates results. Use results to define areas for improvement Waste & Problems are Opportunities
  • 22.
     Develop systemsto encourage change to occur where the value is added • Don’t develop a suggestion system • Do develop an implementation system  A plan for improvement is worth nothing until it is implemented  Implement ideas, this is the true measure of Lean Manufacturing success  Standardize, Improve... then Innovate • Lean comes before innovation • Normally no cost or low cost Make Decisions at the Value-Add Level
  • 23.
     Lean involveseveryone in the organization  Lean crosses all organizational boundaries and should be a key component of the organizational strategy  Departments should strive to understand and support the total organization, not individual department goals  LEAN is an umbrella... Create a Shared Vision
  • 24.
    • 6 Sigma •Error Proofing • Total Productive Maintenance (TPM) • Material control • TAKT Time • Standardised work • Quick Changeovers • Just in Time (JIT) • Small Group Activities • Workshop Organisation • Visual Management Lean Manufacturing Umbrella
  • 25.
    Develop A Vision EstablishStructure For Change Provide Lean Expertise Define Standards Develop Champions Train Entire Organization Develop Action Plans Develop A Showcase Inform ation Understanding Com m itm ent Action Seize Opportunities
  • 26.
    What are the“objectives” of Lean Manufacturing? Achievement of business goals in safety, quality, responsiveness, cost and delivery by: • making only what is needed • providing only when needed • involving employees • focusing on continuous improvement • exposing & solving problems rapidly • making the status obvious • eliminating constraints and bottlenecks • improving factory flow
  • 27.
  • 28.
    ● People arecomfortable with extra inventory, WIP, manpower and excess capacity because it covers-up sins. ● People will adamantly defend excesses and what they created. ● Resistance to change is inevitable. ● Lean takes people out of their comfort zone because it exposes things. ● Be prepared (plan) for redeployment of displaced people. ● People issues will arise. ● Some folks view the word “Lean” as “Mean”. ● If we were capable and willing to make productivity gains… we would have done it already (I.E. talent depth? Training? Politics?) ● Linking headcount reduction directly with Lean Systems implementation could spell problems. ● There will be some short term pain for long term gain. Beware!
  • 29.
    Lean Manufacturing isa system... Lean Manufacturing is a system... The Components of Lean Manufacturing These elements work together and reinforce each other, driving These elements work together and reinforce each other, driving the system to higher and higher levels of performance. the system to higher and higher levels of performance.
  • 30.
    Standardized Work:  StandardizedWork is a tool that defines the interaction of operator and machine in producing a part.  Standardized Work details the motion of the operator and the machine processing sequence.
  • 31.
    Benefits of StandardizedWork • Reduce variations in the process • Reduce the opportunities for error • Describe the best method at the present time • Clearly illustrate the relationship between TAKT time and Cycle time.
  • 32.
    Standardized Work Combination Work Sheet WorkCell / Department: Product Name / Number: TAKT Time: Operator: Operation Time (In Seconds) MASTER CYLINDER MACHINING MASTER CYLINDER 40 Seconds MANUAL ----------, AUTOMATIC - - - - - - , WALKING L E G E N D JOHN SMITH 1 2 3 4 5 6 7 2" 2" 2" 2" 2" 2" 2" 2" 4" 5" 4" 3" 6" 2" 28" 29" 27" 12" 14" 26" 5 10 15 20 25 30 35 40 45 50 55 Quality Check Safety Precautions Standard WIP # of pieces of Std. WIP TAKT Time Net Time Operator Number Process Name: Model Number: Model Name: Date Prepared: Dept. Head / Supervisor STANDARD WORK SHEET Scope of Operations From To Push palm buttons Add velcro and pass Cycle Machine ABC 1/30/96 Joe Machine Fixture Fixture 1 2 3 4 Grinder 2 62 1
  • 33.
    A value streamis all the actions (both value-added and non value-added) currently required to bring a product through the main essential flows: 1. The product flow from raw material to the customer 2. The design flow from concept to launch What is Value Stream Mapping?
  • 34.
    Value stream mappingis a pencil and paper tool that helps you to see and understand the flow of material and information as a product makes its way through the value stream Scrap Manufacturing Process Kaizen Lightning Burst Outside Source/ Customer Data Box Inventory I o o o Truck Shipment Finished Goods to Customer Push Arrow Supermarket Buffer or Safety Stock Manual Information Flow Electronic Information Flow Production Kanban Withdrawal Kanban Signal Kanban Kanban Post Michigan Steel CO. 500 ft coils STAMPIN G 200 T C/T = 1 second C/O = 1 hour Uptime = 85% 27,000 sec. avail. EPE = 2 weeks I C/T = 38 seconds C/O = 10 minutes Uptime = 85% 27,000 sec. avail. EPE = 2 weeks I S. WELD # 1 I S. WELD # 2 I I I Coils 5 days 4600 L 2400 R 1100 L 600 R 1600 L 850 R 1200 L 640 R 2700 L 1440 R ASSEMBLY #1 C/T = 45 seconds C/O = 10 minutes Uptime = 100% 2 Shifts 27,000 sec. avail. ASSEMBLY # 2 C/T = 61 seconds C/O = 0 2 Shifts Uptime= 100% 27,000 sec. avail. SHIPPING Staging C/T = 39 seconds C/O = 0 Uptime = 100% 2 Shifts 27,000 sec. avail. 18,400 p cs/mo -1 2,400 “L” - 6 ,400 “R ” Tray = 20 pieces 2 Shifts State Stre et Assemb ly Tues. & Thurs. 1X Daily 6 - week Forecast Weekly Fax PRODUCTIO CONTROL MRP 90/60/30 day Forecasts Daily Order Weekly Schedule Daily Ship Schedule 5 days 1 second 7.6 days 38 seconds 1.8 days 45 seconds 2.6 days 61 seconds 2 days 39 seconds 4 .5 daysProduction Lead Time= 23.5 days Value Added Time= 184 sec. Mapping the Current State What is Value Stream Mapping?
  • 35.
    Value Stream Analysisis a powerful, flexible, visual tool, which enables everybody to interpret the steps of a process, and highlight the lead time and the waste it contains. The map if kept dynamic, will help to prioritize the continuous Improvement (Kaizen) & Six Sigma activities and develop the action plans for implementing lean strategically into an organization. Why use Value Stream Mapping?
  • 36.
    • It helpsyou visualize more that just a single process • Provides a visual model of material and information flow • Helps identify various sources of waste • Provides a common language for talking about manufacturing processes • Makes decisions about the flow apparent •Demonstrates the linkage between information and material flow Objectives of Value Stream Mapping
  • 37.
    Customer Demand/month: Part A = PartB = Part C = # of shifts = Step 4: Map the Process Flow Inventory Part A = Part B = Part C = # of shifts = Shipping Assembly Welding Stamping Takt = C.T. = D.T. = FTQ = 90% C/O Time = Lot Size = # of Shifts WIP = Takt = C.T. = D.T. = 20% FTQ = C/O Time = Lot Size = # of Shifts WIP = Takt = C.T. = D.T. = FTQ = C/O Time = 4 hrs. Lot Size = # of Shifts WIP = Changeover Downtime FTQ Map Current State
  • 38.
    Customer Demand/month: Part A = PartB = Part C = # of shifts = Step 5: Map the Material Flow Inventory Part A = Part B = Part C = # of shifts = Shipping Assembly Welding Stamping Takt = C.T. = D.T. = FTQ = 90% C/O Time = Lot Size = # of Shifts WIP = Takt = C.T. = D.T. = 20% FTQ = C/O Time = Lot Size = # of Shifts WIP = Takt = C.T. = D.T. = FTQ = C/O Time = 4 hrs. Lot Size = # of Shifts WIP = Changeover Downtime FTQ I I I I 500 pcs 1,200 pcs 1,500 pcs 800 pcs Map Current State
  • 39.
    Customer Demand/month: Part A =705 pcs. Part B = 600 pcs. Part C = 1650 pcs. # of shifts = Inventory Part A = 750 pcs Part B = 600 pcs Part C = 1650 pcs # of shifts = Shipping Assembly Welding Stamping Takt = C.T. = D.T. = FTQ = 90% C/O Time = Lot Size = # of Shifts WIP = 550 pcs. Takt = C.T. = D.T. = 20% FTQ = C/O Time = Lot Size = # of Shifts WIP = 60 pcs. Takt = C.T. = D.T. = FTQ = C/O Time = 4 hrs. Lot Size = # of Shifts WIP = 25 pcs. Changeover Downtime FTQ I I I I 2 x/ day 2 x/ week Supplier 1,200 pcs 1,500 pcs 800 pcs 500 pcs PC & L Weekly Build Schedule Daily Ship Schedule 6 week rolling forecast 6 week rolling forecast Weekly Order Weekly Order Step 6: Map the Information Flow Map Current State
  • 40.
    Map the CurrentState  Select a Product Family  Form a Team  Understand Customer Demand  Map the Process Flow  Map the Material Flow  Map the Information Flow  Calculate Total Product Cycle Time  Detail Off-Line Activities The Process Design the Future State  Validate Customer Demand  Draw the Future State Process Flow  Map the Future State Material Flow  Map the Future State Information Flow  Calculate Total Product Cycle Time  Detail Off-Line Activities  Outline a Plan Tues. & Fri. PC & L Weekly Order MRP MSS Weekly Order # times/day Steel Supplier Steel Pin # pcs # days or shifts I I I I Stamping Downtime Changeover Time=4 hr 2 Shifts TAKT = 2 Presses Cycle Time = Change Over Welding Layout Scrap/Rework Downtime = 20% Uptime # Operators Cycle Time = Weekly Build Schedule Daily Ship Schedule 6 Week Rolling Forecast 6 Week Rolling Forecast Finished Goods Overtime = # Shifts = Assembly DT, Scrap Rework WIP = Cycle Time = TAKT = Changeover Time = Layout = 10% Scrap ? days ? days ? days ? days ? days ? days ? days Inventory Time Processing Time TPc/t = ? TAKT = WIP = WIP = WIP = X pcs/month Std. Pack Qty. # shifts Customer Finished Goods Assembly Layout Welding Rolling 6-wk Forecast Weekly Order 6 x / Day PC & L 6-wk forecast Daily Level Box DA1 DA2 DA3 C/O Time = CT = TAKT Time 3 Shifts DT = Scrap = Stamping 0 Overtime 2 Shifts Max Size # Material Handlers C/O Time = CT = TAKT Time 3 Shifts DT = Scrap / Rework = C/O Time = CT = TAKT Time 3 Shifts DT = Scrap / Rework= Small Lot # Operators Customer X pcs / month Std Pack Qty # Shifts WIP = WIP = WIP = Steel Supplier Inv.Time Proc .Time TPc/t = ? ? days ? days ? days ? days ? days ? days ? days Introduction to Value Stream Mapping
  • 41.
    Be Wise… Observe…it isnecessary to physically observe the value stream. This provides the greatest opportunity to identify and eliminate waste. Be Persistent... Value stream mapping is an iterative process. Todays future state is tomorrows current state. This is what continuous improvement is all about. Getting Started Summary
  • 42.
    Safety and emergencyequipment are located and organized to assure easy access and use. Fire alarms, hoses, extinguishers, emergency exits, emergency line stops and evacuation procedures are strategically placed, readily accessible and easy to locate (not obstructed). 6 7 8 Effective employee training and awareness is provided. Workplace Organization (Five ‘S’) training classes and awareness communications are used on a continuous basis to educate the entire workforce and to reinforce compliance to the plant Five ‘S’ guidelines. Material inventory is stored and arranged in an organized and safe manner. All material containers (full and empty) are stored in a designated location. Safe storage stacking heights are maintained and adequate clearance is provided at aisle intersections to enable a clear view in all directions. No. Standard Requirements Document Training Audit Page 2 of 8 Revision Date: 02/21/05 Owner: TBD Subject: Workplace Organization (Five ‘S) Definition: A safe, clean, neat and orderly arrangement of the workplace. Purpose: To provide a place for everything and assure that everything is in the correct location by providing the ability to see the status at a glance and distinguish between standard or out-of-standard conditions. Five “S” Workplace Organization training is provided and improvement activities are in place. Five “S” Kaizen events are periodically conducted to train the entire workforce in Workplace Organization principles. A “Red Tag” process Is in place and events are conducted to identify Excess and obsolete tools, equipment and material are tagged and segregated for disposition. 9
  • 43.
    Owner: TBD System: PracticalProblem Solving Process Definition: Simple analytical methodology for analyzing and resolving out of standard conditions. Purpose: To fully engage employees in finding solutions to recurring issues and implementation of permanent countermeasures. Page 1 of 6 Revision Date: 02/21/05 No. Standard Requirements Document Training Audit Problems are effectively resolved at the appropriate level with permanent countermeasures implemented before being elevated to higher level or more technical analytical tools. Communication process is in place to transfer information from problem solving activities. On-going Practical Problem Solving training is provided to all employees. Practical Problem Solving is used first as a means of resolving issues before higher level tools are applied. Practical Problem Solving (PPS) process is in place and employees are actively engage in on-going activities. Structured approach and standardized methodology is used in a common manner throughout the entire organization. Teams meet and use the PPS to solve problems. Bulletin boards, publications, website, team meetings and structured PPS progress reviews are used to explain results and showcase improvement ideas. Continuous PPS training is provided to all employees. Training schedules are posted and classes conducted. Adequate resources and time is allocated to conduct training. Top Leadership is actively involved in mentoring and conducting regular progress reviews. Job responsibilities and incentives are in place to assure that top Leaders mentor, coach and educate and employees. Leaders are expected to mentor direct reports. 1. 2. 3. 4. 5.
  • 44.
    Practical Problem SolvingModel Identify Phase Analyze Phase Plan Phase Implement Phase Evaluate Phase Identify Phase Identify Phase Analyze Phase Analyze Phase Plan Phase Plan Phase Implement Phase Implement Phase Evaluate Phase Evaluate Phase Problem Description Problem Definition Locate Point of Cause (Root Cause) Cause Investigation Short & Long-term Countermeasure Follow-Up & Check 2 1 3 4 5 6 Plan Do Check Act S e l e c t C o n t a i n P r e v e n t C o r r e c t Problem Description Problem Definition Locate Point of Cause (Root Cause) Cause Investigation Short & Long-term Countermeasure Follow-Up & Check 2 1 3 4 5 6 Plan Do Check Act S e l e c t C o n t a i n P r e v e n t C o r r e c t Problem Description Problem Definition Locate Point of Cause (Root Cause) Cause Investigation Short & Long-term Countermeasure Follow-Up & Check 2 1 3 4 5 6 Plan Do Check Act Plan Do Check Act S e l e c t C o n t a i n P r e v e n t C o r r e c t S e l e c t C o n t a i n P r e v e n t C o r r e c t Institutionalize New Opportunity Page 3 of 6 Revision Date: 02/21/05
  • 45.
    Problem Solving PLAN DO CHECK ACT Collect Data Understand Process Relentless RootCause Mistake Proof Page 6 of 6 Revision Date: 02/21/05
  • 46.
    Owner: TBD Subject: ErrorProofing/ Poka-Yoke Definition: The principle that defects are prevented by controlling the performance of a process so it cannot produce defects – even when a mistake is made by a machine or a person. Purpose: To provide error free processing to our customers. Workers have been trained in the basics of error-proofing and there is a team responsible for analyzing production defects and identifying error proofing opportunities. Error Proofing workshops are periodically conducted to train selected workers in error proofing. Cross functional team exists and is supported by management to work on applying error proofing to the workplace. Error-proofing devices and methods have been applied to both manual operations and automated process. Error-proofing devices and methods have been implemented or are being developed to eliminate the top production defects for each work area in the plant. 1 4 2 3 No. Standard Requirements Document Training Audit Page 1 of 2 Revision Date: 02/21/05 Error-proofing devices that have been installed are monitored for effectiveness, and are maintained and kept in sound working condition. Manual processes have been improved using check fixtures, locating devices, Poka- Yoke, etc. Automated machines are equipped with self-inspecting technology. Priority has been given to top production defects for error proofing efforts. There is a checklist of existing error proofing devices and it has reference to future devices to be developed. Periodic effectiveness monitoring system exists and is kept current.
  • 47.
    Proofing • Level 1:Prevent an error from occurring at the source • Level 2: Detect error as it is being made • Level 3: Prevent the defect from reaching the next operation
  • 48.
    Types of Mistake-Proof Devices • Guide/reference/interference rod or pin* • Alarm* • Limit switch/microswitch* • Counter* • Checklist* • Template • Odd-part-out method • Sequence restriction • Standardize and solve • Critical condition indicator • Stopper/gate • Sensor
  • 49.
    Definition of Changeover Byset-up we mean the length of time from the last good piece of one run to the first good piece of the next run. last good part next good part Time between parts is emphasized because it is a period of non-value added. In other words, the equipment is idle and not producing parts.
  • 50.
    What Is ChangeoverReduction ? •A systematic approach to reducing the time required to changeover a given piece of equipment •An operational tool which: •increases the overall effectiveness of equipment(OEE) •reduces waste
  • 51.
    Page 1 of10 Revision Date: 02/21/05 No. Standard Requirements Document Training Audit Leadership understands, supports and reviews TPM activities. Leaders promote TPM behaviors and have developed goals and objectives that reinforces continuous improvement of the process. Leaders drive accountability and discipline of the TPM process and conduct periodic performance reviews. Tracking system is in place to monitor TPM performance based on defined metrics. Measurables and trends are tracked, displayed and communicat- ed including (but not limited to) Overall Equipment Effectiveness (OEE), uptime, availability, breakdowns, percent scheduled PM inspections and PM tasks completed. TPM process is well defined, written, communicated and performed properly. Documented TPM process and procedures are properly performed operators and Skilled Trades employees in a timely manner. TPM process defines the plan, purpose, objects, tasks, records, reporting, inspection frequencies, PM schedules, roles, responsibilities and visual management system. All employees are fully trained TPM process, practices, roles, responsibilities, safety and ergonomic requirements. Employees are provided detailed and comprehensive training and instructions in proper maintenance, safety and ergonomics practices with special emphasis on lock-out procedures (if applicable). Owner: TBD System: Total Productive Maintenance (TPM) Definition: Standardized Work of maintenance activities for machines, tools, facilities and equipment. Purpose: Maximize equipment and machinery operating life, reduce variation improve performance, uptime, availability, quality, efficiency and reduce breakdowns. 1. 2. 3. 4.
  • 52.
    Machine Operator Checklist(cont.) Daily Total Preventive Maintenance Check Sheet Month/ Year/ ______ ______ Process/ Cell Name: Process/ Cell Number: 1. If the condition of the check item is normal, mark (0) in proper box. 2. If the condition of the check item is not to standard, mark (x) in proper box. PICTURE NO. DAILY CHECK STANDARD 1 2 3 4 5 6 7 Check each tool board in work cell daily by shift All tools must be present and accounted for daily by shift Prod. Mgr.: Plant Eng.: Prod. Supvr.: Maint. Tech.: M I S C 1 2 3 4 5 6 7 8 9 10 11 12 13 14 15 16 17 18 19 20 21 22 23 24 25 26 27 28 29 1 2 3 1 1 1 1 1 1 2 2 3 3 3 2 2 2 2 3 3 3 sign sign sign sign Page 10 of 10 Revision Date: 02/21/05
  • 53.
    Sight Gage VisualAid Green: Normal Operating Range Yellow: Caution Red: Requires Immediate Attention Visual Indicator Direction of Rotation Inspection & Adjustment Opening (without need to lock-out) Page 7 of 10 Revision Date: 02/21/05
  • 54.
    Page 1 of4 Revision Date: 02/21/05 No. Standard Requirements Document Training Audit 1. Parts are ordered based on actual consumption. Manual or electronic Kanban system is used to order and replenish consumed material each day. Plant does not order more parts than are needed and supplier does not over or under ship. Material is received when needed at a specified time and receiving. Truck deliveries arrive at a predetermined scheduled time and dock. Arrivals are leveled during each shift to evenly distribute and balance receiving dock workloads and minimize inventory levels. Receiving is within plus or minus 15 minutes of the designated time. Trucks are live unloaded in a timely manner. Receiving areas are visually managed. Receiving locations are clearly labeled on the inside and outside of the docks. Receiving display boards are strategically positioned at or near the docks to monitor performance. Display boards include receiving dock numbers, carrier names by dock location, scheduled arrival time (in), actual arrival time, scheduled departure time (out), actual departure time, late/ on-time performance status. Receiving docks are organized and with visual indicators for drop zones, staging area lanes and empty returnable container locations. 2. 3. Owner: TBD System: External Material Pull & Conveyance Definition: Material replenishment system between suppliers and the plant based on actual consumption. Purpose: To order, deliver and receive material on a just-in-time basis to minimize inventory and freight costs by optimizing transportation, logistics and containerization.
  • 55.
    Owner: TBD System: LeanContainers and Packaging Definition: Containers designed to be operator friendly, ergonomically correct and economically sized to optimize transportation while minimizing space utilization at all manufacturing workstations. Purpose: To reduce non-value added work of Direct Labor Operators. No. Standard Requirements Document Training Audit Page 1 of 10 Revision Date: 02/21/05 Process is in place to determine the most appropriate container dimensions, weight and standard pack quantity. Container sizes are reduced to the smallest economic quantity to minimize workstation layout space. PFEP profile is completed for all components by a Material Packaging Engineer. First priority for all packaging decisions is to assure that the all containers are operator friendly and minimize non-value added handling and waste of motion. Small hand delivered durable plastic returnable containers: • are the packaging of choice to eliminate disposable materials. • are ergonomically sized to assure that the containers and parts do not exceed the NIOSH ergonomic lifting weight guidelines. • have rigid walls and are stackable (nest together). • designed with lift straps or side slots to facilitate lifting and handling. • have an integrated clip to hold Kanban cards. • selected from a standard menu of approved configurations. Plan For Every Part (PFEP) profile is created for all components for new model programs (Material Packaging Engineers). 1.
  • 56.
    4527864 9973421 5673021 9856482 SmallLot Delivery to Workstation. Returnable container with lift handles or slots weighing less than 38 lbs. each. Maximize Trailer Liquid Cube Utilization
  • 57.
    “A” Line “B” Line “C”Line Quality Verification Tracking Board Quality Verification Station FGI Quality System Verification
  • 58.
    Continuous Improvement Process Identify Phase Analyze Phase Plan Phase Implement Phase Evaluate Phase Standardize CrossFunctional Teams Current Workstation Situation New Opportunity Plan for Every Operation & Part Current Line Balance Improved Line Balance Improved Workstation Situation 4981654 Reorder at 5 pcs. 4981654 4981654 Reorder at 5 pcs. Reorder at 5 pcs. 4981654 0 0% 0 0 0 0 BP TOTAL PRIOR 0 0 0 0 0 Op. Std. Ref. # P/F/G/N Does Not Meet Std. Partially Meets Std. Fully Meets Std. Not Applicable Best Practices Poor Fair Good N/A B/P 1 2 & 16 2 2 3, 4 & 9 4 5 5 6 7 8 10 8 & 12 5 & 12 13 6 & 14 14 14 14 14 14 14 15 16 17 Operator(s) workloadsare balanced to minimize non-value added functions? Distrance traveled to walk and get parts is minimized with the use of aprons, tracking devices, carts, trays andstands. Operators begin theirwork cycle at the "start mark" and end at or nearthe "finish mark"? Operator makes no more than 2 trips during each job cycle to the workbench or material to get tools or parts. Parts, tools and fixtures are located/positioned for ease of access? Indirect Labor work functions that are performed on a regular and frequent basis are performed according written Standardized Work? Standardized Work document is current and includesaccurate validated information? Operators do not perform ergonomically stressful functions (i.e. excessive tugging, prying, pulling apart, stretching, effort, bending, reaching)? Operators do not perform difficult blind attachements or movements? Operators do not perform awkward movements that require body repositioning or extra effort? Operators understand and follow the Standardized Work instructions? All operators (including new hires and temporaries) have been trained using Standardized Work? Standardized Work System Description/Element Questions Percentage Ranking Team/operators were involved in developing the Standardized Work? Total Points Earned Total Points Possible Build document, manifest orinstructions are clearlyvisible and easy to understand? Handling of dunnage/containers is minimized to 1 every 4 cycles? Audit Date: TOTAL POINTS Auditor Name: Total Elements for Department Elements Not Applicable Total Elements Audited Operator decsions are minimized to between 1 -3 per job cycle? Operators do not perform complicated movements requiring adegree high dexterity? All non-value added and unecessary movements and efforts are minimized? Operator work envelop size is minimized to reduce walking distance (i.e. heigth, depth and width)? Operators cycle equipment and perform other value added work while machinescomplete theircycle? Operators do not perform movements that require change of control or double handling of tools and parts? Operator delays are minimized (i.e. holding, waiting, fumbling, loss of control)? Operator movements are not restricted orobstructed causing deviation from the most direct path? Standardized Work instructions are posted, protected, clearly visible and updated? Opportunities to combine, simplify and eliminate work elements has been achieved? Team Leader Industrial Engineer Supervisor Material Control Maintenance Assessment 1 2 3 4 5
  • 59.
    16 Feet Wide Before Kanban Pull System  Electronic Pull System  Andon & Fixed Position Stop  Sequenced Components  Small Lot Containers  Compressed Work Space  Storage Height Limited  Visual Management Capability  Ergonomic Friendly  Improved Part Presentation  Reduced NVA Waste  Improved Flow 8 Feet Wide 4981654 Reorder at 5 pcs. 6873091 5 Feet High 1739754 1563761 After Fixed
  • 60.
    Electronic Kanban Operator pushesthe button when reaches the designated reorder point. Handler returns empty rack or pallet and places the Kanban card back in the Andon board slot and turns-off light. 6 Part Number 4981654 Storage Location Aisle 3 Rack 4 Shelf 2 Spot 1 Using Address Part Description Passenger Seat Back Frame Supplier Name Morristown Rec. Dock 4 Del. Route 3 Std. Pack 42 pcs. Daily Usage 336 pcs. Card 1 of 2 Date Issued 1/9/03 CTS-003-R 1 2 3 4 5 6 7 8 9 10 11 12 13 14 15 16 17 18 19 20 21 22 Flashing Light indicates order waiting for a response. Card slot and blinking light corresponding to material ordered. Andon board is activated. 2 Handler takes card from board and presses button to confirm delivery to the operator. Order Sequence Queue Handler delivers new material to line-side and takes empty to storage area. 5 Handler gets ordered parts from Central Material Storage. 4 1 3 9 9 5 1 6 7 5 Full Orders prioritized by time of receipt and usage rate. 9 9 5 1 6 7 5 Part: Adjuster Part No: 9951675 Std. Pack: 90 Min: 1 Max: 3 Stack: 3 High 9951675 Empty 9 9 5 1 6 7 5 Page 7 of 7 Revision Date: 02/21/05
  • 61.
    Stretch Objectives:  1Day Dock-to-Dock Time  15 Day Order-to-Delivery Time Collection Frequency: Daily DTD = (Raw Material Inventory + Manufacturing Cycle Time + Finished Goods Inventory) where:  Manufacturing Cycle Time (MCT) = the elapsed time between the first and last operation of a process.  Raw Material and finished goods inventories = the number of production days on hand = (number of pieces in inventory/average daily production volume) Lean Manufacturing Metrics: Dock-to-Dock Time is the elapsed time between unloading raw materials and releasing finished goods for shipment.
  • 62.
    Dock-to-Dock Time (DTD) •Definition: The elapsed time between the unloading of raw materials and the release of finished goods for shipment. • Objective: Less than or equal to 2 days DTD. • Benefits of Improved DTD Include: – Decreased inventories lead to less material handling and storage, resulting in fewer opportunities to damage parts. Fewer damaged parts improves First Time Through. – Improved DTD leads to improved ability to adjust to schedule changes and support the Customer. – Lower material handling, obsolescence, and inventory carrying costs all lead to improved Total Cost.
  • 63.
    Dock-to-Dock Time (DTD) ProductionProcess Incoming Warehouse Finished Goods Warehouse Manufacturing Cycle Time (MCT) Dock-to-Dock Time (DTD) Receiving Shipping
  • 64.
    Overall Equipment Effectiveness(OEE) Stretch Objectives:  Zero Defects Made  Zero Defects Passed on  100% First-Time-Through Capability Collection Frequency: Daily OEE = (Availability) x (Performance Efficiency) x (Quality Rate) where: OEE (similar to Uptime) is a measure of the availability, performance efficiency, and quality rate for a given product on a given piece of equipment. Availability = Operating Time  Net Available Time Performance Efficiency = (Ideal Cycle Time) (Total Parts Run)  Operating Time Quality Rate = (Total Parts Run - Total Defects)  Total Parts Run
  • 65.
    Overall Equipment Effectiveness(OEE) • Definition: A measure of the availability, performance efficiency, and quality rate of a given piece of equipment. • Objective: To improve the OEE on the constraint piece of equipment. • Benefits of Improved OEE Include: – More stable processes improve production predictability, therefore improving Build-to-Schedule – Lower rework and scrap costs, and higher throughput, lead to improved Total Cost results
  • 66.
    Overall Equipment Effectiveness(OEE) Overall Equipment Effectiveness Availability Performance Efficiency Quality = X X Identifiable Minor Stoppages Equipment Breakdowns and Tooling Losses Setup and Adjustment Losses Reduced Speed Losses Idling and Minor Stoppage Losses Quality Defects in Process Losses Startup Losses
  • 67.
    Stretch Objectives:  1Day Dock-to-Dock Time  15 Day Order-to-Delivery Time Collection Frequency: Daily FTT = First Time Through Capability (FTT) The percentage of units that complete a production process and meet quality guidelines the first time. (i.e. not rerun, re-tested, diverted for off-line repair, returned or scrapped) Units Entering the Process - (Scrap + Reruns + Restarts + Units Repaired Off-Line)  Units Entering the Process
  • 68.
    First Time ThroughCapabilities (FTT) • Definition: The percentage of units that complete a process and meet quality guidelines the first time without being scrapped, rerun, re-tested, diverted for off-line repair, or returned. • Objective: 100% FTT Capability; zero defects made or passed on. • Benefits of Improved FTT Include: – Increased quality reduces the need for excess inventory thereby improving Dock-to-Dock Time – Improves the ability to maintain sequence throughout the process thereby improving Build-to- Schedule – Increased quality before the constraint ensures that it only receives “good parts”, which reduces wasted output at the constraint, improving OEE – Total Cost is reduced through lower warranty, scrap, rework, and repair costs • If Things Were Done Correctly 99.9% of the Time… – There would be 2 unsafe plane landings at O’Hare Airport every day. – 20,000 drug prescriptions would be improperly filled each week. – 32,000 checks would be deducted from the wrong bank account each hour.
  • 69.
    Build-to-Schedule (BTS) Stretch Objectives: 100% Built-to-Schedule Collection Frequency: Daily BTS = (Volume Performance) x (Mix Performance) x (Sequence Performance) where: Build-to-Schedule measures how well a plant executes production plans to produce the right product volumes, on the right day, and in the right mix or sequence. Volume Performance = Actual Number of Units Produced  Scheduled Number of Units Mix Performance = Actual Number of Units Built to Mix  Actual Number of Units Produced Sequence Performance = Actual Number of Units Built to Sequence  Actual Number of Units Built to Mix
  • 70.
    Build-to-Schedule (BTS) • Definition:The percentage of units scheduled for a given day that are produced on the correct day, in the correct mix, and in the correct sequence. • Objective: 100% BTS. • Benefits of Improved BTS Include: – Improved BTS requires less inventory and Dock-to-Dock Time is improved – Lower material handling and inventory carrying costs lead to improved Total Cost
  • 71.
    A short test… Ashort test… You own a factory and you need to produce more product - how?  Work longer  Work harder  Add people  Add equipment  Eliminate waste Eliminate waste Quality Quality Quality Quality Quality Quality ? ? Cost Cost Cost Cost Cost Cost The Lean Way
  • 72.

Editor's Notes

  • #3 Lean Manufacturing Philosophy which shortens the time line between the customer order and the shipment by eliminating waste. Compressed time from order to delivery results in a satisfied customer, lower carrying costs, and lower manufacturing costs due to eliminated work and improved quality.
  • #5 Before Rapidly expanding markets. Consumer orientated towards quantity not quality. Abundant low cost resources. Management concerned with increased sales not decreased cost. Now Increased competition in saturated or shrinking markets. Consumer values more exacting quality requirements and on time delivery. Sharp rise in material/labour cost. Over capacity of production facilities. With the current number of automotive production facilities there is the potential to manufacture 74,000,000 vehicles. At the present time there are only approximately 50,000,000 customers worldwide. The overcapacity is therefore easy to calculate at around 33%. No manufacturer plans to run a production line at 66% of it’s potential capacity so the economies required to make a profit are not possible at most plants in the world at the present time. Additionally the consumer has changed. Because there is no longer an expanding market, where all product was easily sold, the consumer is now in a strong bargaining position, and is constantly driving the market value for vehicles lower, either directly via price or by improved equipment levels at the same price. All of this contributes to a very difficult market place in which to manufacture and sell automobiles.
  • #12 Before showing slide ask what is value added.
  • #31 Purpose: To define Standardized Work Main Point: The definition of Standardized Work; Keep in mind Standardized Work includes the time while the machine is running and what the operator does during this time. Standardized Work helps us to identify wastes and eliminate them.
  • #32 Purpose: To list the Benefits of Standardized Work Main Points: Reduce variation in the process - Link to quality improvement Reduce the opportunities for errors - Link to quality improvement Describe the best method at the present time - Emphasize -at the present time, if it truly is the best method, then continuous improvement has been eliminated Clearly illustrate the relationship between TAKT time and Cycle time - A very important relationship in helping us to identify the “wastes” in manufacturing
  • #33 Purpose: To introduce Standardized Work Main point: An introduction to the Standardized Work Module Shown above: a Standard Work Combination sheet and a Time Observation Form both are used along with other tools to help achieve Standardized Work and Improvements. This Module along with the instructor’s guidance will provide the audience with information about Standardized Work and how to implement Standardization of work.
  • #34 Purpose: Formal definition of Value Stream Mapping Main Points: Focus is on the product flow Teaching Tips: Transition: Next: What is Value Stream Mapping?
  • #35 Purpose: Simple meaning of Value Stream Mapping Main Points: visual representation of every process in material and information flow Teaching Tips: Transition: Next: Visual of the boundaries of Value Stream Mapping
  • #36 Purpose: To show VSM is an essential tool Main Points: Teaching Tips: Transition: What’s the purpose of Value Stream Mapping? Next: Objectives of Value Stream mapping.
  • #37 Purpose: Objectives of Value Stream mapping. Main Points: Teaching Tips: Transition: Before we can Map the Process, we need to understand Lean Concepts Next: Lean Concepts
  • #38 Purpose: Provides the first step of Current State map Main Points: Keep it simple! Teaching Tips: Mapping begins with the Customer’s Requirements Transition: Next: Map the Material Flow
  • #39 Purpose: Information to collect for Current State Map Main Points: Teaching Tips: Transition: Next: Map the Information Flow
  • #40 Purpose: Information to collect for Current State Map Main Points: Teaching Tips: Transition: Next: Calculate Total Product Cycle Time
  • #41 Purpose: Main Points: Teaching Tips: Transition: Next: Introduction to Value Stream Mapping
  • #42 Purpose: Main Points: Teaching Tips: Transition: Next: Session 1 – map current state
  • #47 This slide shows the problem solving cycle. Once a problem has surfaced, develop a cross-functional team to attack the problem head on using the cycle above. Now, if the team or quality department wants more detailed information regarding problem solving techniques instruct them to hold a Compass on Problem Solving. There is a module designed specifically for this cause.
  • #50 Purpose: Show a list of Mistake-Proofing devices Main Points: Point out the starred items – most commonly used. This is not an exhaustive list. There are many more. We will see examples of these and others Teaching Points: Ask: What do you think about a checklist as a Mistake-Proofing device? Is it 100% effective? Transition: We’ll look at a few examples. Let’s start with the Guide/Reference/Interference Rod Next: Guide/Reference/Interference Rod
  • #51 Purpose: To highlight the difference between set-up and changeover. Main point: Changeover is concerned only with detach and attach. Why? -World Class Companies do not have to: Locate tools, dies, and fixtures Enter offsets Make adjustments Send to 1st piece inspection
  • #52 Purpose: To describe what is setup reduction Main Points: A systematic approach to reducing the time required to setup or change a given piece of equipment. An operational tool which: Increases the overall effectiveness of equipment. Reduces waste of raw materials and finished goods.
  • #54 Machine Operator Checklist ( checklist) Implementation 2 Minutes Purpose: To show the checklist that operators complete to verify that the maintenance was performed. Main Points: This ensures that the regular maintenance will be done. In the “what to do” column “check” is the common word. Teaching Tips: Ask: What kinds of checklists do you use to make sure you have covered all the bases in an important activity? How does the checklist help? Transition: Here’s an example of an operator checklist NEXT: Operator Checklist