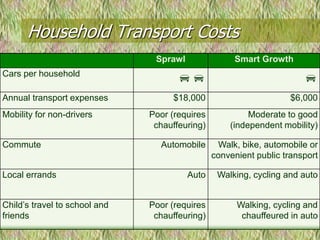
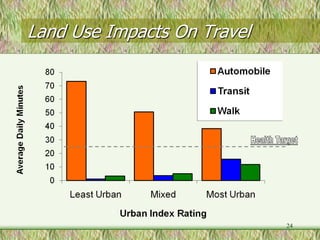
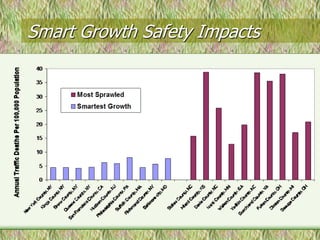
Comprehensive
Evaluation of Smart
 Growth Benefits


           Todd Litman
  Victoria Transport Policy Institute
               Presented
        Smart Growth Debate
             Langley, BC
            23 February 2012
Farmland Preservation Vs Sprawl
•   Farms are subdivided.
•   Land values and taxes
    increase.
•   Infrastructure costs rise
    (water, sewage,
    roads).
•   Road traffic increases.
•   Farming becomes less
    viable, forcing other
    farms to subdivide.
Farmland Preservation Vs Sprawl
•   Farms are subdivided.
•   Land values and taxes
    increase.
•   Infrastructure costs rise
    (water, sewage,
    roads).
•   Road traffic increases.
•   Farming becomes less
    viable, forcing other
    farms to subdivide.
Farmland Preservation Vs Sprawl
•   Farms are subdivided.
•   Land values and taxes
    increase.
•   Infrastructure costs rise
    (water, sewage,
    roads).
•   Road traffic increases.
•   Farming becomes less
    viable, forcing other
    farms to subdivide.
Smart Growth Development

Land use and transport
policies that encourage
development of compact,
mixed, walkable urban
villages where commonly-
used goods and services
(shops, restaurants,
elementary schools, parks,
etc.) are nearby, and high
quality public transit provides
convenient access to other
regional destinations.
                                  Victoria’s Cook Street Village is a example of a
                                  multi-modal urban village where walking,
                                  cycling, automobile and public transport are all
                                  convenient and safe transport options
                                                                           15
Retrofitting Suburbs

Many smaller cities, towns
and suburban strips are now
being retrofitted based on
smart growth principles to
create compact, walkable and
bikeable, mixed use
neighborhoods, reflecting
traditional development
practices.


                               16
Linking the Centers across US29
by Dan Burden, Walkable & Livable Communities Institute
Ped/bike bridge from mall to transit stop/garage


18
Mixed-use redevelopment on mall parking lot


19
Landscaping matures


20
Additional redevelopment


21
Landscaping matures over time


22
Household Transport Costs
                                Sprawl               Smart Growth
Cars per household
                                                                     
Annual transport expenses            $18,000                        $6,000
Mobility for non-drivers       Poor (requires            Moderate to good
                                chauffeuring)       (independent mobility)

Commute                          Automobile      Walk, bike, automobile or
                                                convenient public transport

Local errands                            Auto    Walking, cycling and auto


Child’s travel to school and   Poor (requires         Walking, cycling and
friends                         chauffeuring)          chauffeured in auto
Land Use Impacts On Travel


                             24
Smart Growth Safety Impacts
Healthy Communities

     Walkability
•   Improves public
    fitness and
    health
•   Improves
    mobility options
    for non-drivers
•   Transport cost
    savings and
    affordability
•   Increases
    community
    livability
“A Heavy Load” Report

Lower-income households
in neighborhoods located
closer to the central cities
spend a much smaller
portion of their income on
housing and transport than
those located in more
sprawled neighborhoods.
Return on Investment
                       High quality public transit
                       typically requires about $268 in
                       additional subsidies and $104
                       in additional fares annually per
                       capita, but provides vehicle,
                       parking and road cost savings
                       averaging $1,040 per capita,
                       plus other savings and benefits:
                       • Parking cost savings.
                       • Congestion reductions
                       • Accident reductions
                       • Pollution reductions Improved
                       mobility for non-drivers,
                       • Improved fitness and health
Equity
           A more diverse transportation
           systems helps achieve equity
           objectives:
         • A fair share of public resources for
           non-drivers.
         • Financial savings to lower-income
           people.
         • Increased opportunity to people who
           are physically, socially or economically
           disadvantaged.
Sprawl Is Costly
                                                             $10,000

• Increases infrastructure


                              Annual Transport Expenditurs
  and public service costs.                                   $8,000


• Increases transportation                                    $6,000

  costs and reduces travel
  options.                                                    $4,000


• Environmental costs
                                                              $2,000
  (reduced greenspace and
  wildlife habitat).                                              $-
                                                                       Smart    Sprawl
                                                                       Growth
                                                                                   32
Smart Growth Benefits
         Economic                        Social                     Environmental

Infrastructure cost savings   Improved transport options,      Greenspace & habitat
                              particularly for non-drivers     preservation
Public service cost savings
                              Increased housing options        Energy savings
Transportation efficiencies
                              Community cohesion               Air pollution reductions
Agglomeration efficiencies
                              Cultural resource preservation   Water pollution reductions
Economic reliance             (historic sites, traditional
                              neighborhoods, etc.)             Reduced “heat island”
Supports industries that                                       effect.
depend on high quality        Increased physical exercise
environments (tourism,        and health
farming, etc.)


                                                                                   33
Memo From Future Self
Hope for the best but prepare for the
worst:
 • Physical disability – diverse and
   integrated transport with universal design
   (accommodates people with disabilities
   and other special needs).
 • Poverty and inflation – affordable
   housing in accessible, multi-modal
   locations.
 • Higher fuel prices – improve efficient
   modes (walking, cycling and public
   transport).
 • Isolation and loneliness – community
   cohesion (opportunities for neighbors to
   interact in positive ways).
Trends Supporting Multi-Modalism
                   • Motor vehicle saturation.
                   • Aging population.
                   • Rising fuel prices.
                   • Increased urbanization.
                   • Increased traffic and
                     parking congestion.
                   • Rising roadway
                     construction costs and
                     declining economic return
                     from increased roadway
                     capacity.
                   • Environmental concerns.
                   • Health Concerns
Housing Demand By Type (Nelson 2006)

The current supply of
large-lot suburban is
approximately adequate
to satisfy demand for
the next two decades.

Most growth will be in
smaller-lot and multi-
family housing.
High Quality Public Transit
• Geographic coverage (serves many
  worksites, schools, stores, recreational
  areas, neighborhoods).
• Relatively fast, reliable and and frequent.
• Comfortable and clean vehicles and
  waiting areas.
• Convenient information and payment
  systems.
• Affordable relative to incomes and
  driving costs.
• Safe and secure.
• Courtesy and responsiveness.
Walking and Cycling Improvements
• More investment in
  sidewalks, crosswalks,
  paths and bike lanes.
• Improved roadway
  shoulders.
• More traffic calming.
• Bicycle parking and
  changing facilities.
• Encouragement, education
  and enforcement programs.
Motorists Benefit Too
  More balanced transport policy is
  no more “anti-car” than a healthy
  diet is anti-food. Motorists have
  every reason to support these
  reforms:
• Reduced traffic and parking
  congestion.
• Improved safety.
• Improved travel options.
• Reduced chauffeuring burden.
• Often the quickest and most cost
  effective way to improve driving
  conditions.
Supported by Professional Organizations
                       •   Institute of Transportation
                           Engineers.
                       •   American Planning Association.
                       •   American Farmland Trust.
                       •   Federal, state, regional and
                           local planning and
                           transportation agencies.
                       •   International City/County
                           Management Association
                       •   National Governor’s Association
                       •   Health organizations.
                       •   And much more...
Roadway Costs
Transport Canada reports that in
2009–10, all levels of Canadian
government spent $28.9 billion on
roads, about $900 annually per
capita, and collected $12.1 billion
in fuel taxes and $4.4 billion in
other road user fees, indicating
that in Canada, user fees cover
about 64% of roadway costs.

 Transport In Canada: An Overview,
Transport Canada
(www.tc.gc.ca/eng/policy/report-aca-
anre2010-index-2700.htm).
“Where We Want To Be: Home Location Preferences & Their Implications for Smart Growth”
“If Health Matters: Integrating Public Health Objectives into Transportation Decision-Making”
              “Evaluating Transportation Economic Development Impacts”
                   “Affordable-Accessible Housing In A Dynamic City”
                          “The Future Isn’t What It Used To Be”
                           “Evaluating Smart Growth Benefits”
                               “Online TDM Encyclopedia”
                                        and more...
                                 www.vtpi.org

Smart Growth Debate Proponent's Presentation

  • 1.
    Comprehensive Evaluation of Smart Growth Benefits Todd Litman Victoria Transport Policy Institute Presented Smart Growth Debate Langley, BC 23 February 2012
  • 12.
    Farmland Preservation VsSprawl • Farms are subdivided. • Land values and taxes increase. • Infrastructure costs rise (water, sewage, roads). • Road traffic increases. • Farming becomes less viable, forcing other farms to subdivide.
  • 13.
    Farmland Preservation VsSprawl • Farms are subdivided. • Land values and taxes increase. • Infrastructure costs rise (water, sewage, roads). • Road traffic increases. • Farming becomes less viable, forcing other farms to subdivide.
  • 14.
    Farmland Preservation VsSprawl • Farms are subdivided. • Land values and taxes increase. • Infrastructure costs rise (water, sewage, roads). • Road traffic increases. • Farming becomes less viable, forcing other farms to subdivide.
  • 15.
    Smart Growth Development Landuse and transport policies that encourage development of compact, mixed, walkable urban villages where commonly- used goods and services (shops, restaurants, elementary schools, parks, etc.) are nearby, and high quality public transit provides convenient access to other regional destinations. Victoria’s Cook Street Village is a example of a multi-modal urban village where walking, cycling, automobile and public transport are all convenient and safe transport options 15
  • 16.
    Retrofitting Suburbs Many smallercities, towns and suburban strips are now being retrofitted based on smart growth principles to create compact, walkable and bikeable, mixed use neighborhoods, reflecting traditional development practices. 16
  • 17.
    Linking the Centersacross US29 by Dan Burden, Walkable & Livable Communities Institute
  • 18.
    Ped/bike bridge frommall to transit stop/garage 18
  • 19.
    Mixed-use redevelopment onmall parking lot 19
  • 20.
  • 21.
  • 22.
  • 23.
    Household Transport Costs Sprawl Smart Growth Cars per household   Annual transport expenses $18,000 $6,000 Mobility for non-drivers Poor (requires Moderate to good chauffeuring) (independent mobility) Commute Automobile Walk, bike, automobile or convenient public transport Local errands Auto Walking, cycling and auto Child’s travel to school and Poor (requires Walking, cycling and friends chauffeuring) chauffeured in auto
  • 24.
    Land Use ImpactsOn Travel 24
  • 25.
  • 26.
    Healthy Communities Walkability • Improves public fitness and health • Improves mobility options for non-drivers • Transport cost savings and affordability • Increases community livability
  • 27.
    “A Heavy Load”Report Lower-income households in neighborhoods located closer to the central cities spend a much smaller portion of their income on housing and transport than those located in more sprawled neighborhoods.
  • 30.
    Return on Investment High quality public transit typically requires about $268 in additional subsidies and $104 in additional fares annually per capita, but provides vehicle, parking and road cost savings averaging $1,040 per capita, plus other savings and benefits: • Parking cost savings. • Congestion reductions • Accident reductions • Pollution reductions Improved mobility for non-drivers, • Improved fitness and health
  • 31.
    Equity A more diverse transportation systems helps achieve equity objectives: • A fair share of public resources for non-drivers. • Financial savings to lower-income people. • Increased opportunity to people who are physically, socially or economically disadvantaged.
  • 32.
    Sprawl Is Costly $10,000 • Increases infrastructure Annual Transport Expenditurs and public service costs. $8,000 • Increases transportation $6,000 costs and reduces travel options. $4,000 • Environmental costs $2,000 (reduced greenspace and wildlife habitat). $- Smart Sprawl Growth 32
  • 33.
    Smart Growth Benefits Economic Social Environmental Infrastructure cost savings Improved transport options, Greenspace & habitat particularly for non-drivers preservation Public service cost savings Increased housing options Energy savings Transportation efficiencies Community cohesion Air pollution reductions Agglomeration efficiencies Cultural resource preservation Water pollution reductions Economic reliance (historic sites, traditional neighborhoods, etc.) Reduced “heat island” Supports industries that effect. depend on high quality Increased physical exercise environments (tourism, and health farming, etc.) 33
  • 34.
    Memo From FutureSelf Hope for the best but prepare for the worst: • Physical disability – diverse and integrated transport with universal design (accommodates people with disabilities and other special needs). • Poverty and inflation – affordable housing in accessible, multi-modal locations. • Higher fuel prices – improve efficient modes (walking, cycling and public transport). • Isolation and loneliness – community cohesion (opportunities for neighbors to interact in positive ways).
  • 35.
    Trends Supporting Multi-Modalism • Motor vehicle saturation. • Aging population. • Rising fuel prices. • Increased urbanization. • Increased traffic and parking congestion. • Rising roadway construction costs and declining economic return from increased roadway capacity. • Environmental concerns. • Health Concerns
  • 36.
    Housing Demand ByType (Nelson 2006) The current supply of large-lot suburban is approximately adequate to satisfy demand for the next two decades. Most growth will be in smaller-lot and multi- family housing.
  • 37.
    High Quality PublicTransit • Geographic coverage (serves many worksites, schools, stores, recreational areas, neighborhoods). • Relatively fast, reliable and and frequent. • Comfortable and clean vehicles and waiting areas. • Convenient information and payment systems. • Affordable relative to incomes and driving costs. • Safe and secure. • Courtesy and responsiveness.
  • 38.
    Walking and CyclingImprovements • More investment in sidewalks, crosswalks, paths and bike lanes. • Improved roadway shoulders. • More traffic calming. • Bicycle parking and changing facilities. • Encouragement, education and enforcement programs.
  • 39.
    Motorists Benefit Too More balanced transport policy is no more “anti-car” than a healthy diet is anti-food. Motorists have every reason to support these reforms: • Reduced traffic and parking congestion. • Improved safety. • Improved travel options. • Reduced chauffeuring burden. • Often the quickest and most cost effective way to improve driving conditions.
  • 40.
    Supported by ProfessionalOrganizations • Institute of Transportation Engineers. • American Planning Association. • American Farmland Trust. • Federal, state, regional and local planning and transportation agencies. • International City/County Management Association • National Governor’s Association • Health organizations. • And much more...
  • 41.
    Roadway Costs Transport Canadareports that in 2009–10, all levels of Canadian government spent $28.9 billion on roads, about $900 annually per capita, and collected $12.1 billion in fuel taxes and $4.4 billion in other road user fees, indicating that in Canada, user fees cover about 64% of roadway costs. Transport In Canada: An Overview, Transport Canada (www.tc.gc.ca/eng/policy/report-aca- anre2010-index-2700.htm).
  • 42.
    “Where We WantTo Be: Home Location Preferences & Their Implications for Smart Growth” “If Health Matters: Integrating Public Health Objectives into Transportation Decision-Making” “Evaluating Transportation Economic Development Impacts” “Affordable-Accessible Housing In A Dynamic City” “The Future Isn’t What It Used To Be” “Evaluating Smart Growth Benefits” “Online TDM Encyclopedia” and more... www.vtpi.org