Download as PDF, PPTX
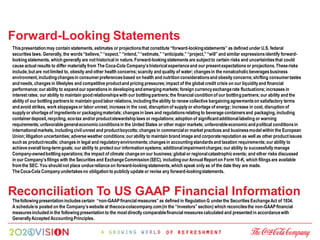


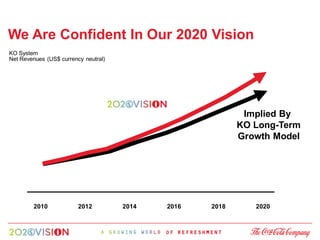


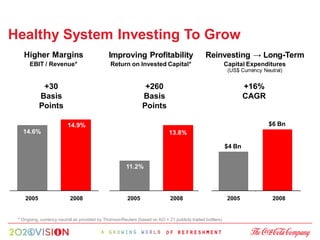


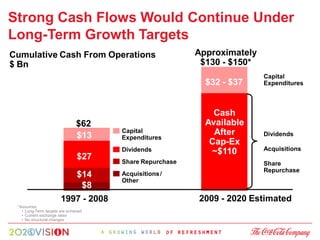


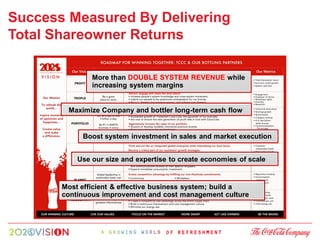

Gary Fayard presented The Coca-Cola Company's financial vision and outlook. He outlined the company's long-term growth targets of 6-8% annual net revenue growth and 3-4% annual operating income growth on a currency neutral basis. He explained how the company will achieve these targets through tailored actions in different markets and by leveraging its competitive advantages of global brands, an extensive bottling system, scale and operational flexibility.


![2022 Beverage Forum Non-Alcoholic Workshop[87].pdf](https://cdn.slidesharecdn.com/ss_thumbnails/2022beverageforumnon-alcoholicworkshop87-230227152104-daa6433a-thumbnail.jpg?width=640&height=640&fit=bounds)


