Download as PDF, PPTX


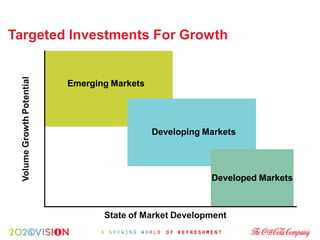
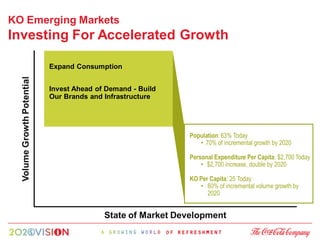

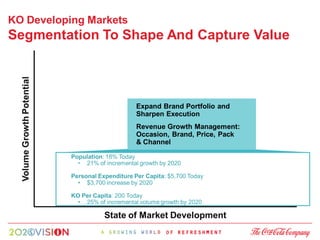
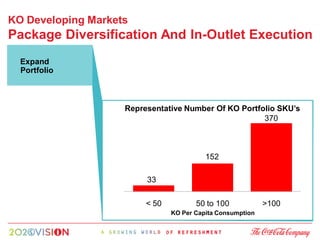
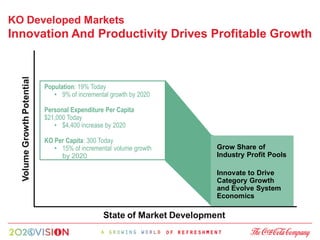
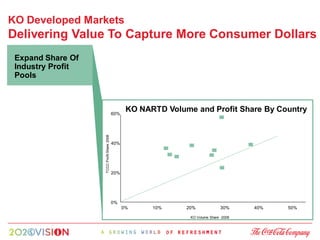


This document discusses Coca-Cola's geographic portfolio strategy for growth. It divides markets into emerging, developing, and developed, and outlines strategies for each. For emerging markets, Coca-Cola plans to invest ahead of demand to build brands and infrastructure as these markets experience high population and expenditure growth. In developing markets, Coca-Cola will segment markets and expand portfolio to capture value as personal expenditures increase. For developed markets, Coca-Cola will drive profitable growth through innovation and productivity. The overall strategy aims to expand consumption globally by tailoring investments and initiatives to the state of development in each market.


![2022 Beverage Forum Non-Alcoholic Workshop[87].pdf](https://cdn.slidesharecdn.com/ss_thumbnails/2022beverageforumnon-alcoholicworkshop87-230227152104-daa6433a-thumbnail.jpg?width=640&height=640&fit=bounds)


