SlideShare a Scribd company logo
1 of 34
1
Precious Metals-Gold
• Top 10 Countries’ central banks with largest gold reserves (in tonnes) as of early April 2019:
Central Banks around the world sold 7,853 tonnes of gold between 1987-2009; and bought 3,297 tonnes during
2010-2016.
• Top 10 Gold producing countries (in tonnes/annum) as of December 2018:
• Top 10 Gold consuming countries (in tonnes/annum) as of December 2018:
• Annual supply of gold 10 year average 2008-2017;
Total Mine Supply-67% (2893 tonnes)
Total Recycled Supply- 33% (1413 tonnes)
1. US 2. Germany 3. Italy 4. France 5. Russia 6. China 7. Switzerland 8. Japan 9. Netherlands 10. India
8133.5 3369.7 2451.8 2436 2150.5 1874.3 1040 765.2 612.5 608.7
Source: WGC
1. China 2. Australia 3. US 4. Russia
5. South
Africa
6. Peru 7. Canada 8. Ghana
9.
Indonesia
10.
Uzbekistan
355 270 237 200 190 150 110 100 100 90
Source: WGC
1. China 2. India 3. US 4. Germany 5. Thailand
6. Saudi
Arabia
7. Turkey 8. Iran 9. Vietnam 10. Indonesia
984 849 193 124 90 85 72 71 63 59
Source: WGC
Source: WGC
2
Major Contract Specifications- Gold Futures
Counter Gold Gold Mini Gold Guinea Gold Petal
Symbol GOLD GOLDM GOLDGUINEA GOLDPETAL
Price Quote Rs/10 gms Rs/10 gms Rs/8 gms Rs/gm
P&L per 1 Rs 100 10 8 1
Initial Margin %
Minimum 4% or
based on SPAN
whichever is higher
Minimum 4% or
based on SPAN
whichever is higher
Minimum 4% or
based on SPAN
whichever is higher
Minimum 4% or
based on SPAN
whichever is higher
Tick Size (Rs) 1 1 1 1
Lot Size
(Trading Unit)
1 kg 100 gms 8 gms 1 gm
Delivery Unit 1 kg 100 gms 8 gms 1 gm
Delivery Logic Compulsory Compulsory Compulsory Compulsory
Expiry Date
(Contract Month)
5th Day 5th Day Last Day Last Day
Average Daily
Volatility
0.67% 0.67% 0.70% 0.66%
Break Even Price
Range (Rs.)
17-18 17-18 17-18 17-18
3
Major Contract Specifications-Gold Option Contract
Counter Gold Option
Symbol GOLD
Underlying Gold Futures
Option Type European Call & Put Options
Premium Calculation Black 76 option pricing model
Profit/Loss per 1 Rs. 100
Tick Size (Re) 0.50
Expiry Date (Contract Month)
Three business days prior to the expiry of the underlying futures
contract
Lot Size (Trading Unit) 1 Kg
Strike Intervals 100.00
Strikes
15 In-the-money, 15 Out-of-the-money and 1 Near-the money.
(31 CE and 31 PE).
4
Precious Metals-Silver
• Silver is a brilliant grey-white metal that is soft and malleable. The principal sources of silver are the ores of
silver, silver-nickel, lead, and lead-zinc obtained from Peru, Bolivia, Mexico, China, Australia, Chile, Poland,
and Serbia. Just over half of the mined silver comes from Mexico, Peru, China, and Australia, the four
largest producing countries.
• Primary mines produce about one-third of the world’s silver, while around two-third comes as a by-product
of gold, copper, lead, and zinc mining.
• Silver has innumerable applications in art, science, industry and beyond. At the highest level, though, demand
for silver breaks down into three important categories: silver in industry, investment, silver jewellery and
décor. Together, these three areas represent more than 95% of the annual silver demand.
• With its unique properties, including its strength, malleability, and ductility; its electrical and thermal
conductivity; its sensitivity to and high reflectance of light; and the ability to endure extreme temperature;
it is an element without substitution. Commercial-grade fine silver is at least 99.9% pure, and purities greater
than 99.999% are available.
5
Major Contract Specification-Silver Futures
Counter Silver Silver Mini Silver Micro
Symbol SILVER SILVERM SILVERMIC
Price Quote Rs/kg Rs/kg Rs/kg
P&L per 1 Rs 30 5 1
Initial Margin %
Minimum 4% or based on
SPAN whichever is higher
Minimum 4% or based on
SPAN whichever is higher
Minimum 4% or based on
SPAN whichever is higher
Tick Size (Rs) 1 1 1
Lot Size
(Trading Unit)
30 kg 5 kg 1 kg
Delivery Unit 30 kg 30 kg 30 kg
Delivery Logic Compulsory Both Option Both Option
Expiry Date
(Contract Month)
5th Day Last Day Last Day
Average Daily
Volatility
1.10% 1.10% 1.10%
Break Even Price
Range (Rs.)
18-22 18-22 18-22
6
Major Contract Specification-Silver Option Contract
Counter Silver Option
Symbol SILVER
Underlying Silver Futures
Option Type European Call & Put Options
Premium Calculation Black 76 option pricing model
Profit/Loss per 1 Rs. 30
Tick Size (Re) 0.5
Expiry Date (Contract Month)
Three business days prior to the expiry of the underlying futures
contract
Lot Size (Trading Unit) 30 Kg
Strike Intervals 250
Strikes
10 In-the-money, 10 Out-of-the-money and 1 Near-the-money.
(21 CE and 21 PE).
7
Factors Affecting Precious Metals
• FOMC Meeting, FED/ECB policies and decisions
• Fundamental factors (economic releases)
• Local currency movement
• Central bank's gold buying and selling
• Jewelry demand from top consuming nations
• Monetary easing/tightening by central banks
• Political instability
• Credit Ratings for a specific country
• Debt/GDP ratio of major economies like the US, Europe etc
• Global macro environment
• Investment demand (physical or ETF)
8
Bullion Calculator
Gold & Silver Rate Calculator
Gold(995) Silver (995)
a. USD/INR Exchange rate 75.70
b. International Price $/oz 1598.00 13.95
c. CIP (Insurance) Premium $/oz 1.00 0.75
d. Import Price (b+c) $/oz 1599.00 14.70
e. Fineness 0.995 0.995
f. Price in $ ((d*10)/31.1507*0.995) per 10gms 494.86 4.36
g. Price in Rs (a*f) per 10gms 37460.80 330.11
h. Import Duty (12.5% of g) 3746.08 33.01
i. Import Value (g+h) per 10gms 41206.87 363.12
j. Other Charges (GST) @3% of i 1123.82 9.90
k. Rate (in Rs per 10gm) (i+j) 42331 373.02
l. Rate (in Rs per 1 Kg) (k*100) 37302
m. Cost of carry per day ((5.15/365)*n) 1.03 0.51
Days remaining to expiry 60 30
n. Total Cost of Carry 434.90 15.41
o. MCX Rate 42766 37318
9
Base Metals-Copper
• In world’s metal consumption, copper ranks third after steel and aluminium. It is a product whose fortunes
directly reflect the state of the world's economy, hence also dubbed as Dr. Copper.
• Copper, the best non-precious metal conductor of electricity, has exceptional strength, ductility, and
resistance to creeping and corrosion to make it the preferred and safest conductor of electrical wiring in
buildings. Economic, technological, and societal factors influence the supply and demand of copper. Land-
based resources are estimated at 1.6 billion tonnes of copper, and resources in deep-sea nodules are
estimated at 0.7 billion tonnes. Worldwide, approximately one-third of all copper consumed is recycled.
• Copper is produced in more than 25 countries today. Because of global dispersion of copper production, the
risk of disruption in global supplies is low. On the other hand, because of its importance in construction and
power transmission, any disruption in supplies will have a major effect on the economy.
• Producers, exporters, marketers, processors, and SMEs with exposure to copper can manage their price risks
by hedging. When uncertainty looms large, modern risk management techniques and strategies, including
market-based risk management financial instruments like ‘Copper Futures’, offered on the MCX platform can
improve efficiencies and consolidate competitiveness through price risk management. The importance of risk
management thus cannot be overstated.
• Commodity-specific events, such as the construction of new production facilities or processes, new uses or
the discontinuance of historical uses, unexpected mine or plant closures (natural disaster, supply disruption,
accident, strike, and so forth), or industry restructuring—all affect the price of the metal.
10
Base Metals-Copper
• Total global copper production from mines amounted to an estimated 21 million metric tons in 2018. Major
producing countries include Chile, Peru, and China. Chile mines produced nearly 5.8 million metric tons in
2018, which is one third of the world’s copper, and is also by far the country with the largest copper
reserves.
• The second top producer is China, though the copper mining industry here is nowhere near the production
capacity of Chile. Copper production in China reaches 1,760,000 tonnes per year in 2018. This country is the
largest consumer of copper, consuming almost one third of global copper supply.
• Global copper consumption is steadily increasing, and currently stands at some 23.8 million metric tons.
Forecasts for global copper demand show the same trend. Thus, prices have also increased rapidly over the
last decade, reaching a record high in 2011. To meet these developments, the use of copper scrap for
recycling purposes is now relatively high. Global production of refined secondary copper stood at
approximately 3.87 million metric tons as of 2018.
• India has long been upheld as the next “China”, with the capability to rival the latter’s demand growth based
on the size of its population and clear need for power and transport infrastructure. Although Indian copper
demand is forecast to increase rapidly (at more than 9.5 per cent per annum), its consumption in volume
terms is small, limiting its impact on the global picture.
11
Major Contract Specification-Copper Futures
Counter Copper
Symbol COPPER
Price Quote Rs/kg
P&L per 1 Rs 2500
Initial Margin % Minimum 4% or based on SPAN whichever is higher
Tick Size (Rs) 0.05
Lot Size (Trading Unit) 2.5 MT
Delivery Unit 2.5 MT
Delivery Logic Compulsory
Expiry Date (Contract Month) Last Day
Tender Period Last 5 working days of expiry month
Average Daily Volatility 1.15%
Break Even Price Range (Rs.) 0.20-0.30
12
Major Contract Specification-Copper Option Contract
Counter Copper Option
Symbol COPPER
Underlying Copper Futures
Option Type European Call & Put Options
Premium Calculation Black 76 option pricing model
Profit/Loss per 1 Rs. 2500
Tick Size (Re) 0.01
Expiry Date (Contract Month)
Three business days prior to the expiry of the underlying futures
contract
Lot Size (Trading Unit) 2.5 MT
Strike Intervals 5.00
Strikes
7 In-the-money, 7 Out-of-the-money and 1 Near-the-money. (15
CE and 15 PE).
13
Base Metals-Nickel
• Nickel is a naturally occurring, lustrous, silvery-white metal. It is the fifth most common element on earth
and occurs extensively in the earth's crust. However, most of the nickel is inaccessible in the core of the earth.
• Nickel is preeminently an alloy metal, and its chief use is in nickel steels and nickel cast irons, in which it
typically increases the tensile strength, toughness, and elastic limit. It is widely used in many other alloys,
including nickel brasses and bronzes and alloys with copper, chromium, aluminium, lead, cobalt and silver.
• Some of the key characteristics of nickel are its high melting point, resistance against corrosion and oxidation,
ductility. Others are catalytic properties, ease of deposit by electroplating and formation of alloys readily.
Nickel plays an important role in our daily lives, making its way in myriad objects around us like food
preparation equipment, mobile phones, medical equipment, transport, buildings, and power generation—
the list is almost endless.
• About 65% of the nickel produced is used to manufacture stainless steel. Another 20% is used in other steel
and non-ferrous alloys, often for highly specialized industrial, aerospace, and military applications. About 9%
is used in plating and 6% for other uses, including coins, electronics, batteries for portable equipment, and
hybrid cars. In many of these applications, there is no substitute for nickel without impairing performance or
increasing cost.
• China is the largest consumer of nickel globally utilizing 50.4% of global production, followed by the US and
Japan. Currently, there are about 23 major countries which produce nickel for large-scale commercial use;
these include Russia, Canada, Indonesia, and South Africa. Technology continues to improve daily and this
will ultimately create more uses for nickel, and this is where more sustainable methods of extraction, as well
as alternative metals and alloys, will be used to ensure the global supply of nickel does not run out.
14
Major Contract Specification-Nickel Futures
Counter Nickel
Symbol NICKEL
Price Quote Rs/kg
P&L per 1 Rs 250
Initial Margin % Minimum 5% or based on SPAN whichever is higher
Tick Size (Rs) 0.1
Lot Size (Trading Unit) 1500 Kg from Dec
Delivery Unit 1.5 MT
Delivery Logic Compulsory Delivery
Expiry Date (Contract Month) Last Day
Tender Period Last 5 working day of expiry month
Average Daily Volatility 1.80%
Break Even Price Range (Rs.) 0.40-0.50
15
Base Metals-Zinc
• Zinc is the fourth most widely used metal in the world after steel, aluminium, and copper. Zinc occurs
naturally in the earth's crust and is the 24th most abundant element, with about 1.9 billion tonnes of
identified resources. About 70% of the world's zinc originates from mining, whereas the remaining 30%
comes from recycling secondary zinc.
• It is an essential trace element and necessary for plants, animals, and microorganisms. However, high levels of
zinc exposure through inhalation, ingestion, and dermal contact could cause adverse health effects. Of more
than 13 million tons of the metal produced annually, about half of it is used for galvanization. Brass and
bronze production accounts for another 17% of zinc's use. Zinc, its oxide, and other compounds are found in
batteries, sunscreen, paints, and other products. Zinc salts burn blue-green in a flame.
• Due to its resistance to non-acidic atmospheric corrosion, zinc plays a vital role in extending the life of
buildings, vehicles, ships, and so on. The metal is mainly used as an anti-corrosion agent, and a coat of zinc
prevents rusting of galvanized steel. It also finds its use in the automobile, battery, petroleum, paint,
fungicide, rubber, and chemical industries—a few among the many industrial uses it is being put to today.
• Zinc is used in the production of brass, where it's alloyed with copper, and many other alloys. It is also used
in plating iron, due to its non-corrosive properties. Zinc is a hard metal, but becomes very malleable above
100 degrees celsius. Of all the transition metals, it has the lowest melting point after cadmium and mercury.
• China is the world's leader in the production of zinc with more than 5.1 Million MT in 2018. The country
produced approximately 34% in 2018 followed by Peru, India and Australia.
16
Major Contract Specification-Zinc Futures
Counter
Zinc
(Contracts starting from May
2020)
Zinc Mini
(Contracts valid upto May 2020)
Symbol ZINC ZINCMINI
Price Quote Rs/kg Rs/kg
P&L per 1 Rs 5000 1000
Initial Margin %
Minimum 4% or based on SPAN
whichever is higher
Minimum 4% or based on SPAN
whichever is higher
Tick Size (Rs) 0.05 0.05
Lot Size (Trading Unit) 5 MT 1 MT
Delivery Unit 5 MT 1 MT
Delivery Logic Compulsory Delivery Compulsory Delivery
Expiry Date (Contract Month) Last Day Last Day
Tender Period
Last 5 working day of expiry
month
Last 5 working day of expiry
month
Average Daily Volatility 1.50% 1.50%
Break Even Price Range (Rs.) 0.10-0.15 0.10-0.15
17
Major Contract Specifications-Zinc Option
Counter Zinc Option
Symbol ZINC
Underlying Zinc Futures
Option Type European Call & Put Options
Premium Calculation Black 76 option pricing model
Profit/Loss per 1 Rs. 5000
Tick Size (Re) 0.01
Expiry Date (Contract Month)
Three business days prior to the expiry of the underlying futures
contract
Lot Size (Trading Unit) 5 MT
Strike Intervals 2.50
Strikes
7 In-the-money, 7 Out-of-the-money and 1 Near-the-money. (15
CE and 15 PE)
18
Base Metals-Aluminium
• Aluminum is the third most abundant metal in the Earth’s crust, and the third most abundant element
overall. No other metal can compare to Aluminum when it comes to its variety of uses. Aluminum is also
theoretically 100% recyclable with no loss of its natural properties. It also takes 5% of the energy to recycle
scrap aluminum then what is used to produce new aluminum.
• According to the International Resource Panel's Metal Stocks in Society report, the global per capita stock of
aluminium in use in society (that is in cars, buildings and electronics) is 80 kg. Much of this is in more
developed countries (350 kg–500 kg per capita) rather than in less-developed countries (35 kg per capita).
Knowing the per capita stocks and their approximate lifespans is important for planning recycling. By
consumption, aluminium is next to steel.
• The People’s Republic of China has become the world’s largest producer of aluminum since long, but even
demand is growing there faster than anywhere else. China continues to be the primary driver of growth in the
aluminium industry, and e-mobility is a major factor. The reason why China matters so much to aluminum
market is simple. China consumes 40-50% of the global aluminum supply each year. Any slowdown in the
Chinese economy will make it harder to absorb the vast amount of aluminum being mined each year.
• Global demand for primary and recycled aluminium is being fuelled by the trend towards lightweight
construction in the automotive industry. The consumption of aluminium is growing in the booming aerospace
industry, while the upturn in the construction industry in continental Europe is also stimulating demand. In
addition, demand in the mechanical engineering and packaging markets continues to increase.
• China’s national environmental program to reduce CO2 emissions and increase in industrial energy efficiency
led to shutdown of multiple aluminum smelters, which declined the aluminum production in China and shot
up aluminium prices in 2018 to 7 year high at LME.
19
Base Metals-Aluminium
• China's aluminium production growth will slow down over the coming years, as the government's push for
consolidation and stricter environmental regulations brings higher-cost and less efficient capacity offline.
• Key leading players operating in this market include China Hongqiao Group Ltd. is currently the largest
aluminum producer in the world with production capacity of 7.5 MMT per year, world's second-largest
Aluminium Corporation of China Limited (CHALCO) with annual capacity of 3.7 MMT, Third largest Shandong
Xinfa (China) 3.75 MMT/anum, UC Rusal (Russia) - 3.70 MMT fourth largest, Rio Tinto (Australia) - 3.6 MMT
Fifth largest.
• The global aluminium market will see a number of deficits over the next few years as solid demand growth,
driven by the construction and autos sectors, outpaces production growth. Global aluminium market
expected to witness consistent deficits from 2019 to 2023, with the aluminium stock-to-use ratio declining
steadily from 9.6% to 5.1% over the same period.
20
Major Contract Specifications-Aluminum Futures
Counter
Aluminium
(Contracts starting from May
2020)
Aluminium Mini
(Contracts valid upto May 2020)
Symbol ALUMINIUM ALUMINI
Price Quote Rs/kg Rs/kg
P&L per 1 Rs 5000 1000
Initial Margin %
Minimum 4% or based on SPAN
whichever is higher
Minimum 4% or based on SPAN
whichever is higher
Tick Size (Rs) 0.05 0.05
Lot Size (Trading Unit) 5 MT 1 MT
Delivery Unit 5 MT 1 MT
Delivery Logic Compulsory Delivery Compulsory Delivery
Expiry Date (Contract Month) Last Day Last Day
Tender Period
Last 5 working day of expiry
month
Last 5 working day of expiry
month
Average Daily Volatility 1.50% 1.50%
Break Even Price Range (Rs.) 0.10-0.15 0.10-0.15
21
Base Metals-Lead
• Lead has been in use for thousands of years because it is easy to get from the ground and easy to shape and
work with. It was used by the Romans for pipes, drinking vessels, and fasteners. Lead is a shiny, gray-blue
metal that gets tarnished easily to a dull gray color.
• Lead is an incredibly useful metal, but it is also toxic to humans. In fact, if we didn't have to worry about
breathing in its dust or ingesting its particles, lead would be in widespread use due to its highly industry-
friendly properties, such as excellent malleability and corrosion resistance. Lead is found very rarely in the
earth's crust as a metal. Galena is the main lead ore. It is usually found in association with zinc, silver, and
copper ores. It is one of the most sustainable and recyclable commodities. It can be recycled indefinitely,
without loss of its physical or chemical properties.
• Lead is principally used for manufacturing batteries, especially the ones used in automobiles, motorcycles,
and electric cars. Its incredible density provides protection from radiation and is used in hospitals, dental
surgeries, laboratories, and nuclear installations. Lead acid batteries provide vital back-up emergency power
supply during power failures in computer installations, banks, telephone exchanges, and aircraft control
towers, among others. In earthquake-prone regions, such as Japan and California, the buildings are mounted
on lead shock absorbers that help minimize damage during tremors or earthquakes.
• Lead ores are mined at a rate close to 5 million tonnes a year, 50% of which comes from China. Top 7
countries by mine production of lead are China (2.4 Million MT), Australia (450000 MT), US (313000 MT),
Peru (300000 MT), Russia (250000 MT), Mexico (230000 MT), India (150000 MT).
22
Base Metals-Lead
• While it has a high economic value, lead is relatively economical to produce. As with all metals, there are two
main production routes. Primary production from mined lead ore is of course the original source of all lead,
but secondary production, where it is recovered from recycled products or from residues arising from the
production process is of enormous importance. Secondary lead production now accounts for more than half
of all lead produced throughout the world. In the US more than 80% of lead comes from secondary
production with Europe reporting over 60%. 98% of the lead in car batteries is recyclable.
23
Major Contract Specifications-Lead
Counter
Lead
(Contracts starting from May
2020)
Lead Mini
(Contracts valid upto May 2020)
Symbol LEAD LEADMINI
Price Quote Rs/kg Rs/kg
P&L per 1 Rs 5000 1000
Initial Margin %
Minimum 4% or based on SPAN
whichever is higher
Minimum 4% or based on SPAN
whichever is higher
Tick Size (Rs) 0.05 0.05
Lot Size (Trading Unit) 5 MT 1 MT
Delivery Unit 5 MT 1 MT
Delivery Logic Compulsory Delivery Compulsory Delivery
Expiry Date (Contract Month) Last Day Last Day
Tender Period
Last 5 working day of expiry
month
Last 5 working day of expiry
month
Average Daily Volatility 1.50% 1.50%
Break Even Price Range (Rs.) 0.10-0.15 0.10-0.15
24
Factors Affecting Base metals
• Supply-demand balance and global economic growth
• Factors affecting Chinese economy
• Growth forecasts by IMF and World Bank
• Change in stocks at LME, Shanghai Futures Exchange
• Mine production through exploration and expansion
• Strikes in Mines/Mine or plant closures/Supply disruptions
• Movement of dollar index
• Economic releases from China, US and Eurozone
• Geographical /Political factors like Flood, Earthquake, Govt. Policies, etc.
• Global financial crisis, recession or inflation
25
Base Metals Price Calculator
Particulars
Copper
(2500 Kgs)
Aluminium Mini
(1 MT)
Zinc Mini
(1 MT)
Nickel
(1500Kgs)
Lead Mini
(1 MT)
Remarks
A LME cash prices (US$/MT) 4828 1532 1898 11300 1723 Live prices
B Premium (US$/MT) 50 100 50 50 50
Estimated premium will
change from client to client
C USDINR 75.7 75.7 75.7 75.7 75.7 Live prices
D=A+
B*C
CIF Price (INR/Kg) 369.26 123.54 147.46 859.20 134.22
E Basic custom duty + Surcharge (%) 5.50% 8.25% 5.50% 0.00% 5.50%
Declared by Finance
Ministry
F=E*D
Basic custom duty + Surcharge
Value
20.31 10.19 8.11 0.00 7.38
G=F+
D
Landing cost (INR/Kg) 389.57 133.73 155.57 859.20 141.60
H
Custom clearing
cost/Transportation/Handling ect.
(Approx)
1.00% 1.00% 1.00% 1.00% 1.00% Will vary for entity to entity
I=G*H
Custom clearing
cost/Transportation/Handling ect.
(Approx) Value
3.90 1.34 1.56 8.59 1.42
Will change for enity and
quantity
J=I+G Final landed cost (INR/Kg) 393.47 135.07 157.13 867.79 143.01
Likely Landed price ex-
warehouse via various
supply sources
MCX Future on 31st March April Contract 377.50 134.50 143.20 863 132.70
MCX Spot 31st March Thane 388.30 137.6 155.15 892 141.60
26
Energy-Crude Oil
• Crude oil is a naturally occurring, unrefined petroleum product composed of hydrocarbon deposits in natural
underground pools or reservoirs and remains liquid at atmospheric pressure and temperature. Although it is
often called "black gold," crude oil has a wide ranging viscosity and can vary in color to various shades of black
and yellow depending on its hydrocarbon composition. Crude oil can be refined to produce usable products
such as gasoline, diesel and various forms of petrochemicals. Gasoline makes up 45% of crude oil.
• Even though most crude oil is produced by a relatively small number of companies, and often located in
remote locations far from the point of consumption, trading in crude oil on a global basis has always been
robust. Nearly 80% of international crude oil is transported through waterways in large tankers and most of
the rest by inland pipelines. Oil is measured in barrels, which is equal to 42 US gallons or 159 liters.
• The majority of oil reserves in the world are in the Middle East, at 48% of the known and identified reserves.
This is followed by North America, Africa, Central and South America, Eurasia, Asia and Oceania, and Europe.
The US has the 10th largest oil reserve in the world.
• OPEC is almost 40% of the world's crude oil production, and have about 75% of the world's proven oil
reserves, and exports 55% of the oil traded globally. US, Russia, Saudi Arabia produce more than 30% of total
world’s crude oil. The US is world’s largest consumer with more than 19 million bpd, 15% of global demand,
and largest producer with more than 11.3 mbpd in March 2019, making it net importer with around 8 mbpd.
The U.S. has 4% of the world’s population but uses 25% of the world’s oil. Oil consumed in the U.S. by driving
is nearly two times that consumed by drivers in China and India combined.
• The Organization of the Petroleum Exporting Countries (OPEC) is an intergovernmental organization of 14
nations, founded in 1960 in Baghdad by the first five members (Iran, Iraq, Kuwait, Saudi Arabia, and
Venezuela), and headquartered since 1965 in Vienna, Austria.
27
Energy-Crude Oil
• OPEC member countries monitor the market and decide collectively to raise or lower oil production in order
to maintain stable prices and supply. A unanimous vote is required on raising or lowering oil production. Each
member country controls the oil production of its country, but OPEC aims to coordinate the production
policies of member countries. Oil and energy ministers from OPEC member countries usually meet twice a
year to determine OPEC’s output level. They also meet in extraordinary sessions whenever required.
• External factors such as weather and political uncertainty have an influence on the price of crude oil within
the major oil producing nations. For example, severe weather can halt extraction which may lead to shortages
and ultimately higher crude prices.
• India is world's third-largest oil consumer. It imports about 86% of crude from the OPEC countries. The 23
refineries in India process 235 million metric tonnes (MMT) of crude annually or 4.7 million barrels per day
capacity.
28
Major Contract Specifications- Crude Oil Futures
Counter Crude Oil
Symbol CRUDEOIL
Price Quote Rs/bbl
P&L per 1 Rs 100
Initial Margin % Minimum 4% or based on SPAN whichever is higher.
Tick Size (Rs) 1
Lot Size
(Trading Unit)
100 barrels
Expiry Date
(Contract Month)
19th/20th
Average Daily
Volatility
1.80%
Break Even Price
Range (Rs.)
2-3
Settlement Mechanism Cash Settlement
29
Major Contract Specification- Crude Oil Option Contract
Counter Crude Oil Option
Symbol CRUDEOIL
Underlying Crude Oil Futures
Option Type European Call & Put Options
Premium Calculation Black 76 option pricing model
Profit/Loss per 1 Rs. 100
Tick Size (Re) 0.10
Expiry Date (Contract Month)
Three business days prior to the expiry of the underlying futures
contract
Lot Size (Trading Unit) 100 barrel
Strike Intervals 50.00
Strikes
7 In-the-money, 7 Out-of-the-money and 1 Near-the-money. (15
CE and 15 PE).
30
Energy-Natural Gas
• Natural gas is odourless, colourless and flammable. It is non-toxic and lighter than air; utility companies add
the smell of rotten eggs – a product called mercaptan – to make leaks easier to detect. Natural gas is thought
to have been first discovered in the Middle East between 6000 and 2000 BC when lightning strikes ignited
natural gas seeping from the ground. Gas was first used to light a UK home in 1792 by engineer William
Murdoch – it now makes up over 40% of UK electricity generation.
• Natural gas is a vital component of the world's energy supply. It is one of the cleanest, safest, and the most
useful of all energy sources. Given its growing resource base and relatively low carbon emissions compared
with other fossil fuels, natural gas is likely to play a greater role in the world energy mix.
• Natural gas is mainly used as fuel for generating electricity and heating. Natural gas prices are affected mainly
through the US demand and it's seasonal in nature wherein in winters its prices fluctuate heavily. Also they
have direct correlation with crude oil prices. It is measured in million British thermal units. One Btu is
equivalent to the heat needed to raise the temperature of one pound of water by one degree Fahrenheit. A
cubic foot of natural gas holds a lot of power, about 1,032 Btu. The world's most liquid derivative contracts for
natural gas are traded on NYMEX. Natural gas is also a major feedstock for the production of ammonia, via the
Haber process, for use in fertilizer production.
• In much of the developed world it is supplied through pipes to homes, where it is used for many purposes
including ranges and ovens, gas-heated clothes dryers, heating/cooling, and central heating. Heaters in homes
and other buildings may include boilers, furnaces, and water heaters. Both North America and Europe are
major consumers of natural gas.
• There are over 15.2 million road vehicles worldwide that run on natural gas as a fuel. The gas is used in a
compressed or liquefied state to power cars, buses, taxis, and trucks. Natural gas has had a tremendous
growth as part of the global energy mix, and today accounts for 20.3% of global primary fuel consumed.
31
Energy-Natural Gas
• Conventionally natural gas drilled out from wells vertically and horizontally. In conventional natural gas
deposits, the natural gas generally flows easily up through wells to the surface. In the United States and in a
few other countries, natural gas is produced from shale and other types of sedimentary rock formations by
forcing water, chemicals, and sand down a well under high pressure. This process, called hydraulic fracturing
or fracking, and sometimes referred to as unconventional production, breaks up the formation, releases the
natural gas from the rock, and allows the natural gas to flow to and up wells to the surface. At the top of the
well on the surface, natural gas is put into gathering pipelines and sent to natural gas processing plants.
• Gas demand has a high price-sensitivity to changes in weather. Weather pattern changes are the primary
contributor to gas price volatility. Gas prices also show a clear seasonal pattern with higher prices in fall and
winter months in response to higher demand for heating. And lower prices the spring and summer months as
demand drops.
• The United States produces most of the natural gas that it consumes. Annual US dry natural gas production
generally increased from 2005 to 2017, and US natural gas prices generally decreased during the same period
and have been less volatile since 2010.
32
Major Contract Specifications-Natural Gas Futures
Counter Natural Gas
Symbol NATURAL GAS
Price Quote Rs/mmbtu
P&L per 1 Rs 1250
Initial Margin %
Minimum 4% or based on SPAN whichever is
higher
Tick Size (Rs) 0.1
Lot Size
(Trading Unit)
1250 mmbtu
Expiry Date
(Contract Month)
25th/26th
Average Daily
Volatility
2.60%
Break Even Price
Range (Rs.)
0.20-0.30
Settlement Mechanism Cash Settled
33
Factors Affecting Energy Sector
• OPEC decisions
• Natural Calamities e.g. Flooding, Drought, Earthquake or Tsunami
• Any pipeline disruption
• Political tensions in major oil producing/consuming countries
• Weekly US Inventory releases
• Adverse weather conditions e.g. Hurricanes, Tropical Storms
• Change in Strategic Petroleum Reserves in the US
• Growth forecast by the IMF, IEA etc.
• Alternative heating options
• Geopolitical flashpoints
34
Energy Price Calculator
Crude Oil & Natural Gas Rate Calculator
Crude Oil Natural Gas
a. USD/INR Exchange rate 75.70
b. Price at NYMEX $/barrel 21.50 1.723
c. MCX Prices (a*b) Rs./barrel 1627 130.40

More Related Content

Similar to Know Your Metals and Energy Counters_Nov 19.pptx

What factors could be the growth drives and risks to the demand of grinding m...
What factors could be the growth drives and risks to the demand of grinding m...What factors could be the growth drives and risks to the demand of grinding m...
What factors could be the growth drives and risks to the demand of grinding m...恒州博智QYResearch
 
Bulk Commodity Price Index 2016 Sample
Bulk Commodity Price Index 2016 SampleBulk Commodity Price Index 2016 Sample
Bulk Commodity Price Index 2016 SampleDaejin Lee
 
Griffon Capital Newsletter October 2016
Griffon Capital Newsletter October 2016Griffon Capital Newsletter October 2016
Griffon Capital Newsletter October 2016Griffon Capital
 
Lincoln crowne copper gold report 14102013
Lincoln crowne copper gold report 14102013Lincoln crowne copper gold report 14102013
Lincoln crowne copper gold report 14102013Lincoln Crowne & Company
 
Exploration and Mining Trends in the Digital Age: Global Outlook and Issues i...
Exploration and Mining Trends in the Digital Age: Global Outlook and Issues i...Exploration and Mining Trends in the Digital Age: Global Outlook and Issues i...
Exploration and Mining Trends in the Digital Age: Global Outlook and Issues i...Tim Alch
 
Lincoln crowne copper gold weekly report 22072013
Lincoln crowne copper gold weekly report   22072013Lincoln crowne copper gold weekly report   22072013
Lincoln crowne copper gold weekly report 22072013Lincoln Crowne & Company
 
Commodities Dashboard (June)
Commodities Dashboard (June)Commodities Dashboard (June)
Commodities Dashboard (June)Mayank Prakash
 
Lincoln crowne copper gold report 30092013
Lincoln crowne copper gold report 30092013Lincoln crowne copper gold report 30092013
Lincoln crowne copper gold report 30092013Lincoln Crowne & Company
 
Lincoln crowne copper gold report 20131125
Lincoln crowne copper gold report 20131125Lincoln crowne copper gold report 20131125
Lincoln crowne copper gold report 20131125Lincoln Crowne & Company
 
Tsi coking coal information
Tsi coking coal informationTsi coking coal information
Tsi coking coal informationTim Hard
 
KGL Resources (ASX:KGL) Investor Presentation September 2014
KGL Resources (ASX:KGL) Investor Presentation September 2014KGL Resources (ASX:KGL) Investor Presentation September 2014
KGL Resources (ASX:KGL) Investor Presentation September 2014Symposium
 
Agm presentation mar 17 2011
Agm presentation mar 17 2011Agm presentation mar 17 2011
Agm presentation mar 17 2011aldridgeminerals
 
Lincoln crowne copper gold weekly report 24062013
Lincoln crowne copper gold weekly report   24062013Lincoln crowne copper gold weekly report   24062013
Lincoln crowne copper gold weekly report 24062013Lincoln Crowne & Company
 

Similar to Know Your Metals and Energy Counters_Nov 19.pptx (20)

What factors could be the growth drives and risks to the demand of grinding m...
What factors could be the growth drives and risks to the demand of grinding m...What factors could be the growth drives and risks to the demand of grinding m...
What factors could be the growth drives and risks to the demand of grinding m...
 
Cgg ppt-pdac-finalized-final
Cgg ppt-pdac-finalized-finalCgg ppt-pdac-finalized-final
Cgg ppt-pdac-finalized-final
 
Bulk Commodity Price Index 2016 Sample
Bulk Commodity Price Index 2016 SampleBulk Commodity Price Index 2016 Sample
Bulk Commodity Price Index 2016 Sample
 
Griffon Capital Newsletter October 2016
Griffon Capital Newsletter October 2016Griffon Capital Newsletter October 2016
Griffon Capital Newsletter October 2016
 
Oz Metals 20150412
Oz Metals 20150412Oz Metals 20150412
Oz Metals 20150412
 
Copper gold report 20140331
Copper gold report 20140331Copper gold report 20140331
Copper gold report 20140331
 
IRON ORE
IRON OREIRON ORE
IRON ORE
 
Lincoln crowne copper gold report 14102013
Lincoln crowne copper gold report 14102013Lincoln crowne copper gold report 14102013
Lincoln crowne copper gold report 14102013
 
Great to read weekly
Great to read weeklyGreat to read weekly
Great to read weekly
 
Exploration and Mining Trends in the Digital Age: Global Outlook and Issues i...
Exploration and Mining Trends in the Digital Age: Global Outlook and Issues i...Exploration and Mining Trends in the Digital Age: Global Outlook and Issues i...
Exploration and Mining Trends in the Digital Age: Global Outlook and Issues i...
 
Funding industrial metal projects
Funding industrial metal projectsFunding industrial metal projects
Funding industrial metal projects
 
Lincoln crowne copper gold weekly report 22072013
Lincoln crowne copper gold weekly report   22072013Lincoln crowne copper gold weekly report   22072013
Lincoln crowne copper gold weekly report 22072013
 
Commodities Dashboard (June)
Commodities Dashboard (June)Commodities Dashboard (June)
Commodities Dashboard (June)
 
Lincoln crowne copper gold report 30092013
Lincoln crowne copper gold report 30092013Lincoln crowne copper gold report 30092013
Lincoln crowne copper gold report 30092013
 
Lincoln crowne copper gold report 20131125
Lincoln crowne copper gold report 20131125Lincoln crowne copper gold report 20131125
Lincoln crowne copper gold report 20131125
 
Tsi coking coal information
Tsi coking coal informationTsi coking coal information
Tsi coking coal information
 
KGL Resources (ASX:KGL) Investor Presentation September 2014
KGL Resources (ASX:KGL) Investor Presentation September 2014KGL Resources (ASX:KGL) Investor Presentation September 2014
KGL Resources (ASX:KGL) Investor Presentation September 2014
 
Agm presentation mar 17 2011
Agm presentation mar 17 2011Agm presentation mar 17 2011
Agm presentation mar 17 2011
 
Lincoln crowne copper gold weekly report 24062013
Lincoln crowne copper gold weekly report   24062013Lincoln crowne copper gold weekly report   24062013
Lincoln crowne copper gold weekly report 24062013
 
LCC copper gold report 20140317
LCC copper gold report 20140317LCC copper gold report 20140317
LCC copper gold report 20140317
 

More from Mayank557649

suven pharma mona.pptx
suven pharma mona.pptxsuven pharma mona.pptx
suven pharma mona.pptxMayank557649
 
india mart ppt tarun.pptx
india mart ppt tarun.pptxindia mart ppt tarun.pptx
india mart ppt tarun.pptxMayank557649
 
squeezing_every_btu-slides_1.pptx
squeezing_every_btu-slides_1.pptxsqueezing_every_btu-slides_1.pptx
squeezing_every_btu-slides_1.pptxMayank557649
 
incomeexpenditureppt-120406143825-phpapp01-converted.pptx
incomeexpenditureppt-120406143825-phpapp01-converted.pptxincomeexpenditureppt-120406143825-phpapp01-converted.pptx
incomeexpenditureppt-120406143825-phpapp01-converted.pptxMayank557649
 
typesofbanks-130101042507-phpapp02-converted.pptx
typesofbanks-130101042507-phpapp02-converted.pptxtypesofbanks-130101042507-phpapp02-converted.pptx
typesofbanks-130101042507-phpapp02-converted.pptxMayank557649
 
next-steps-free-infographic-animated-16x9.pptx
next-steps-free-infographic-animated-16x9.pptxnext-steps-free-infographic-animated-16x9.pptx
next-steps-free-infographic-animated-16x9.pptxMayank557649
 
coal scame 303.pptx
coal scame 303.pptxcoal scame 303.pptx
coal scame 303.pptxMayank557649
 
BIZTANI PPT 1.pptx
BIZTANI PPT 1.pptxBIZTANI PPT 1.pptx
BIZTANI PPT 1.pptxMayank557649
 
Initial Public Offering The Process of IPO.pptx
Initial Public Offering The Process of IPO.pptxInitial Public Offering The Process of IPO.pptx
Initial Public Offering The Process of IPO.pptxMayank557649
 
RBL BANK CASE STUDY.pptx
RBL BANK CASE STUDY.pptxRBL BANK CASE STUDY.pptx
RBL BANK CASE STUDY.pptxMayank557649
 
UNIT2_PART2_PDF.pdf
UNIT2_PART2_PDF.pdfUNIT2_PART2_PDF.pdf
UNIT2_PART2_PDF.pdfMayank557649
 
Source Wikipedia (1).pdf
Source Wikipedia (1).pdfSource Wikipedia (1).pdf
Source Wikipedia (1).pdfMayank557649
 
Source Wikipedia.pdf
Source Wikipedia.pdfSource Wikipedia.pdf
Source Wikipedia.pdfMayank557649
 
CORPORATEBANKING1.pptx
CORPORATEBANKING1.pptxCORPORATEBANKING1.pptx
CORPORATEBANKING1.pptxMayank557649
 

More from Mayank557649 (17)

suven pharma mona.pptx
suven pharma mona.pptxsuven pharma mona.pptx
suven pharma mona.pptx
 
Earning ratio
Earning ratioEarning ratio
Earning ratio
 
Elasticity.pptx
Elasticity.pptxElasticity.pptx
Elasticity.pptx
 
india mart ppt tarun.pptx
india mart ppt tarun.pptxindia mart ppt tarun.pptx
india mart ppt tarun.pptx
 
squeezing_every_btu-slides_1.pptx
squeezing_every_btu-slides_1.pptxsqueezing_every_btu-slides_1.pptx
squeezing_every_btu-slides_1.pptx
 
incomeexpenditureppt-120406143825-phpapp01-converted.pptx
incomeexpenditureppt-120406143825-phpapp01-converted.pptxincomeexpenditureppt-120406143825-phpapp01-converted.pptx
incomeexpenditureppt-120406143825-phpapp01-converted.pptx
 
typesofbanks-130101042507-phpapp02-converted.pptx
typesofbanks-130101042507-phpapp02-converted.pptxtypesofbanks-130101042507-phpapp02-converted.pptx
typesofbanks-130101042507-phpapp02-converted.pptx
 
next-steps-free-infographic-animated-16x9.pptx
next-steps-free-infographic-animated-16x9.pptxnext-steps-free-infographic-animated-16x9.pptx
next-steps-free-infographic-animated-16x9.pptx
 
coal scame 303.pptx
coal scame 303.pptxcoal scame 303.pptx
coal scame 303.pptx
 
BIZTANI PPT 1.pptx
BIZTANI PPT 1.pptxBIZTANI PPT 1.pptx
BIZTANI PPT 1.pptx
 
Initial Public Offering The Process of IPO.pptx
Initial Public Offering The Process of IPO.pptxInitial Public Offering The Process of IPO.pptx
Initial Public Offering The Process of IPO.pptx
 
RBL BANK CASE STUDY.pptx
RBL BANK CASE STUDY.pptxRBL BANK CASE STUDY.pptx
RBL BANK CASE STUDY.pptx
 
kanishka.pptx
kanishka.pptxkanishka.pptx
kanishka.pptx
 
UNIT2_PART2_PDF.pdf
UNIT2_PART2_PDF.pdfUNIT2_PART2_PDF.pdf
UNIT2_PART2_PDF.pdf
 
Source Wikipedia (1).pdf
Source Wikipedia (1).pdfSource Wikipedia (1).pdf
Source Wikipedia (1).pdf
 
Source Wikipedia.pdf
Source Wikipedia.pdfSource Wikipedia.pdf
Source Wikipedia.pdf
 
CORPORATEBANKING1.pptx
CORPORATEBANKING1.pptxCORPORATEBANKING1.pptx
CORPORATEBANKING1.pptx
 

Recently uploaded

Spellings Wk 4 and Wk 5 for Grade 4 at CAPS
Spellings Wk 4 and Wk 5 for Grade 4 at CAPSSpellings Wk 4 and Wk 5 for Grade 4 at CAPS
Spellings Wk 4 and Wk 5 for Grade 4 at CAPSAnaAcapella
 
Improved Approval Flow in Odoo 17 Studio App
Improved Approval Flow in Odoo 17 Studio AppImproved Approval Flow in Odoo 17 Studio App
Improved Approval Flow in Odoo 17 Studio AppCeline George
 
Spring gala 2024 photo slideshow - Celebrating School-Community Partnerships
Spring gala 2024 photo slideshow - Celebrating School-Community PartnershipsSpring gala 2024 photo slideshow - Celebrating School-Community Partnerships
Spring gala 2024 photo slideshow - Celebrating School-Community Partnershipsexpandedwebsite
 
How to Send Pro Forma Invoice to Your Customers in Odoo 17
How to Send Pro Forma Invoice to Your Customers in Odoo 17How to Send Pro Forma Invoice to Your Customers in Odoo 17
How to Send Pro Forma Invoice to Your Customers in Odoo 17Celine George
 
Book Review of Run For Your Life Powerpoint
Book Review of Run For Your Life PowerpointBook Review of Run For Your Life Powerpoint
Book Review of Run For Your Life Powerpoint23600690
 
Analyzing and resolving a communication crisis in Dhaka textiles LTD.pptx
Analyzing and resolving a communication crisis in Dhaka textiles LTD.pptxAnalyzing and resolving a communication crisis in Dhaka textiles LTD.pptx
Analyzing and resolving a communication crisis in Dhaka textiles LTD.pptxLimon Prince
 
PSYPACT- Practicing Over State Lines May 2024.pptx
PSYPACT- Practicing Over State Lines May 2024.pptxPSYPACT- Practicing Over State Lines May 2024.pptx
PSYPACT- Practicing Over State Lines May 2024.pptxMarlene Maheu
 
How to Manage Website in Odoo 17 Studio App.pptx
How to Manage Website in Odoo 17 Studio App.pptxHow to Manage Website in Odoo 17 Studio App.pptx
How to Manage Website in Odoo 17 Studio App.pptxCeline George
 
TỔNG HỢP HƠN 100 ĐỀ THI THỬ TỐT NGHIỆP THPT TOÁN 2024 - TỪ CÁC TRƯỜNG, TRƯỜNG...
TỔNG HỢP HƠN 100 ĐỀ THI THỬ TỐT NGHIỆP THPT TOÁN 2024 - TỪ CÁC TRƯỜNG, TRƯỜNG...TỔNG HỢP HƠN 100 ĐỀ THI THỬ TỐT NGHIỆP THPT TOÁN 2024 - TỪ CÁC TRƯỜNG, TRƯỜNG...
TỔNG HỢP HƠN 100 ĐỀ THI THỬ TỐT NGHIỆP THPT TOÁN 2024 - TỪ CÁC TRƯỜNG, TRƯỜNG...Nguyen Thanh Tu Collection
 
Trauma-Informed Leadership - Five Practical Principles
Trauma-Informed Leadership - Five Practical PrinciplesTrauma-Informed Leadership - Five Practical Principles
Trauma-Informed Leadership - Five Practical PrinciplesPooky Knightsmith
 
Observing-Correct-Grammar-in-Making-Definitions.pptx
Observing-Correct-Grammar-in-Making-Definitions.pptxObserving-Correct-Grammar-in-Making-Definitions.pptx
Observing-Correct-Grammar-in-Making-Definitions.pptxAdelaideRefugio
 
When Quality Assurance Meets Innovation in Higher Education - Report launch w...
When Quality Assurance Meets Innovation in Higher Education - Report launch w...When Quality Assurance Meets Innovation in Higher Education - Report launch w...
When Quality Assurance Meets Innovation in Higher Education - Report launch w...Gary Wood
 
TỔNG HỢP HƠN 100 ĐỀ THI THỬ TỐT NGHIỆP THPT TOÁN 2024 - TỪ CÁC TRƯỜNG, TRƯỜNG...
TỔNG HỢP HƠN 100 ĐỀ THI THỬ TỐT NGHIỆP THPT TOÁN 2024 - TỪ CÁC TRƯỜNG, TRƯỜNG...TỔNG HỢP HƠN 100 ĐỀ THI THỬ TỐT NGHIỆP THPT TOÁN 2024 - TỪ CÁC TRƯỜNG, TRƯỜNG...
TỔNG HỢP HƠN 100 ĐỀ THI THỬ TỐT NGHIỆP THPT TOÁN 2024 - TỪ CÁC TRƯỜNG, TRƯỜNG...Nguyen Thanh Tu Collection
 
Graduate Outcomes Presentation Slides - English (v3).pptx
Graduate Outcomes Presentation Slides - English (v3).pptxGraduate Outcomes Presentation Slides - English (v3).pptx
Graduate Outcomes Presentation Slides - English (v3).pptxneillewis46
 
How To Create Editable Tree View in Odoo 17
How To Create Editable Tree View in Odoo 17How To Create Editable Tree View in Odoo 17
How To Create Editable Tree View in Odoo 17Celine George
 
diagnosting testing bsc 2nd sem.pptx....
diagnosting testing bsc 2nd sem.pptx....diagnosting testing bsc 2nd sem.pptx....
diagnosting testing bsc 2nd sem.pptx....Ritu480198
 
An Overview of the Odoo 17 Knowledge App
An Overview of the Odoo 17 Knowledge AppAn Overview of the Odoo 17 Knowledge App
An Overview of the Odoo 17 Knowledge AppCeline George
 
SURVEY I created for uni project research
SURVEY I created for uni project researchSURVEY I created for uni project research
SURVEY I created for uni project researchCaitlinCummins3
 

Recently uploaded (20)

Mattingly "AI & Prompt Design: Named Entity Recognition"
Mattingly "AI & Prompt Design: Named Entity Recognition"Mattingly "AI & Prompt Design: Named Entity Recognition"
Mattingly "AI & Prompt Design: Named Entity Recognition"
 
Spellings Wk 4 and Wk 5 for Grade 4 at CAPS
Spellings Wk 4 and Wk 5 for Grade 4 at CAPSSpellings Wk 4 and Wk 5 for Grade 4 at CAPS
Spellings Wk 4 and Wk 5 for Grade 4 at CAPS
 
Improved Approval Flow in Odoo 17 Studio App
Improved Approval Flow in Odoo 17 Studio AppImproved Approval Flow in Odoo 17 Studio App
Improved Approval Flow in Odoo 17 Studio App
 
VAMOS CUIDAR DO NOSSO PLANETA! .
VAMOS CUIDAR DO NOSSO PLANETA!                    .VAMOS CUIDAR DO NOSSO PLANETA!                    .
VAMOS CUIDAR DO NOSSO PLANETA! .
 
Spring gala 2024 photo slideshow - Celebrating School-Community Partnerships
Spring gala 2024 photo slideshow - Celebrating School-Community PartnershipsSpring gala 2024 photo slideshow - Celebrating School-Community Partnerships
Spring gala 2024 photo slideshow - Celebrating School-Community Partnerships
 
How to Send Pro Forma Invoice to Your Customers in Odoo 17
How to Send Pro Forma Invoice to Your Customers in Odoo 17How to Send Pro Forma Invoice to Your Customers in Odoo 17
How to Send Pro Forma Invoice to Your Customers in Odoo 17
 
Book Review of Run For Your Life Powerpoint
Book Review of Run For Your Life PowerpointBook Review of Run For Your Life Powerpoint
Book Review of Run For Your Life Powerpoint
 
Analyzing and resolving a communication crisis in Dhaka textiles LTD.pptx
Analyzing and resolving a communication crisis in Dhaka textiles LTD.pptxAnalyzing and resolving a communication crisis in Dhaka textiles LTD.pptx
Analyzing and resolving a communication crisis in Dhaka textiles LTD.pptx
 
PSYPACT- Practicing Over State Lines May 2024.pptx
PSYPACT- Practicing Over State Lines May 2024.pptxPSYPACT- Practicing Over State Lines May 2024.pptx
PSYPACT- Practicing Over State Lines May 2024.pptx
 
How to Manage Website in Odoo 17 Studio App.pptx
How to Manage Website in Odoo 17 Studio App.pptxHow to Manage Website in Odoo 17 Studio App.pptx
How to Manage Website in Odoo 17 Studio App.pptx
 
TỔNG HỢP HƠN 100 ĐỀ THI THỬ TỐT NGHIỆP THPT TOÁN 2024 - TỪ CÁC TRƯỜNG, TRƯỜNG...
TỔNG HỢP HƠN 100 ĐỀ THI THỬ TỐT NGHIỆP THPT TOÁN 2024 - TỪ CÁC TRƯỜNG, TRƯỜNG...TỔNG HỢP HƠN 100 ĐỀ THI THỬ TỐT NGHIỆP THPT TOÁN 2024 - TỪ CÁC TRƯỜNG, TRƯỜNG...
TỔNG HỢP HƠN 100 ĐỀ THI THỬ TỐT NGHIỆP THPT TOÁN 2024 - TỪ CÁC TRƯỜNG, TRƯỜNG...
 
Trauma-Informed Leadership - Five Practical Principles
Trauma-Informed Leadership - Five Practical PrinciplesTrauma-Informed Leadership - Five Practical Principles
Trauma-Informed Leadership - Five Practical Principles
 
Observing-Correct-Grammar-in-Making-Definitions.pptx
Observing-Correct-Grammar-in-Making-Definitions.pptxObserving-Correct-Grammar-in-Making-Definitions.pptx
Observing-Correct-Grammar-in-Making-Definitions.pptx
 
When Quality Assurance Meets Innovation in Higher Education - Report launch w...
When Quality Assurance Meets Innovation in Higher Education - Report launch w...When Quality Assurance Meets Innovation in Higher Education - Report launch w...
When Quality Assurance Meets Innovation in Higher Education - Report launch w...
 
TỔNG HỢP HƠN 100 ĐỀ THI THỬ TỐT NGHIỆP THPT TOÁN 2024 - TỪ CÁC TRƯỜNG, TRƯỜNG...
TỔNG HỢP HƠN 100 ĐỀ THI THỬ TỐT NGHIỆP THPT TOÁN 2024 - TỪ CÁC TRƯỜNG, TRƯỜNG...TỔNG HỢP HƠN 100 ĐỀ THI THỬ TỐT NGHIỆP THPT TOÁN 2024 - TỪ CÁC TRƯỜNG, TRƯỜNG...
TỔNG HỢP HƠN 100 ĐỀ THI THỬ TỐT NGHIỆP THPT TOÁN 2024 - TỪ CÁC TRƯỜNG, TRƯỜNG...
 
Graduate Outcomes Presentation Slides - English (v3).pptx
Graduate Outcomes Presentation Slides - English (v3).pptxGraduate Outcomes Presentation Slides - English (v3).pptx
Graduate Outcomes Presentation Slides - English (v3).pptx
 
How To Create Editable Tree View in Odoo 17
How To Create Editable Tree View in Odoo 17How To Create Editable Tree View in Odoo 17
How To Create Editable Tree View in Odoo 17
 
diagnosting testing bsc 2nd sem.pptx....
diagnosting testing bsc 2nd sem.pptx....diagnosting testing bsc 2nd sem.pptx....
diagnosting testing bsc 2nd sem.pptx....
 
An Overview of the Odoo 17 Knowledge App
An Overview of the Odoo 17 Knowledge AppAn Overview of the Odoo 17 Knowledge App
An Overview of the Odoo 17 Knowledge App
 
SURVEY I created for uni project research
SURVEY I created for uni project researchSURVEY I created for uni project research
SURVEY I created for uni project research
 

Know Your Metals and Energy Counters_Nov 19.pptx

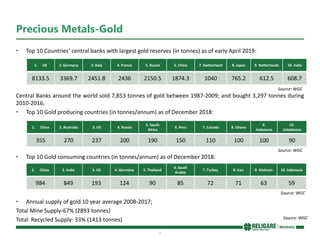
  • 1. 1 Precious Metals-Gold • Top 10 Countries’ central banks with largest gold reserves (in tonnes) as of early April 2019: Central Banks around the world sold 7,853 tonnes of gold between 1987-2009; and bought 3,297 tonnes during 2010-2016. • Top 10 Gold producing countries (in tonnes/annum) as of December 2018: • Top 10 Gold consuming countries (in tonnes/annum) as of December 2018: • Annual supply of gold 10 year average 2008-2017; Total Mine Supply-67% (2893 tonnes) Total Recycled Supply- 33% (1413 tonnes) 1. US 2. Germany 3. Italy 4. France 5. Russia 6. China 7. Switzerland 8. Japan 9. Netherlands 10. India 8133.5 3369.7 2451.8 2436 2150.5 1874.3 1040 765.2 612.5 608.7 Source: WGC 1. China 2. Australia 3. US 4. Russia 5. South Africa 6. Peru 7. Canada 8. Ghana 9. Indonesia 10. Uzbekistan 355 270 237 200 190 150 110 100 100 90 Source: WGC 1. China 2. India 3. US 4. Germany 5. Thailand 6. Saudi Arabia 7. Turkey 8. Iran 9. Vietnam 10. Indonesia 984 849 193 124 90 85 72 71 63 59 Source: WGC Source: WGC
  • 2. 2 Major Contract Specifications- Gold Futures Counter Gold Gold Mini Gold Guinea Gold Petal Symbol GOLD GOLDM GOLDGUINEA GOLDPETAL Price Quote Rs/10 gms Rs/10 gms Rs/8 gms Rs/gm P&L per 1 Rs 100 10 8 1 Initial Margin % Minimum 4% or based on SPAN whichever is higher Minimum 4% or based on SPAN whichever is higher Minimum 4% or based on SPAN whichever is higher Minimum 4% or based on SPAN whichever is higher Tick Size (Rs) 1 1 1 1 Lot Size (Trading Unit) 1 kg 100 gms 8 gms 1 gm Delivery Unit 1 kg 100 gms 8 gms 1 gm Delivery Logic Compulsory Compulsory Compulsory Compulsory Expiry Date (Contract Month) 5th Day 5th Day Last Day Last Day Average Daily Volatility 0.67% 0.67% 0.70% 0.66% Break Even Price Range (Rs.) 17-18 17-18 17-18 17-18
  • 3. 3 Major Contract Specifications-Gold Option Contract Counter Gold Option Symbol GOLD Underlying Gold Futures Option Type European Call & Put Options Premium Calculation Black 76 option pricing model Profit/Loss per 1 Rs. 100 Tick Size (Re) 0.50 Expiry Date (Contract Month) Three business days prior to the expiry of the underlying futures contract Lot Size (Trading Unit) 1 Kg Strike Intervals 100.00 Strikes 15 In-the-money, 15 Out-of-the-money and 1 Near-the money. (31 CE and 31 PE).
  • 4. 4 Precious Metals-Silver • Silver is a brilliant grey-white metal that is soft and malleable. The principal sources of silver are the ores of silver, silver-nickel, lead, and lead-zinc obtained from Peru, Bolivia, Mexico, China, Australia, Chile, Poland, and Serbia. Just over half of the mined silver comes from Mexico, Peru, China, and Australia, the four largest producing countries. • Primary mines produce about one-third of the world’s silver, while around two-third comes as a by-product of gold, copper, lead, and zinc mining. • Silver has innumerable applications in art, science, industry and beyond. At the highest level, though, demand for silver breaks down into three important categories: silver in industry, investment, silver jewellery and décor. Together, these three areas represent more than 95% of the annual silver demand. • With its unique properties, including its strength, malleability, and ductility; its electrical and thermal conductivity; its sensitivity to and high reflectance of light; and the ability to endure extreme temperature; it is an element without substitution. Commercial-grade fine silver is at least 99.9% pure, and purities greater than 99.999% are available.
  • 5. 5 Major Contract Specification-Silver Futures Counter Silver Silver Mini Silver Micro Symbol SILVER SILVERM SILVERMIC Price Quote Rs/kg Rs/kg Rs/kg P&L per 1 Rs 30 5 1 Initial Margin % Minimum 4% or based on SPAN whichever is higher Minimum 4% or based on SPAN whichever is higher Minimum 4% or based on SPAN whichever is higher Tick Size (Rs) 1 1 1 Lot Size (Trading Unit) 30 kg 5 kg 1 kg Delivery Unit 30 kg 30 kg 30 kg Delivery Logic Compulsory Both Option Both Option Expiry Date (Contract Month) 5th Day Last Day Last Day Average Daily Volatility 1.10% 1.10% 1.10% Break Even Price Range (Rs.) 18-22 18-22 18-22
  • 6. 6 Major Contract Specification-Silver Option Contract Counter Silver Option Symbol SILVER Underlying Silver Futures Option Type European Call & Put Options Premium Calculation Black 76 option pricing model Profit/Loss per 1 Rs. 30 Tick Size (Re) 0.5 Expiry Date (Contract Month) Three business days prior to the expiry of the underlying futures contract Lot Size (Trading Unit) 30 Kg Strike Intervals 250 Strikes 10 In-the-money, 10 Out-of-the-money and 1 Near-the-money. (21 CE and 21 PE).
  • 7. 7 Factors Affecting Precious Metals • FOMC Meeting, FED/ECB policies and decisions • Fundamental factors (economic releases) • Local currency movement • Central bank's gold buying and selling • Jewelry demand from top consuming nations • Monetary easing/tightening by central banks • Political instability • Credit Ratings for a specific country • Debt/GDP ratio of major economies like the US, Europe etc • Global macro environment • Investment demand (physical or ETF)
  • 8. 8 Bullion Calculator Gold & Silver Rate Calculator Gold(995) Silver (995) a. USD/INR Exchange rate 75.70 b. International Price $/oz 1598.00 13.95 c. CIP (Insurance) Premium $/oz 1.00 0.75 d. Import Price (b+c) $/oz 1599.00 14.70 e. Fineness 0.995 0.995 f. Price in $ ((d*10)/31.1507*0.995) per 10gms 494.86 4.36 g. Price in Rs (a*f) per 10gms 37460.80 330.11 h. Import Duty (12.5% of g) 3746.08 33.01 i. Import Value (g+h) per 10gms 41206.87 363.12 j. Other Charges (GST) @3% of i 1123.82 9.90 k. Rate (in Rs per 10gm) (i+j) 42331 373.02 l. Rate (in Rs per 1 Kg) (k*100) 37302 m. Cost of carry per day ((5.15/365)*n) 1.03 0.51 Days remaining to expiry 60 30 n. Total Cost of Carry 434.90 15.41 o. MCX Rate 42766 37318
  • 9. 9 Base Metals-Copper • In world’s metal consumption, copper ranks third after steel and aluminium. It is a product whose fortunes directly reflect the state of the world's economy, hence also dubbed as Dr. Copper. • Copper, the best non-precious metal conductor of electricity, has exceptional strength, ductility, and resistance to creeping and corrosion to make it the preferred and safest conductor of electrical wiring in buildings. Economic, technological, and societal factors influence the supply and demand of copper. Land- based resources are estimated at 1.6 billion tonnes of copper, and resources in deep-sea nodules are estimated at 0.7 billion tonnes. Worldwide, approximately one-third of all copper consumed is recycled. • Copper is produced in more than 25 countries today. Because of global dispersion of copper production, the risk of disruption in global supplies is low. On the other hand, because of its importance in construction and power transmission, any disruption in supplies will have a major effect on the economy. • Producers, exporters, marketers, processors, and SMEs with exposure to copper can manage their price risks by hedging. When uncertainty looms large, modern risk management techniques and strategies, including market-based risk management financial instruments like ‘Copper Futures’, offered on the MCX platform can improve efficiencies and consolidate competitiveness through price risk management. The importance of risk management thus cannot be overstated. • Commodity-specific events, such as the construction of new production facilities or processes, new uses or the discontinuance of historical uses, unexpected mine or plant closures (natural disaster, supply disruption, accident, strike, and so forth), or industry restructuring—all affect the price of the metal.
  • 10. 10 Base Metals-Copper • Total global copper production from mines amounted to an estimated 21 million metric tons in 2018. Major producing countries include Chile, Peru, and China. Chile mines produced nearly 5.8 million metric tons in 2018, which is one third of the world’s copper, and is also by far the country with the largest copper reserves. • The second top producer is China, though the copper mining industry here is nowhere near the production capacity of Chile. Copper production in China reaches 1,760,000 tonnes per year in 2018. This country is the largest consumer of copper, consuming almost one third of global copper supply. • Global copper consumption is steadily increasing, and currently stands at some 23.8 million metric tons. Forecasts for global copper demand show the same trend. Thus, prices have also increased rapidly over the last decade, reaching a record high in 2011. To meet these developments, the use of copper scrap for recycling purposes is now relatively high. Global production of refined secondary copper stood at approximately 3.87 million metric tons as of 2018. • India has long been upheld as the next “China”, with the capability to rival the latter’s demand growth based on the size of its population and clear need for power and transport infrastructure. Although Indian copper demand is forecast to increase rapidly (at more than 9.5 per cent per annum), its consumption in volume terms is small, limiting its impact on the global picture.
  • 11. 11 Major Contract Specification-Copper Futures Counter Copper Symbol COPPER Price Quote Rs/kg P&L per 1 Rs 2500 Initial Margin % Minimum 4% or based on SPAN whichever is higher Tick Size (Rs) 0.05 Lot Size (Trading Unit) 2.5 MT Delivery Unit 2.5 MT Delivery Logic Compulsory Expiry Date (Contract Month) Last Day Tender Period Last 5 working days of expiry month Average Daily Volatility 1.15% Break Even Price Range (Rs.) 0.20-0.30
  • 12. 12 Major Contract Specification-Copper Option Contract Counter Copper Option Symbol COPPER Underlying Copper Futures Option Type European Call & Put Options Premium Calculation Black 76 option pricing model Profit/Loss per 1 Rs. 2500 Tick Size (Re) 0.01 Expiry Date (Contract Month) Three business days prior to the expiry of the underlying futures contract Lot Size (Trading Unit) 2.5 MT Strike Intervals 5.00 Strikes 7 In-the-money, 7 Out-of-the-money and 1 Near-the-money. (15 CE and 15 PE).
  • 13. 13 Base Metals-Nickel • Nickel is a naturally occurring, lustrous, silvery-white metal. It is the fifth most common element on earth and occurs extensively in the earth's crust. However, most of the nickel is inaccessible in the core of the earth. • Nickel is preeminently an alloy metal, and its chief use is in nickel steels and nickel cast irons, in which it typically increases the tensile strength, toughness, and elastic limit. It is widely used in many other alloys, including nickel brasses and bronzes and alloys with copper, chromium, aluminium, lead, cobalt and silver. • Some of the key characteristics of nickel are its high melting point, resistance against corrosion and oxidation, ductility. Others are catalytic properties, ease of deposit by electroplating and formation of alloys readily. Nickel plays an important role in our daily lives, making its way in myriad objects around us like food preparation equipment, mobile phones, medical equipment, transport, buildings, and power generation— the list is almost endless. • About 65% of the nickel produced is used to manufacture stainless steel. Another 20% is used in other steel and non-ferrous alloys, often for highly specialized industrial, aerospace, and military applications. About 9% is used in plating and 6% for other uses, including coins, electronics, batteries for portable equipment, and hybrid cars. In many of these applications, there is no substitute for nickel without impairing performance or increasing cost. • China is the largest consumer of nickel globally utilizing 50.4% of global production, followed by the US and Japan. Currently, there are about 23 major countries which produce nickel for large-scale commercial use; these include Russia, Canada, Indonesia, and South Africa. Technology continues to improve daily and this will ultimately create more uses for nickel, and this is where more sustainable methods of extraction, as well as alternative metals and alloys, will be used to ensure the global supply of nickel does not run out.
  • 14. 14 Major Contract Specification-Nickel Futures Counter Nickel Symbol NICKEL Price Quote Rs/kg P&L per 1 Rs 250 Initial Margin % Minimum 5% or based on SPAN whichever is higher Tick Size (Rs) 0.1 Lot Size (Trading Unit) 1500 Kg from Dec Delivery Unit 1.5 MT Delivery Logic Compulsory Delivery Expiry Date (Contract Month) Last Day Tender Period Last 5 working day of expiry month Average Daily Volatility 1.80% Break Even Price Range (Rs.) 0.40-0.50
  • 15. 15 Base Metals-Zinc • Zinc is the fourth most widely used metal in the world after steel, aluminium, and copper. Zinc occurs naturally in the earth's crust and is the 24th most abundant element, with about 1.9 billion tonnes of identified resources. About 70% of the world's zinc originates from mining, whereas the remaining 30% comes from recycling secondary zinc. • It is an essential trace element and necessary for plants, animals, and microorganisms. However, high levels of zinc exposure through inhalation, ingestion, and dermal contact could cause adverse health effects. Of more than 13 million tons of the metal produced annually, about half of it is used for galvanization. Brass and bronze production accounts for another 17% of zinc's use. Zinc, its oxide, and other compounds are found in batteries, sunscreen, paints, and other products. Zinc salts burn blue-green in a flame. • Due to its resistance to non-acidic atmospheric corrosion, zinc plays a vital role in extending the life of buildings, vehicles, ships, and so on. The metal is mainly used as an anti-corrosion agent, and a coat of zinc prevents rusting of galvanized steel. It also finds its use in the automobile, battery, petroleum, paint, fungicide, rubber, and chemical industries—a few among the many industrial uses it is being put to today. • Zinc is used in the production of brass, where it's alloyed with copper, and many other alloys. It is also used in plating iron, due to its non-corrosive properties. Zinc is a hard metal, but becomes very malleable above 100 degrees celsius. Of all the transition metals, it has the lowest melting point after cadmium and mercury. • China is the world's leader in the production of zinc with more than 5.1 Million MT in 2018. The country produced approximately 34% in 2018 followed by Peru, India and Australia.
  • 16. 16 Major Contract Specification-Zinc Futures Counter Zinc (Contracts starting from May 2020) Zinc Mini (Contracts valid upto May 2020) Symbol ZINC ZINCMINI Price Quote Rs/kg Rs/kg P&L per 1 Rs 5000 1000 Initial Margin % Minimum 4% or based on SPAN whichever is higher Minimum 4% or based on SPAN whichever is higher Tick Size (Rs) 0.05 0.05 Lot Size (Trading Unit) 5 MT 1 MT Delivery Unit 5 MT 1 MT Delivery Logic Compulsory Delivery Compulsory Delivery Expiry Date (Contract Month) Last Day Last Day Tender Period Last 5 working day of expiry month Last 5 working day of expiry month Average Daily Volatility 1.50% 1.50% Break Even Price Range (Rs.) 0.10-0.15 0.10-0.15
  • 17. 17 Major Contract Specifications-Zinc Option Counter Zinc Option Symbol ZINC Underlying Zinc Futures Option Type European Call & Put Options Premium Calculation Black 76 option pricing model Profit/Loss per 1 Rs. 5000 Tick Size (Re) 0.01 Expiry Date (Contract Month) Three business days prior to the expiry of the underlying futures contract Lot Size (Trading Unit) 5 MT Strike Intervals 2.50 Strikes 7 In-the-money, 7 Out-of-the-money and 1 Near-the-money. (15 CE and 15 PE)
  • 18. 18 Base Metals-Aluminium • Aluminum is the third most abundant metal in the Earth’s crust, and the third most abundant element overall. No other metal can compare to Aluminum when it comes to its variety of uses. Aluminum is also theoretically 100% recyclable with no loss of its natural properties. It also takes 5% of the energy to recycle scrap aluminum then what is used to produce new aluminum. • According to the International Resource Panel's Metal Stocks in Society report, the global per capita stock of aluminium in use in society (that is in cars, buildings and electronics) is 80 kg. Much of this is in more developed countries (350 kg–500 kg per capita) rather than in less-developed countries (35 kg per capita). Knowing the per capita stocks and their approximate lifespans is important for planning recycling. By consumption, aluminium is next to steel. • The People’s Republic of China has become the world’s largest producer of aluminum since long, but even demand is growing there faster than anywhere else. China continues to be the primary driver of growth in the aluminium industry, and e-mobility is a major factor. The reason why China matters so much to aluminum market is simple. China consumes 40-50% of the global aluminum supply each year. Any slowdown in the Chinese economy will make it harder to absorb the vast amount of aluminum being mined each year. • Global demand for primary and recycled aluminium is being fuelled by the trend towards lightweight construction in the automotive industry. The consumption of aluminium is growing in the booming aerospace industry, while the upturn in the construction industry in continental Europe is also stimulating demand. In addition, demand in the mechanical engineering and packaging markets continues to increase. • China’s national environmental program to reduce CO2 emissions and increase in industrial energy efficiency led to shutdown of multiple aluminum smelters, which declined the aluminum production in China and shot up aluminium prices in 2018 to 7 year high at LME.
  • 19. 19 Base Metals-Aluminium • China's aluminium production growth will slow down over the coming years, as the government's push for consolidation and stricter environmental regulations brings higher-cost and less efficient capacity offline. • Key leading players operating in this market include China Hongqiao Group Ltd. is currently the largest aluminum producer in the world with production capacity of 7.5 MMT per year, world's second-largest Aluminium Corporation of China Limited (CHALCO) with annual capacity of 3.7 MMT, Third largest Shandong Xinfa (China) 3.75 MMT/anum, UC Rusal (Russia) - 3.70 MMT fourth largest, Rio Tinto (Australia) - 3.6 MMT Fifth largest. • The global aluminium market will see a number of deficits over the next few years as solid demand growth, driven by the construction and autos sectors, outpaces production growth. Global aluminium market expected to witness consistent deficits from 2019 to 2023, with the aluminium stock-to-use ratio declining steadily from 9.6% to 5.1% over the same period.
  • 20. 20 Major Contract Specifications-Aluminum Futures Counter Aluminium (Contracts starting from May 2020) Aluminium Mini (Contracts valid upto May 2020) Symbol ALUMINIUM ALUMINI Price Quote Rs/kg Rs/kg P&L per 1 Rs 5000 1000 Initial Margin % Minimum 4% or based on SPAN whichever is higher Minimum 4% or based on SPAN whichever is higher Tick Size (Rs) 0.05 0.05 Lot Size (Trading Unit) 5 MT 1 MT Delivery Unit 5 MT 1 MT Delivery Logic Compulsory Delivery Compulsory Delivery Expiry Date (Contract Month) Last Day Last Day Tender Period Last 5 working day of expiry month Last 5 working day of expiry month Average Daily Volatility 1.50% 1.50% Break Even Price Range (Rs.) 0.10-0.15 0.10-0.15
  • 21. 21 Base Metals-Lead • Lead has been in use for thousands of years because it is easy to get from the ground and easy to shape and work with. It was used by the Romans for pipes, drinking vessels, and fasteners. Lead is a shiny, gray-blue metal that gets tarnished easily to a dull gray color. • Lead is an incredibly useful metal, but it is also toxic to humans. In fact, if we didn't have to worry about breathing in its dust or ingesting its particles, lead would be in widespread use due to its highly industry- friendly properties, such as excellent malleability and corrosion resistance. Lead is found very rarely in the earth's crust as a metal. Galena is the main lead ore. It is usually found in association with zinc, silver, and copper ores. It is one of the most sustainable and recyclable commodities. It can be recycled indefinitely, without loss of its physical or chemical properties. • Lead is principally used for manufacturing batteries, especially the ones used in automobiles, motorcycles, and electric cars. Its incredible density provides protection from radiation and is used in hospitals, dental surgeries, laboratories, and nuclear installations. Lead acid batteries provide vital back-up emergency power supply during power failures in computer installations, banks, telephone exchanges, and aircraft control towers, among others. In earthquake-prone regions, such as Japan and California, the buildings are mounted on lead shock absorbers that help minimize damage during tremors or earthquakes. • Lead ores are mined at a rate close to 5 million tonnes a year, 50% of which comes from China. Top 7 countries by mine production of lead are China (2.4 Million MT), Australia (450000 MT), US (313000 MT), Peru (300000 MT), Russia (250000 MT), Mexico (230000 MT), India (150000 MT).
  • 22. 22 Base Metals-Lead • While it has a high economic value, lead is relatively economical to produce. As with all metals, there are two main production routes. Primary production from mined lead ore is of course the original source of all lead, but secondary production, where it is recovered from recycled products or from residues arising from the production process is of enormous importance. Secondary lead production now accounts for more than half of all lead produced throughout the world. In the US more than 80% of lead comes from secondary production with Europe reporting over 60%. 98% of the lead in car batteries is recyclable.
  • 23. 23 Major Contract Specifications-Lead Counter Lead (Contracts starting from May 2020) Lead Mini (Contracts valid upto May 2020) Symbol LEAD LEADMINI Price Quote Rs/kg Rs/kg P&L per 1 Rs 5000 1000 Initial Margin % Minimum 4% or based on SPAN whichever is higher Minimum 4% or based on SPAN whichever is higher Tick Size (Rs) 0.05 0.05 Lot Size (Trading Unit) 5 MT 1 MT Delivery Unit 5 MT 1 MT Delivery Logic Compulsory Delivery Compulsory Delivery Expiry Date (Contract Month) Last Day Last Day Tender Period Last 5 working day of expiry month Last 5 working day of expiry month Average Daily Volatility 1.50% 1.50% Break Even Price Range (Rs.) 0.10-0.15 0.10-0.15
  • 24. 24 Factors Affecting Base metals • Supply-demand balance and global economic growth • Factors affecting Chinese economy • Growth forecasts by IMF and World Bank • Change in stocks at LME, Shanghai Futures Exchange • Mine production through exploration and expansion • Strikes in Mines/Mine or plant closures/Supply disruptions • Movement of dollar index • Economic releases from China, US and Eurozone • Geographical /Political factors like Flood, Earthquake, Govt. Policies, etc. • Global financial crisis, recession or inflation
  • 25. 25 Base Metals Price Calculator Particulars Copper (2500 Kgs) Aluminium Mini (1 MT) Zinc Mini (1 MT) Nickel (1500Kgs) Lead Mini (1 MT) Remarks A LME cash prices (US$/MT) 4828 1532 1898 11300 1723 Live prices B Premium (US$/MT) 50 100 50 50 50 Estimated premium will change from client to client C USDINR 75.7 75.7 75.7 75.7 75.7 Live prices D=A+ B*C CIF Price (INR/Kg) 369.26 123.54 147.46 859.20 134.22 E Basic custom duty + Surcharge (%) 5.50% 8.25% 5.50% 0.00% 5.50% Declared by Finance Ministry F=E*D Basic custom duty + Surcharge Value 20.31 10.19 8.11 0.00 7.38 G=F+ D Landing cost (INR/Kg) 389.57 133.73 155.57 859.20 141.60 H Custom clearing cost/Transportation/Handling ect. (Approx) 1.00% 1.00% 1.00% 1.00% 1.00% Will vary for entity to entity I=G*H Custom clearing cost/Transportation/Handling ect. (Approx) Value 3.90 1.34 1.56 8.59 1.42 Will change for enity and quantity J=I+G Final landed cost (INR/Kg) 393.47 135.07 157.13 867.79 143.01 Likely Landed price ex- warehouse via various supply sources MCX Future on 31st March April Contract 377.50 134.50 143.20 863 132.70 MCX Spot 31st March Thane 388.30 137.6 155.15 892 141.60
  • 26. 26 Energy-Crude Oil • Crude oil is a naturally occurring, unrefined petroleum product composed of hydrocarbon deposits in natural underground pools or reservoirs and remains liquid at atmospheric pressure and temperature. Although it is often called "black gold," crude oil has a wide ranging viscosity and can vary in color to various shades of black and yellow depending on its hydrocarbon composition. Crude oil can be refined to produce usable products such as gasoline, diesel and various forms of petrochemicals. Gasoline makes up 45% of crude oil. • Even though most crude oil is produced by a relatively small number of companies, and often located in remote locations far from the point of consumption, trading in crude oil on a global basis has always been robust. Nearly 80% of international crude oil is transported through waterways in large tankers and most of the rest by inland pipelines. Oil is measured in barrels, which is equal to 42 US gallons or 159 liters. • The majority of oil reserves in the world are in the Middle East, at 48% of the known and identified reserves. This is followed by North America, Africa, Central and South America, Eurasia, Asia and Oceania, and Europe. The US has the 10th largest oil reserve in the world. • OPEC is almost 40% of the world's crude oil production, and have about 75% of the world's proven oil reserves, and exports 55% of the oil traded globally. US, Russia, Saudi Arabia produce more than 30% of total world’s crude oil. The US is world’s largest consumer with more than 19 million bpd, 15% of global demand, and largest producer with more than 11.3 mbpd in March 2019, making it net importer with around 8 mbpd. The U.S. has 4% of the world’s population but uses 25% of the world’s oil. Oil consumed in the U.S. by driving is nearly two times that consumed by drivers in China and India combined. • The Organization of the Petroleum Exporting Countries (OPEC) is an intergovernmental organization of 14 nations, founded in 1960 in Baghdad by the first five members (Iran, Iraq, Kuwait, Saudi Arabia, and Venezuela), and headquartered since 1965 in Vienna, Austria.
  • 27. 27 Energy-Crude Oil • OPEC member countries monitor the market and decide collectively to raise or lower oil production in order to maintain stable prices and supply. A unanimous vote is required on raising or lowering oil production. Each member country controls the oil production of its country, but OPEC aims to coordinate the production policies of member countries. Oil and energy ministers from OPEC member countries usually meet twice a year to determine OPEC’s output level. They also meet in extraordinary sessions whenever required. • External factors such as weather and political uncertainty have an influence on the price of crude oil within the major oil producing nations. For example, severe weather can halt extraction which may lead to shortages and ultimately higher crude prices. • India is world's third-largest oil consumer. It imports about 86% of crude from the OPEC countries. The 23 refineries in India process 235 million metric tonnes (MMT) of crude annually or 4.7 million barrels per day capacity.
  • 28. 28 Major Contract Specifications- Crude Oil Futures Counter Crude Oil Symbol CRUDEOIL Price Quote Rs/bbl P&L per 1 Rs 100 Initial Margin % Minimum 4% or based on SPAN whichever is higher. Tick Size (Rs) 1 Lot Size (Trading Unit) 100 barrels Expiry Date (Contract Month) 19th/20th Average Daily Volatility 1.80% Break Even Price Range (Rs.) 2-3 Settlement Mechanism Cash Settlement
  • 29. 29 Major Contract Specification- Crude Oil Option Contract Counter Crude Oil Option Symbol CRUDEOIL Underlying Crude Oil Futures Option Type European Call & Put Options Premium Calculation Black 76 option pricing model Profit/Loss per 1 Rs. 100 Tick Size (Re) 0.10 Expiry Date (Contract Month) Three business days prior to the expiry of the underlying futures contract Lot Size (Trading Unit) 100 barrel Strike Intervals 50.00 Strikes 7 In-the-money, 7 Out-of-the-money and 1 Near-the-money. (15 CE and 15 PE).
  • 30. 30 Energy-Natural Gas • Natural gas is odourless, colourless and flammable. It is non-toxic and lighter than air; utility companies add the smell of rotten eggs – a product called mercaptan – to make leaks easier to detect. Natural gas is thought to have been first discovered in the Middle East between 6000 and 2000 BC when lightning strikes ignited natural gas seeping from the ground. Gas was first used to light a UK home in 1792 by engineer William Murdoch – it now makes up over 40% of UK electricity generation. • Natural gas is a vital component of the world's energy supply. It is one of the cleanest, safest, and the most useful of all energy sources. Given its growing resource base and relatively low carbon emissions compared with other fossil fuels, natural gas is likely to play a greater role in the world energy mix. • Natural gas is mainly used as fuel for generating electricity and heating. Natural gas prices are affected mainly through the US demand and it's seasonal in nature wherein in winters its prices fluctuate heavily. Also they have direct correlation with crude oil prices. It is measured in million British thermal units. One Btu is equivalent to the heat needed to raise the temperature of one pound of water by one degree Fahrenheit. A cubic foot of natural gas holds a lot of power, about 1,032 Btu. The world's most liquid derivative contracts for natural gas are traded on NYMEX. Natural gas is also a major feedstock for the production of ammonia, via the Haber process, for use in fertilizer production. • In much of the developed world it is supplied through pipes to homes, where it is used for many purposes including ranges and ovens, gas-heated clothes dryers, heating/cooling, and central heating. Heaters in homes and other buildings may include boilers, furnaces, and water heaters. Both North America and Europe are major consumers of natural gas. • There are over 15.2 million road vehicles worldwide that run on natural gas as a fuel. The gas is used in a compressed or liquefied state to power cars, buses, taxis, and trucks. Natural gas has had a tremendous growth as part of the global energy mix, and today accounts for 20.3% of global primary fuel consumed.
  • 31. 31 Energy-Natural Gas • Conventionally natural gas drilled out from wells vertically and horizontally. In conventional natural gas deposits, the natural gas generally flows easily up through wells to the surface. In the United States and in a few other countries, natural gas is produced from shale and other types of sedimentary rock formations by forcing water, chemicals, and sand down a well under high pressure. This process, called hydraulic fracturing or fracking, and sometimes referred to as unconventional production, breaks up the formation, releases the natural gas from the rock, and allows the natural gas to flow to and up wells to the surface. At the top of the well on the surface, natural gas is put into gathering pipelines and sent to natural gas processing plants. • Gas demand has a high price-sensitivity to changes in weather. Weather pattern changes are the primary contributor to gas price volatility. Gas prices also show a clear seasonal pattern with higher prices in fall and winter months in response to higher demand for heating. And lower prices the spring and summer months as demand drops. • The United States produces most of the natural gas that it consumes. Annual US dry natural gas production generally increased from 2005 to 2017, and US natural gas prices generally decreased during the same period and have been less volatile since 2010.
  • 32. 32 Major Contract Specifications-Natural Gas Futures Counter Natural Gas Symbol NATURAL GAS Price Quote Rs/mmbtu P&L per 1 Rs 1250 Initial Margin % Minimum 4% or based on SPAN whichever is higher Tick Size (Rs) 0.1 Lot Size (Trading Unit) 1250 mmbtu Expiry Date (Contract Month) 25th/26th Average Daily Volatility 2.60% Break Even Price Range (Rs.) 0.20-0.30 Settlement Mechanism Cash Settled
  • 33. 33 Factors Affecting Energy Sector • OPEC decisions • Natural Calamities e.g. Flooding, Drought, Earthquake or Tsunami • Any pipeline disruption • Political tensions in major oil producing/consuming countries • Weekly US Inventory releases • Adverse weather conditions e.g. Hurricanes, Tropical Storms • Change in Strategic Petroleum Reserves in the US • Growth forecast by the IMF, IEA etc. • Alternative heating options • Geopolitical flashpoints
  • 34. 34 Energy Price Calculator Crude Oil & Natural Gas Rate Calculator Crude Oil Natural Gas a. USD/INR Exchange rate 75.70 b. Price at NYMEX $/barrel 21.50 1.723 c. MCX Prices (a*b) Rs./barrel 1627 130.40

Editor's Notes

  1. Knowledge Series : 48 EDM’s shared intensively covering financial basics, common commodity terms and options. Video Series : Around 11 Videos were circulated internally on various topic related to commodities Daily Bullion Update : Every morning on whats app and lync group chat