Lincoln crowne copper gold weekly report 22072013
•
1 like•276 views

Lincoln Crowne & Company weekly report on the Australian Copper & Gold Sectors - dated 22 July 2013

Recommended
Recommended
More Related Content
What's hot
What's hot (20)
Viewers also liked
Viewers also liked (12)
Similar to Lincoln crowne copper gold weekly report 22072013
Similar to Lincoln crowne copper gold weekly report 22072013 (20)
More from Lincoln Crowne & Company
More from Lincoln Crowne & Company (20)
Recently uploaded
Recently uploaded (20)
Lincoln crowne copper gold weekly report 22072013
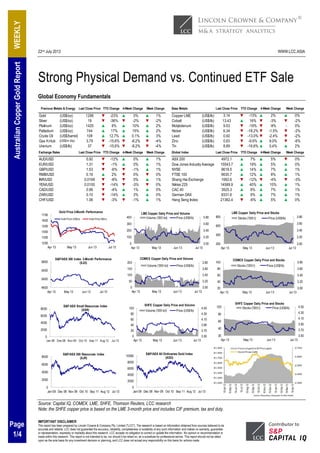
- 1. 22nd July 2013 WWW.LCC.ASIA IMPORTANT DISCLAIMER This report has been prepared by Lincoln Crowne & Company Pty. Limited ("LCC"). The research is based on information obtained from sources believed to be accurate and reliable. LCC does not guarantee the accuracy, reliability, completeness or suitability of any such information and makes no warranty, guarantee or representation, expressly or impliedly about this research. LCC accepts no obligation to correct or update the information. No opinion or recommendation is made within this research. This report is not intended to be, nor should it be relied on, as a substitute for professional advice. This report should not be relied upon as the sole basis for any investment decision or planning, and LCC does not accept any responsibility on this basis for actions made. WEEKLYAustralianCopperGoldReport Page 1/4 Strong Physical Demand vs. Continued ETF Sale Global Economy Fundamentals Source: Capital IQ, COMEX, LME, SHFE, Thomson Reuters, LCC research Note: the SHFE copper price is based on the LME 3-month price and includes CIF premium, tax and duty. Precious Metals & Energy Last Close Price YTD Change 4-Week Change Week Change Base Metals Last Close Price YTD Change 4-Week Change Week Change Gold (US$/oz) 1296 ▼ -23% ▲ 0% ▲ 1% Copper LME (US$/lb) 3.14 ▼ -13% ▲ 2% ▲ 0% Silver (US$/oz) 19 ▼ -36% ▼ -2% ▼ -2% Cobalt (US$/lb) 13.43 ▲ 16% ▼ -3% ▼ -2% Platinum (US$/oz) 1425 ▲ 6% ▲ 10% ▲ 2% Molybdenum (US$/lb) 9.53 ▼ -19% ▼ -9% - 0% Palladium (US$/oz) 744 ▲ 17% ▲ 15% ▲ 2% Nickel (US$/lb) 6.34 ▼ -18.2% ▼ -1.5% ▼ -2% Crude Oil (US$/barrel) 108 ▲ 12.7% ▲ 0.1% ▲ 3% Lead (US$/lb) 0.92 ▼ -13.0% ▼ -2.4% ▼ -2% Gas H.Hub (US$/m btu) 3.79 ▼ -15.6% ▼ -8.2% ▼ -4% Zinc (US$/lb) 0.83 ▼ -9.9% ▲ 9.0% ▼ -6% Uranium (US$/lb) 37 ▼ -15.6% ▼ -8.2% ▼ -4% Tin (US$/lb) 8.89 ▼ -16.6% ▲ 0.4% ▲ 2% Exchange Rates Last Close Price YTD Change 4-Week Change Week Change Global Index Last Close Price YTD Change 4-Week Change Week Change AUD/USD 0.92 ▼ -12% ▲ 0% ▲ 1% ASX 200 4972.1 ▲ 7% ▲ 5% ▼ 0% EUR/USD 1.31 ▼ -1% ▲ 0% ▲ 1% Dow Jones Industry Average 15543.7 ▲ 19% ▲ 5% ▲ 0% GBP/USD 1.53 ▼ -6% ▼ -1% ▲ 1% NYSE 9618.5 ▲ 14% ▲ 7% ▲ 1% RMB/USD 0.16 ▲ 2% ▼ 0% ▼ 0% FTSE 100 6630.7 ▲ 12% ▲ 8% ▲ 1% INR/USD 0.0169 ▼ -8% ▼ 0% ▲ 1% Shang Hai Exchange 1992.6 ▼ -12% ▼ -4% ▼ -3% YEN/USD 0.0100 ▼ -14% ▼ -3% ▼ 0% Nikkei 225 14589.9 ▲ 40% ▲ 10% ▲ 1% CAD/USD 0.96 ▼ -4% ▲ 1% ▲ 0% CAC 40 3925.3 ▲ 8% ▲ 7% ▲ 1% ZAR/USD 0.10 ▼ -14% ▲ 3% ▲ 0% German DAX 8331.6 ▲ 9% ▲ 7% ▲ 1% CHF/USD 1.06 ▼ -3% ▼ -1% ▲ 1% Hang Seng Index 21362.4 ▼ -6% ▲ 5% ▲ 0% 4600 5000 5400 5800 Apr 13 May 13 Jun 13 Jul 13 S&P/ASX 300 Index 3-Month Performance (XJO) 3.50 3.70 3.90 4.10 4.30 4.50 20 40 60 80 100 Apr 13 May 13 Jun 13 Jul 13 SHFE Copper Daily Price and Stocks Stocks ('000 t) Price (US$/lb) 1200 1300 1400 1500 1600 1700 Apr 13 May 13 Jun 13 Jul 13 Gold Price 3-Month Performance Gold Price US$/oz Gold Price A$/oz 3.00 3.20 3.40 3.60 3.80 200 400 600 800 Apr 13 May 13 Jun 13 Jul 13 LME Copper Daily Price and Stocks Stocks ('000 t) Price (US$/lb) 3.00 3.20 3.40 3.60 3.80 0 50 100 150 200 Apr 13 May 13 Jun 13 Jul 13 COMEX Copper Daily Price and Volume Volume ('000 lot) Price (US$/lb) 3.50 3.70 3.90 4.10 4.30 4.50 0 20 40 60 80 100 Apr 13 May 13 Jun 13 Jul 13 SHFE Copper Daily Price and Volume Volume ('000 lot) Price (US$/lb) 20 40 60 80 100 Apr 13 May 13 Jun 13 Jul 13 3.00 3.20 3.40 3.60 3.80 COMEX Copper Daily Price and Stocks Stocks ('000 t) Price (US$/lb) 0 2000 4000 6000 8000 10000 Jan 08 Dec 08 Nov 09 Oct 10 Sep 11 Aug 12 Jul 13 S&P/ASX All Ordinaries Gold Index (XGD) 0 2000 4000 6000 8000 Jan 08 Dec 08 Nov 09 Oct 10 Sep 11 Aug 12 Jul 13 S&P ASX Small Resources Index (XSR) 0 2000 4000 6000 8000 Jan 08 Dec 08 Nov 09 Oct 10 Sep 11 Aug 12 Jul 13 S&P/ASX 200 Resources Index (XJR) 3.00 3.20 3.40 3.60 3.80 0 100 200 300 400 Apr 13 May 13 Jun 13 Jul 13 LME Copper Daily Price and Volume Volume ('000 lot) Price (US$/lb)
- 2. 22nd July 2013 WWW.LCC.ASIA IMPORTANT DISCLAIMER This report has been prepared by Lincoln Crowne & Company Pty. Limited ("LCC"). The research is based on information obtained from sources believed to be accurate and reliable. LCC does not guarantee the accuracy, reliability, completeness or suitability of any such information and makes no warranty, guarantee or representation, expressly or impliedly about this research. LCC accepts no obligation to correct or update the information. No opinion or recommendation is made within this research. This report is not intended to be, nor should it be relied on, as a substitute for professional advice. This report should not be relied upon as the sole basis for any investment decision or planning, and LCC does not accept any responsibility on this basis for actions made. WEEKLYAustralianCopperGoldReport Page 2/4 Markets Last week gold ETF holdings fell more than 3 tonnes to 1,979t or 64moz, the lowest since May 2010. Gold bullion holdings hit a record of 2,632t or 85moz in December 2012. While physical demand remains strong, supply is expected to be flat or decreasing. Federal Reserve Chairman Ben Bernanke’s comment last Thursday. “Nobody really understands gold prices and I don’t pretend to understand them, either.” In the wake of the gold price drop, AngloGold Ashanti has warned of impairments of up to US$2.6 billion, as well as production cuts and possible mine closures, which could put its high-cost Sunrise Dam operation in Western Australia at risk. As a reflection of the challenging times within the sector, mining sector companies around the world are focusing on the remuneration levels of their senior executives, with pay cuts set to be widespread across the sector. Copper Producers Source: Capital IQ, ASX announcements, LCC research. C1 and C3 costs as reported in last quarter, except for TGS, LCC estimate. Emerging Copper Companies Source: Capital IQ, ASX announcements, LCC research. C1 costs and capex as estimated and announced by the respective companies. ASX Company News Sandfire Resources (ASX: SFR) produced 14,293t of copper and 11,284oz of gold at its Degrussa mine in the June quarter. Full- year production, which included direct shipping ore, was 64,017t copper and 42,679oz gold, just short of its revised guidance of 65,000t copper and 44,000oz gold. C1 costs, reported for the first time, were US$1.37/lb Cu. Discovery Metals (ASX: DML) has reported its best quarterly production to date at the Boseto copper project in Botswana: 5,034t of copper (+20% qoq) and 213,482oz (+15% qoq) of silver in concentrate. C1 costs were US$3.45/lb (–11% qoq). Mining costs were US$2.16/t mined. Processing costs were US$8.69/t milled and power costs were US$12.26/t milled. Unit costs reduced through the June quarter with increasing copper production with the C1 costs for June 2013 at US$3.10/lb Cu. Finders Resources (ASX: FND) has increased the ore reserve estimate for its Wetar copper project in Indonesia by 7% and managed to convert 97% of the mineral resource into reserve. The ore reserve now stands at 8.9mt at 2.4% Cu for 210,000t of contained copper. The estimate assumed a copper price of US$3.00/lb. Ticker Company Name Open Price Close Price High Price Low Price Weekly Change Market Cap (A$m) 52 Week Range Cash (A$m) EV (A$m) EV/EBITDA Ore Reserve (mt Cu) EV/Ore Reserve (US¢/lb) Project C1 Costs (US$/lb) C3 Costs (US$/lb) ABY Aditya Birla Minerals 0.39 0.39 0.40 0.38 -- 0.0% 121 100 21 0.4x 0.473 2 Nifty 2.32 N/A AOH Altona Mining 0.14 0.14 0.15 0.13 -- 0.0% 74 23 73 NM 0.061 49 Kylylahti 1.30 2.31 DML Discovery Metals 0.17 0.17 0.18 0.15 ▼ -2.9% 80 21 213 NM 0.403 22 Boseto 3.45 N/A HGO Hillgrove Resources 0.07 0.07 0.20 0.18 ▲ 1.5% 71 17 104 4.9x 0.125 34 Kanmantoo 3.15 4.42 IVA Inova Resources 0.19 0.18 4.20 4.02 ▼ -5.3% 131 38 93 NM 0.080 48 Osborne 2.85 4.27 OZL OZ Minerals 4.19 4.15 2.02 1.81 ▼ -1.0% 1258 659 599 1.9x 0.748 33 Prominent Hill 1.85 3.23 PNA PanAust 1.99 1.86 6.29 5.42 ▼ -6.8% 1125 104 1180 4.0x 1.127 43 Phu Kham 1.28 1.98 SFR Sandfire Resources 5.85 5.51 0.01 0.01 ▼ -5.8% 858 77 1066 6.5x 0.438 99 DeGrussa 1.37 2.21 SRQ Straits Resources 0.01 0.01 0.22 0.20 -- 0.0% 14 57 65 5.0x 0.178 15 Tritton 2.37 2.38 TGS Tiger Resources 0.21 0.21 0.02 0.02 ▲ 2.4% 142 19 129 3.3x 0.303 17 Kipoi 1.07 1.35 Ticker Company Name Open Price Close Price High Price Low Price Market Cap (A$m) 52 Week Range Cash (A$m) EV (A$m) Mineral Resource (mt Cu) EV/Mineral Resource (US¢/lb) Project C1 Costs (US$/lb) Capex (US$m) AVI Avalon Minerals 0.02 0.02 0.07 0.06 -- 0.0% 10 2 2 0.610 0.1 Viscaria 0.65 130 AVB Avanco Resources 0.06 0.07 0.27 0.22 ▲ 10.9% 79 7 53 0.762 2.8 Antas/Pedra Blanca 1.10 50 BTR Blackthorn Resources 0.22 0.27 0.23 0.19 ▲ 23.3% 44 29 15 1.000 0.6 Mumbwa 1.49 377 FND Finders Resources 0.19 0.23 0.07 0.07 ▲ 21.6% 95 3 92 0.205 18 Wetar 1.07 167 HAV Havilah Resources 0.33 0.32 0.35 0.31 ▼ -4.5% 38 7 23 0.623 1.5 Kalkaroo N/A 80 HCH Hot Chili 0.43 0.40 0.43 0.40 ▼ -7.0% 121 25 117 0.920 5.2 Productora 1.35 600 MMC Marengo Mining 0.02 0.02 0.02 0.02 -- 0.0% 24 6 77 0.806 3.9 Yandera n/a 1800 MNC Metminco 0.02 0.02 0.02 0.02 ▲ 6.3% 30 15 15 6.538 0.1 Los Calatos 1.09 1500 RXM Rex Minerals 0.48 0.52 0.54 0.41 ▲ 9.5% 98 34 26 2.000 0.5 Hillside 1.20 900 ROL Robust Resources 0.23 0.23 0.25 0.22 ▼ -2.2% 24 23 -2 0.077 -1.2 Andash N/A 96 YTC YTC Resources 0.20 0.19 0.20 0.18 ▼ -5.0% 50 5 48 0.091 22 Nymagee N/A N/A Weekly Change
- 3. 22nd July 2013 WWW.LCC.ASIA IMPORTANT DISCLAIMER This report has been prepared by Lincoln Crowne & Company Pty. Limited ("LCC"). The research is based on information obtained from sources believed to be accurate and reliable. LCC does not guarantee the accuracy, reliability, completeness or suitability of any such information and makes no warranty, guarantee or representation, expressly or impliedly about this research. LCC accepts no obligation to correct or update the information. No opinion or recommendation is made within this research. This report is not intended to be, nor should it be relied on, as a substitute for professional advice. This report should not be relied upon as the sole basis for any investment decision or planning, and LCC does not accept any responsibility on this basis for actions made. WEEKLYAustralianCopperGoldReport Page 3/4 Evolution Mining (ASX: EVN) has declared commercial production at its A$180 million Mt Carlton gold-silver-copper mine in North Queensland, nearly three months after first concentrate production. The first gold concentrate shipment to Shandong Guoda Gold Company is expected to leave Townsville early August. Kingsrose Mining (ASX: KRM) has raised A$15.3 million in a share placement at A$0.35 per share. The company is now fully funded to undertake the development of its Talang Santo gold-silver mine in Sumatra, Indonesia. KRM aims to be producing gold from the mill by October 2013, ramping-up production to the rate of 35,000oz pa by the start of 2014 and to 50,000oz pa by the end of 2014. All-in costs are forecast to be ~US$650/oz by the September quarter of 2014. After suspending its Laverton operations in May, Focus Minerals (ASX: FML) will also cease production at its flagship Coolgardie mining centre due to the low gold price. FML produced 25,172oz of gold comprising 13,179oz from the Laverton operations (C1 costs not reported) and 11,993oz from the Coolgardie operations (C1 costs A$1,899/oz). Cash as at 30 June is A$114 million. Silver Lake Resources (ASX: SLR) has decided to defer the development of the underground Caustons mine. Underground development at the mine will be put on care and maintenance in readiness for start-up at a later point. Supply feed to the mill for FY2014 will be maintained at 1.2mtpa rate from continued mining of multiple open pits and historic stockpiles. Emerging Gold Companies Source: Capital IQ, LCC research. C1 costs and capex as estimated and announced by the respective companies. Note: * Original cost in A$ converted to US$ using an exchange rate of 0.90. Mergers & Acquisitions Barrick has stepped up its campaign to sell Australian assets by putting its Barnicoat gold project in Western Australia on the block. Barrick is also believed to be in discussions to sell its 51% stake in the operating East Kundana gold mine, with JV partner Tribune Resources (ASX: TBR) the first point of call. Barrick has already for sale a trio of other Western Australian mines – Granny Smith, Darlot and Lawlers – and is open to offers for the rest of its Australian assets. Middle Island Resources (ASX: MDI) has entered into a heads of agreement for the purchase of an 80% interest in the Samira Hill gold mine currently held by Semafo (TSX: SMF). The government of Niger owns the remaining 20% interest in the mine. Consideration for the purchase comprises a cash payment of US$1.25 million and a fixed net smelter return (NSR) royalty of 1.2% on gold sold from the Samira Hill plant. The NSR is payable only if the spot price of gold is at or greater than US$1,450/oz and is capped at US$12 million. GBM Resources (ASX: GBZ) has completed its technical and legal due diligence with the view to acquire and recommission the Lubuk Mandi gold mine in Peninsular Malaysia from Angka Alamjaya Sdn Bhd (AASB). Under the terms of the Acquisition and Joint Venture Agreement, GBM and AASB agree to undertake a share swap in which GBM will acquire approximately 40% of AASB by issuing 15% of ordinary shares in GBM, subject to shareholder approval at a general meeting of GBM Shareholders on Monday 22 July 2013. Less than two weeks after announcing it will cease production at the Angas zinc mine, Terramin Australia (ASX: TZN) has entered into a binding agreement to acquire 100% of the high grade Bird-in-Hand gold project from Maximum Resources (ASX: MXR). The project is located approximately 30km north of Terramin’s existing processing facilities at Angas. The project has a high grade resource of 598,000t at 12.3 g/t for 237,000oz which is amenable to underground mining. TZN has agreed to pay MXR A$3.5 million in upfront and staged payments conditional on the satisfaction of certain project milestones and 25 million ordinary TZN shares. TZN has also agreed to pay MXR a royalty in respect of gold production from the Bird-in-Hand project. Ticker Company Name Open Price Close Price High Price Low Price Weekly Change Market Cap (A$m) 52 Week Range Cash (A$m) EV (A$m) Reserves (moz) EV/Reserves (US$/oz) Project Name C1 Costs (US$/oz) Capex (US$m) AZM Azumah Resources 0.03 0.03 0.03 0.03 ▼ -3.2% 10 3 7 0.4 14 Wa 802 144 BAB Bullabulling Gold 0.03 0.03 0.03 0.03 ▲ 28.0% 11 2 2 2.4 1 Bullabulling 843 294* CAS Crusader Resources 0.25 0.25 0.28 0.24 -- 0.0% 31 1 30 1.6 17 Borborema 558 169 DRM Doray Minerals 0.50 0.55 0.55 0.48 ▲ 10.0% 78 32 46 0.3 166 Andy Well 592 53* GRY Gryphon Minerals 0.14 0.15 0.15 0.13 ▲ 7.4% 58 62 -4 1.1 -4 Banfora 774 208 IDC Indochine Mining 0.04 0.05 0.05 0.04 ▲ 25.0% 42 4 39 1.1 32 Mt Kare 800 218 KGD Kula Gold 0.08 0.08 0.08 0.08 -- 0.0% 10 5 5 0.8 5 Woodlark Island 730 160 MDI Middle Island Resources 0.08 0.11 0.11 0.08 ▲ 38% 14 6 8 0.3 22 Samira Hill N/A 1.3 MUM Mount Magnet South 0.01 0.01 0.01 0.01 ▼ -14.3% 6 2 5 0.3 16 Kirkalocka 1142 33* PGI PanTerra Gold 0.08 0.10 0.10 0.08 ▲ 20.3% 72 2 70 0.6 101 Las Lagunas 307 83 PIR Papillon Resources 0.85 1.01 1.04 0.85 ▲ 18.8% 341 62 279 3.0 84 Fekola 580 292 PVM PMI Gold 0.34 0.35 0.35 0.31 ▲ 2.4% 143 117 27 2.3 11 Obotan 626 297 PXG Phoenix Gold 0.16 0.17 0.18 0.15 ▲ 6.5% 40 16 24 0.7 31 Castle Hill 756 118*
- 4. 22nd July 2013 WWW.LCC.ASIA IMPORTANT DISCLAIMER This report has been prepared by Lincoln Crowne & Company Pty. Limited ("LCC"). The research is based on information obtained from sources believed to be accurate and reliable. LCC does not guarantee the accuracy, reliability, completeness or suitability of any such information and makes no warranty, guarantee or representation, expressly or impliedly about this research. LCC accepts no obligation to correct or update the information. No opinion or recommendation is made within this research. This report is not intended to be, nor should it be relied on, as a substitute for professional advice. This report should not be relied upon as the sole basis for any investment decision or planning, and LCC does not accept any responsibility on this basis for actions made. WEEKLYAustralianCopperGoldReport Page 4/4 Gold Producers Source: Capital IQ, Goldnerds, LCC research. Assumption: A$/US$ exchange rate of 0.90. Note: * These stocks are not primarily listed on the ASX. Prices, market cap and multiples are based on their primarily listed market quote. Ticker Company Name Open Price Close Price High Price Low Price Weekly Change Market Cap (A$m) 52 Week Range Cash (A$m) Debt (A$m) EV (A$m) EV/EBITDA Ore Reserve (moz) EV/Reserve (US$/oz) C1 Costs (US$/oz) C3 Costs (US$/oz) ANG* AngloGold Ashanti 14.29 13.99 14.29 13.23 ▼ -2.1% 5374 612 3368 8130 4.2x 74.1 99 894 1147 ASR* Alacer Gold Corp 2.74 2.51 2.74 2.42 ▼ -8.4% 719 245 63 537 2.1x 5.0 97 932 N/A BEZ* Besra Gold 0.05 0.05 0.06 0.05 ▲ 10.3% 20 4 43 59 2.5x 0.1 515 793 1330 CCU Cobar Consolidated Resources 0.15 0.15 0.16 0.14 -- 0.0% 48 3 18 63 N/M 0.4 143 N/A N/A EVN Evolution Mining 0.70 0.71 0.73 0.66 ▲ 0.7% 499 7 84 576 2.0x 3.4 153 826 1284 EDV* Endeavour Mining Corp 0.58 0.58 0.62 0.53 ▼ -0.7% 238 82 195 352 3.1x 2.5 127 809 975 FML Focus Minerals 0.01 0.01 0.02 0.01 ▼ -14.3% 110 114 11 7 N/M 0.5 11 1709 1776 GDO Gold One International 0.12 0.12 0.12 0.12 -- 0.0% 171 37 70 204 7.9x 2.7 68 1047 1246 KCN Kingsgate Consolidated 1.59 1.59 1.70 1.49 -- 0.0% 242 42 173 374 2.5x 2.6 127 1051 N/A KRM Kingsrose Mining 0.43 0.42 0.45 0.41 ▼ -2.3% 127 3 6 131 5.5x 0.0 NM 1029 N/A LSA Lachlan Star 0.16 0.29 0.29 0.16 ▲ 81.3% 29 3 26 52 N/M 0.1 343 1239 N/A MML Medusa Mining 1.79 1.82 1.84 1.62 ▲ 1.7% 344 9 0 335 5.4x 0.6 531 296 N/A MOY Millennium Minerals 0.01 0.02 0.02 0.01 ▲ 14.3% 70 5 54 120 N/M 0.7 159 685 844 NCM Newcrest Mining 12.09 11.12 12.16 10.89 ▼ -8.0% 8520 97 3203 11626 6.4x 87.3 120 719 977 NGF Norton Gold Fields 0.12 0.12 0.12 0.11 ▼ -4.2% 99 56 45 88 3.8x 1.1 71 930 1154 NST Northern Star Resources 0.73 0.76 0.76 0.69 ▲ 4.1% 320 58 12 274 4.9x 0.3 959 581 780 OGC* OceanaGold Corporation 1.52 1.63 1.64 1.48 ▲ 6.8% 477 26 240 691 4.0x 3.6 171 687 1117 PRU Perseus Mining 0.69 0.56 0.74 0.47 ▼ -19.0% 254 36 0 219 1.8x 4.0 49 1181 1274 RDR Reed Resources 0.04 0.04 0.04 0.04 ▲ 15.8% 23 19 0 4 1.7x 0.8 5 900 N/A RED Red 5 - - - - ▲ N/A 84 12 23 96 N/M 0.7 122 973 1333 RMS Ramelius Resources 0.14 0.14 0.14 0.13 ▲ 3.7% 47 43 4 8 0.2x 0.6 13 968 N/A RRL Regis Resources 3.50 3.30 3.50 3.20 ▼ -5.7% 1631 8 0 1623 9.9x 3.1 473 524 N/A RSG Resolute Mining 0.64 0.69 0.71 0.61 ▲ 7.0% 455 177 69 347 1.5x 4.4 70 747 963 SAR Saracen Mineral Holdings 0.13 0.12 0.13 0.12 ▼ -8.0% 68 23 15 61 1.8x 1.1 50 892 950 SBM St Barbara 0.58 0.62 0.64 0.55 ▲ 6.9% 303 225 312 390 2.0x 5.7 62 753 946 SLR Silver Lake Resources 0.78 0.72 0.80 0.68 ▼ -7.7% 273 11 14 276 4.3x 1.8 138 657 1199 TAM Tanami Gold 0.06 0.06 0.06 0.05 ▲ 3.3% 36 10 44 71 36.2x 0.4 159 1750 1793 TBR Tribune Resources 1.56 1.90 1.99 1.56 ▲ 21.8% 95 14 14 95 1.9x 0.2 374 401 N/A TGZ* Teranga Gold Corp 0.64 0.65 0.74 0.62 ▲ 0.9% 160 51 79 188 0.8x 1.7 103 535 N/A TRY Troy Resources 1.65 1.41 1.66 1.38 ▼ -14.5% 232 41 0 191 2.0x 0.6 276 804 N/A UML Unity Mining 0.07 0.07 0.07 0.07 ▼ -4.3% 46 28 0 19 1.2x 0.4 46 881 N/A