Lincoln crowne copper gold weekly report 15072013
•
0 likes•291 views

Lincoln Crowne Weekly Australian Gold & Copper report dated 15th July 2013

Recommended
Recommended
More Related Content
What's hot
What's hot (20)
Viewers also liked
Viewers also liked (12)
Similar to Lincoln crowne copper gold weekly report 15072013
Similar to Lincoln crowne copper gold weekly report 15072013 (20)
More from Lincoln Crowne & Company
More from Lincoln Crowne & Company (20)
Recently uploaded
Recently uploaded (20)
Lincoln crowne copper gold weekly report 15072013
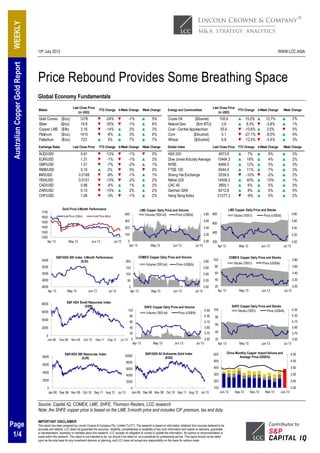
- 1. 15th July 2013 WWW.LCC.ASIA IMPORTANT DISCLAIMER This report has been prepared by Lincoln Crowne & Company Pty. Limited ("LCC"). The research is based on information obtained from sources believed to be accurate and reliable. LCC does not guarantee the accuracy, reliability, completeness or suitability of any such information and makes no warranty, guarantee or representation, expressly or impliedly about this research. LCC accepts no obligation to correct or update the information. No opinion or recommendation is made within this research. This report is not intended to be, nor should it be relied on, as a substitute for professional advice. This report should not be relied upon as the sole basis for any investment decision or planning, and LCC does not accept any responsibility on this basis for actions made. WEEKLYAustralianCopperGoldReport Page 1/4 Price Rebound Provides Some Breathing Space Global Economy Fundamentals Source: Capital IQ, COMEX, LME, SHFE, Thomson Reuters, LCC research Note: the SHFE copper price is based on the LME 3-month price and includes CIF premium, tax and duty. Metals Last Close Price (in USD) YTD Change 4-Week Change Week Change Energy and Commodities Last Close Price (in USD) YTD Change 4-Week Change Week Change Gold Comex ($/oz) 1278 ▼ -24% ▼ -1% ▲ 5% Crude Oil ($/barrel) 105.6 ▲ 15.0% ▲ 12.7% ▲ 2% Silver ($/oz) 19.8 ▼ -35% ▼ -1% ▲ 6% Natural Gas ($/m BTU) 3.6 ▲ 8.3% ▼ -3.8% ▲ 1% Copper LME ($/lb) 3.16 ▼ -14% ▲ 2% ▲ 3% Coal - Central Appalachian 55.6 ▼ -10.6% ▲ 3.5% ▼ 0% Platinum ($/oz) 1410 ▼ -8% ▲ 3% ▲ 6% Corn ($/bushel) 5.1 ▼ -27.1% ▼ -8.5% ▲ 4% Palladium ($/oz) 723 ▲ 3% ▲ 7% ▲ 7% Wheat ($/bushel) 6.8 ▼ -12.5% ▼ -3.4% ▲ 3% Exchange Rates Last Close Price YTD Change 4-Week Change Week Change Global Index Last Close Price YTD Change 4-Week Change Week Change AUD/USD 0.91 ▼ -13% ▼ -1% ▼ 0% ASX 200 4973.9 ▲ 7% ▲ 5% ▲ 3% EUR/USD 1.31 ▼ -1% ▼ -1% ▲ 2% Dow Jones Industry Average 15464.3 ▲ 18% ▲ 4% ▲ 2% GBP/USD 1.51 ▼ -7% ▼ -2% ▲ 1% NYSE 9498.5 ▲ 12% ▲ 5% ▲ 3% RMB/USD 0.16 ▲ 2% ▼ 0% ▼ 0% FTSE 100 6544.9 ▲ 11% ▲ 7% ▲ 3% INR/USD 0.0168 ▼ -8% ▼ -1% ▲ 1% Shang Hai Exchange 2039.5 ▼ -10% ▼ -2% ▲ 2% YEN/USD 0.0101 ▼ -13% ▼ -2% ▲ 2% Nikkei 225 14506.3 ▲ 40% ▲ 10% ▲ 1% CAD/USD 0.96 ▼ -4% ▲ 1% ▲ 2% CAC 40 3855.1 ▲ 6% ▲ 5% ▲ 3% ZAR/USD 0.10 ▼ -15% ▲ 2% ▲ 2% German DAX 8212.8 ▲ 8% ▲ 5% ▲ 5% CHF/USD 1.06 ▼ -3% ▼ -1% ▲ 2% Hang Seng Index 21277.3 ▼ -6% ▲ 5% ▲ 2% 4600 4800 5000 5200 5400 Apr 13 May 13 Jun 13 Jul 13 S&P/ASX 300 Index 3-Month Performance (XJO) 3.50 3.70 3.90 4.10 4.30 4.50 20 40 60 80 100 Apr 13 May 13 Jun 13 Jul 13 SHFE Copper Daily Price and Stocks Stocks ('000 t) Price (US$/lb) 1200 1300 1400 1500 1600 1700 Apr 13 May 13 Jun 13 Jul 13 Gold Price 3-Month Performance Gold Price US$/oz Gold Price A$/oz 3.00 3.20 3.40 3.60 3.80 200 400 600 800 Apr 13 May 13 Jun 13 Jul 13 LME Copper Daily Price and Stocks Stocks ('000 t) Price (US$/lb) 3.00 3.20 3.40 3.60 3.80 0 50 100 150 200 Apr 13 May 13 Jun 13 Jul 13 COMEX Copper Daily Price and Volume Volume ('000 lot) Price (US$/lb) 3.50 3.70 3.90 4.10 4.30 4.50 0 20 40 60 80 100 Apr 13 May 13 Jun 13 Jul 13 SHFE Copper Daily Price and Volume Volume ('000 lot) Price (US$/lb) 20 40 60 80 100 Apr 13 May 13 Jun 13 Jul 13 3.00 3.20 3.40 3.60 3.80 COMEX Copper Daily Price and Stocks Stocks ('000 t) Price (US$/lb) 0 2000 4000 6000 8000 10000 Jan 08 Dec 08 Nov 09 Oct 10 Sep 11 Aug 12 Jul 13 S&P/ASX All Ordinaries Gold Index (XGD) 0 2000 4000 6000 8000 Jan 08 Dec 08 Nov 09 Oct 10 Sep 11 Aug 12 Jul 13 S&P ASX Small Resources Index (XSR) 0 2000 4000 6000 8000 Jan 08 Dec 08 Nov 09 Oct 10 Sep 11 Aug 12 Jul 13 S&P/ASX 200 Resources Index (XJR) 2.00 2.50 3.00 3.50 4.00 4.50 100 200 300 400 500 600 Jun-12 Sep-12 Dec-12 Mar-13 Jun-13 China Monthly Copper Import Volume and Average Price (US$/lb) 3.00 3.20 3.40 3.60 3.80 0 100 200 300 400 Apr 13 May 13 Jun 13 Jul 13 LME Copper Daily Price and Volume Volume ('000 lot) Price (US$/lb)
- 2. 15th July 2013 WWW.LCC.ASIA IMPORTANT DISCLAIMER This report has been prepared by Lincoln Crowne & Company Pty. Limited ("LCC"). The research is based on information obtained from sources believed to be accurate and reliable. LCC does not guarantee the accuracy, reliability, completeness or suitability of any such information and makes no warranty, guarantee or representation, expressly or impliedly about this research. LCC accepts no obligation to correct or update the information. No opinion or recommendation is made within this research. This report is not intended to be, nor should it be relied on, as a substitute for professional advice. This report should not be relied upon as the sole basis for any investment decision or planning, and LCC does not accept any responsibility on this basis for actions made. WEEKLYAustralianCopperGoldReport Page 2/4 Markets Copper and gold prices rallied on signs the US Federal Reserve may maintain economic stimulus for a while longer. Freeport McMoRan Copper and Gold has resumed shipments from its Grasberg mine in Indonesia after the world's second largest copper mine gained government permission to resume underground operations. Rio Tinto has finally been authorised to ship copper concentrate from its US$6.2 billion Oyu Tolgoi gold and copper mine in Mongolia's Gobi Desert. The event was celebrated by Robert Friedland. Twelve years ago on 17 July 2001, Ivanhoe Mines reported its deep drilling had discovered a zone of “potentially significant gold, copper and molybdenum mineralisation” at Turquoise Hill (Oyu Tolgoi). The discovery and development of the mine has put Mongolia on the international resources map. China's copper imports in June rose nearly 6% to 379,951 tonnes, the highest since September 2012 and up from 358,672 tonnes in May 2013, as domestic supplies are quite tight and top Chinese smelters have been holding their material rather than selling on low prices. A shortage of scrap copper also contributed to more demand for the refined metal. June's figure was up 9.7% from the same month last year imports of copper. Nevertheless, copper imports over H1 2013 are 15% lower than last year. The Democratic Republic of Congo has delayed until year-end a ban on exports of copper and cobalt concentrates designed to encourage miners to refine the red metal within its borders. The DRC first ordered the ban in April but gave mining companies 90 days to clear their stockpiles. The ban appears unrealistic and a political stunt. Codelco, the world's leading producer of copper, is dissatisfied with the Chilean government's US$1 billion budget and needs to consider selling some non-essential properties to fund its investment plans. Codelco intended to spend around US$27 billion over the next few years to increase its yearly production from the current 1.8 million tonnes to 2.1mt by 2021. Zijin Mining Group announced a profit warning for its first half 2013 earnings, indicating that the net profit for H1 2013 is expected 45-55% lower than in H1 2012. Copper Producers Source: Capital IQ, ASX announcements, LCC research. C1 and C3 costs as reported in last quarter, except for TGS, LCC estimate. Emerging Copper Companies Source: Capital IQ, ASX announcements, LCC research. C1 costs and capex as estimated and announced by the respective companies. Ticker Company Name Open Price Close Price High Price Low Price Weekly Change Market Cap (A$m) 52 Week Range Cash (A$m) EV (A$m) EV/EBITDA Ore Reserve (mt Cu) EV/Ore Reserve (US¢/lb) Project C1 Costs (US$/lb) C3 Costs (US$/lb) ABY Aditya Birla Minerals 0.39 0.40 0.40 0.38 ▲ 2.6% 124 100 24 0.5x 0.473 2 Nifty 2.32 N/A AOH Altona Mining 0.14 0.14 0.14 0.12 ▼ -3.0% 74 23 73 NM 0.061 49 Kylylahti 1.30 2.31 DML Discovery Metals 0.15 0.17 0.21 0.14 ▲ 22.1% 83 17 245 NM 0.403 25 Boseto N/A N/A HGO Hillgrove Resources 0.06 0.07 0.07 0.06 ▲ 12.7% 71 17 104 4.9x 0.125 34 Kanmantoo 3.15 4.42 IVA Inova Resources 0.19 0.20 0.21 0.19 ▼ -1.7% 143 38 106 NM 0.080 54 Osborne 2.85 4.27 OZL OZ Minerals 3.95 4.15 4.22 3.84 ▲ 4.2% 1258 659 599 1.9x 0.748 33 Prominent Hill 1.85 3.23 PNA PanAust 1.83 1.99 2.07 1.73 ▲ 5.8% 1207 104 1262 4.2x 1.127 46 Phu Kham 1.28 1.98 SFR Sandfire Resources 5.50 5.95 6.30 5.45 ▲ 5.3% 926 110 1194 6.9x 0.466 105 DeGrussa N/A N/A SRQ Straits Resources 0.02 0.01 0.02 0.01 ▼ -5.5% 14 57 65 5.0x 0.178 15 Tritton 2.37 2.38 TGS Tiger Resources 0.19 0.20 0.21 0.17 ▲ 6.1% 135 19 122 3.1x 0.303 16 Kipoi 1.07 1.35 Ticker Company Name Open Price Close Price High Price Low Price Market Cap (A$m) 52 Week Range Cash (A$m) EV (A$m) Mineral Resource (mt Cu) EV/Mineral Resource (US¢/lb) Project C1 Costs (US$/lb) Capex (US$m) AVI Avalon Minerals 0.01 0.02 0.02 0.01 ▲ 6.1% 8 2 2 0.610 0.1 Viscaria 0.65 130 AVB Avanco Resources 0.07 0.06 0.07 0.06 ▲ 46.3% 70 7 53 0.762 2.8 Antas/Pedra Blanca 1.10 50 BTR Blackthorn Resources 0.24 0.22 0.24 0.22 ▼ -5.7% 35 29 7 1.000 0.3 Mumbwa 1.49 377 FND Finders Resources 0.19 0.19 0.20 0.18 ▼ -14.7% 78 3 68 0.209 13 Wetar 1.07 167 HAV Havilah Resources 0.28 0.31 0.33 0.27 ▲ 8.8% 37 7 23 0.623 1.5 Kalkaroo N/A 80 HCH Hot Chili 0.42 0.42 0.45 0.41 ▲ 26.9% 128 25 117 0.920 5.2 Productora 1.35 600 MMC Marengo Mining 0.03 0.02 0.03 0.02 ▼ -10.1% 24 6 77 0.806 3.9 Yandera n/a 1800 MNC Metminco 0.02 0.02 0.02 0.02 ▼ -23.7% 28 15 15 6.538 0.1 Los Calatos 1.09 1500 RXM Rex Minerals 0.46 0.45 0.55 0.45 ▲ 16.0% 85 34 26 2.000 0.5 Hillside 1.20 900 ROL Robust Resources 0.23 0.23 0.24 0.20 ▼ -2.4% 24 23 -2 0.077 -1.2 Andash N/A 96 YTC YTC Resources 0.20 0.20 0.20 0.17 ▲ 11.2% 53 5 48 0.091 22 Nymagee N/A N/A Weekly Change
- 3. 15th July 2013 WWW.LCC.ASIA IMPORTANT DISCLAIMER This report has been prepared by Lincoln Crowne & Company Pty. Limited ("LCC"). The research is based on information obtained from sources believed to be accurate and reliable. LCC does not guarantee the accuracy, reliability, completeness or suitability of any such information and makes no warranty, guarantee or representation, expressly or impliedly about this research. LCC accepts no obligation to correct or update the information. No opinion or recommendation is made within this research. This report is not intended to be, nor should it be relied on, as a substitute for professional advice. This report should not be relied upon as the sole basis for any investment decision or planning, and LCC does not accept any responsibility on this basis for actions made. WEEKLYAustralianCopperGoldReport Page 3/4 ASX Company News Finders Resources (ASX: FND) has been awarded the final forestry permit (“Pinjam Pakai”). The forestry permit is the final permit required to complete project financing and commence project development. In preparation for development, FND intends to restart its demonstration plant in order to generate early cash flow and revise capital and operating cost estimates for a refreshed Feasibility Study required to update bank credit approvals. Despite using a higher grade cut-off (0.5% Cu vs. 0.3% previously), Tiger Resources (ASX: TGS) has increased the mineral resources at its 100% owned Sase Central deposit: indicated resources amount 9.6mt @ 1.39% Cu for 134,000 t of copper, an increase of +174% compared to the previous estimate dated March 2011. Combined indicated and inferred resources amount 168,000 t copper. The resource is classified under JORC 2012. Hot Chili (ASX: HCH) has raised A$11.7 million @ $0.45 to continue the development of its flagship Productora project in Chile. The placement received strong support from HCH project partner, CAP. CAP is the parent company of Compañia Minera del Pacifico, Chile’s largest iron ore producer and integrated steel business. Havilah Resources (ASX: HAV) has signed an agreement to purchase the 48-room White Dam mining camp for its planned Portia gold mine, located about 80km away. The permitting of the mine continues to satisfy the Environmental Protection Authority. The final outstanding task is to confirm that the de-watering water produced during mining operations can be successfully re-injected into the nearby paleochannel. Northern Star Resources (ASX: NST) produced record production of 88,614oz for FY2013, +32% yoy. From a revenue of $144m (+45% yoy), NST expects a FY2013 NPAT of $27m vs. $22m for the previous financial year. NST has also decided to delay its Ashburton project but will continue to meet minimum expenditure commitments. Saracen Mineral Holdings (ASX: SAR) produced 136,168oz for FY2013, +17% yoy. The Red October underground mine has started to reach full production. June ore production from Red October was 11,396t @ 12.72g/t for 4,661oz of gold. Following poor mine to mill metal reconciliation, Reed Resources (ASX: RDR) has tightened ore block interpretations to increase the feed grade to its Meekatharra gold processing plant. Cash costs are reaffirmed at A$1,000/oz. Ramelius Resources (ASX: RMS) produced a record amount of gold from the Mt Magnet project with 17,100oz produced during the June 2013 quarter, +18% qoq. Ore from Wattle Dam remnants and third party produced 1,900oz for the same period. KalNorth Gold Mines (ASX: KGM) plans to suspend mining activities at its Lindsay project in WA. In addition, further cost reductions are being sought to preserve cash, maintain tenements in good standing, provide for a modest exploration effort and wait for a more favourable gold price environment. Mergers & Acquisitions Kentor Gold (ASX: KGL) announced that the creditors of its subsidiary Kentor Minerals (WA) have accepted a Deed of Company Arrangement (DOCA) whereby KGL agrees to pay A$3m into a DOCA fund for the benefit of the subsidiary. The DOCA is subject to the completion of the Andash project sale to Robust Resources (ASX: ROL), which in turn is reliant on shareholder approval at the company’s AGM scheduled for 8th August 2013. Emerging Gold Companies Source: Capital IQ, LCC research. C1 costs and capex as estimated and announced by the respective companies. Note: * Original cost in A$ converted to US$ using an exchange rate of 0.90. Ticker Company Name Open Price Close Price High Price Low Price Weekly Change Market Cap (A$m) 52 Week Range Cash (A$m) EV (A$m) Reserves (moz) EV/Reserves (US$/oz) Project Name C1 Costs (US$/oz) Capex (US$m) AZM Azumah Resources 0.03 0.03 0.03 0.03 ▲ 1.9% 10 3 7 0.4 14 Wa 802 144 BAB Bullabulling Gold 0.03 0.03 0.03 0.02 ▼ -7.1% NM 2 2 2.4 1 Bullabulling 1145 294* CAS Crusader Resources 0.25 0.24 0.25 0.24 ▼ -1.9% 30 1 29 1.6 16 Borborema 558 169 DRM Doray Minerals 0.46 0.50 0.52 0.46 ▲ 8.6% 71 32 39 0.3 141 Andy Well 592 53* GRY Gryphon Minerals 0.14 0.14 0.15 0.12 ▲ 0.6% 54 62 -8 1.1 -7 Banfora 774 208 KGD Kula Gold 0.09 0.09 0.09 0.09 ▲ 3.4% 11 5 6 0.8 7 Woodlark Island 730 160 MUM Mount Magnet South 0.02 0.02 0.02 0.02 ▼ -17.3% 8 2 6 0.3 21 Kirkalcka 1142 33* PGI PanTerra Gold 0.08 0.08 0.08 0.07 ▲ 5.9% 61 2 59 0.6 84 Las Lagunas 307 83 PIR Papillon Resources 0.81 0.85 0.88 0.75 ▲ 2.5% 287 62 225 3.0 68 Fekola 580 292
- 4. 15th July 2013 WWW.LCC.ASIA IMPORTANT DISCLAIMER This report has been prepared by Lincoln Crowne & Company Pty. Limited ("LCC"). The research is based on information obtained from sources believed to be accurate and reliable. LCC does not guarantee the accuracy, reliability, completeness or suitability of any such information and makes no warranty, guarantee or representation, expressly or impliedly about this research. LCC accepts no obligation to correct or update the information. No opinion or recommendation is made within this research. This report is not intended to be, nor should it be relied on, as a substitute for professional advice. This report should not be relied upon as the sole basis for any investment decision or planning, and LCC does not accept any responsibility on this basis for actions made. WEEKLYAustralianCopperGoldReport Page 4/4 Gold Producers Source: Capital IQ, Goldnerds, LCC research. Assumption: A$/US$ exchange rate of 0.90. Note: * These stocks are not primarily listed on the ASX. Prices, market cap and multiples are based on their primarily listed market quote. Ticker Company Name Open Price Close Price High Price Low Price Weekly Change Market Cap (A$m) 52 Week Range Cash (A$m) Debt (A$m) EV (A$m) EV/EBITDA Ore Reserve (moz) EV/Reserve (US$/oz) C1 Costs (US$/oz) C3 Costs (US$/oz) ANG* AngloGold Ashanti 14.13 14.09 14.70 13.61 ▲ 1.6% 5413 653 3368 8128 4.2x 75.6 97 894 1147 ASR* Alacer Gold Corp 2.47 2.68 2.77 2.34 ▲ 8.2% 770 245 63 588 2.2x 5.0 106 932 N/A BEZ* Besra Gold 0.05 0.05 0.05 0.04 ▼ -6.9% 18 4 43 57 2.4x 0.1 472 883 1330 CCU Cobar Consolidated Resources 0.10 0.14 0.15 0.10 ▲ 39.1% 46 10 18 54 N/M 0.4 114 N/A N/A EVN Evolution Mining 0.58 0.69 0.70 0.53 ▲ 16.2% 485 49 84 520 1.9x 3.4 137 826 1284 EDV* Endeavour Mining Corp 0.52 0.57 0.62 0.50 ▲ 10.4% 237 82 195 350 3.1x 2.6 122 899 N/A FML Focus Minerals 0.01 0.01 0.01 0.01 ▲ 0.5% 128 208 11 -69 N/M 0.5 -121 1704 1776 GDO Gold One International 0.12 0.12 0.12 0.11 ▼ -12.5% 149 37 218 330 7.4x 2.7 111 1047 1246 KCN Kingsgate Consolidated 1.38 1.59 1.66 1.25 ▲ 14.5% 242 42 173 374 2.5x 2.7 126 1051 N/A KRM Kingsrose Mining 0.50 0.47 0.51 0.45 ▼ -5.2% 136 9 6 134 5.9x 0.0 NM 1029 N/A LSA Lachlan Star 0.11 0.16 0.16 0.11 ▲ 32.6% 15 3 26 38 N/M 0.1 254 1239 N/A MML Medusa Mining 1.77 1.80 1.85 1.34 ▲ 1.5% 339 9 0 331 5.3x 0.6 524 296 N/A MOY Millennium Minerals 0.01 0.01 0.02 0.01 ▲ 1.6% 61 3 54 113 N/M 0.7 150 743 1025 NCM Newcrest Mining 10.35 12.09 12.12 9.51 ▲ 13.3% 9264 97 3203 12370 6.8x 85.7 130 719 977 NGF Norton Gold Fields 0.13 0.13 0.14 0.13 ▲ 0.1% 112 56 45 101 1.5x 1.1 81 930 1154 NST Northern Star Resources 0.63 0.73 0.74 0.59 ▲ 13.6% 310 51 12 271 4.7x 0.3 948 581 780 OGC* OceanaGold Corporation 1.30 1.52 1.58 1.22 ▲ 16.2% 445 26 240 659 3.8x 2.9 204 687 1117 PRU Perseus Mining 0.53 0.68 0.68 0.47 ▲ 23.5% 311 38 0 273 2.3x 3.6 68 863 1132 RDR Reed Resources 0.03 0.04 0.04 0.03 ▲ 20.6% 19 19 0 0 1.4x 0.8 0 900 N/A RED Red 5 0.62 0.62 0.62 0.60 -- 0.0% 84 15 23 93 N/M 0.8 111 973 1333 RMS Ramelius Resources 0.12 0.14 0.14 0.11 ▲ 20.3% 47 37 4 14 0.2x 0.7 17 968 N/A RRL Regis Resources 3.31 3.56 3.68 2.94 ▲ 6.0% 1759 8 0 1751 10.7x 0.6 2765 524 N/A RSG Resolute Mining 0.58 0.63 0.70 0.53 ▲ 7.5% 419 16 16 419 1.4x 3.0 124 748 963 SAR Saracen Mineral Holdings 0.12 0.12 0.13 0.10 ▼ -2.6% 71 13 15 73 1.8x 4.4 15 892 N/A SBM St Barbara 0.51 0.56 0.61 0.46 ▲ 12.0% 273 66 217 424 1.9x 1.1 348 929 1051 SLR Silver Lake Resources 0.65 0.78 0.81 0.60 ▲ 17.4% 296 21 11 286 4.7x 5.7 45 657 1199 TAM Tanami Gold 0.06 0.06 0.06 0.06 ▼ -2.1% 35 1 44 79 35.6x 1.8 40 1750 1793 TBR Tribune Resources 1.39 1.60 1.65 1.39 ▲ 14.5% 81 9 14 86 1.7x 0.4 192 N/A N/A TGZ* Teranga Gold Corp 0.59 0.64 0.67 0.57 ▲ 7.2% 156 49 76 184 0.8x 0.2 719 535 N/A TRY Troy Resources 1.55 1.62 1.72 1.39 ▲ 4.7% 254 41 0 213 2.3x 1.4 134 773 N/A UML Unity Mining 0.07 0.07 0.07 0.07 ▼ -1.4% 49 36 2 14 1.5x 0.6 20 830 N/A