Lincoln crowne copper gold report 20131202
•
1 like•275 views

Lincoln Crowne & Company Gold & Copper Market Update for the Australian market for week ended 29th November 2013

Recommended
More Related Content
What's hot
What's hot (20)
Viewers also liked
Viewers also liked (14)
Similar to Lincoln crowne copper gold report 20131202
Similar to Lincoln crowne copper gold report 20131202 (20)
More from Lincoln Crowne & Company
More from Lincoln Crowne & Company (20)
Recently uploaded
Recently uploaded (20)
Lincoln crowne copper gold report 20131202
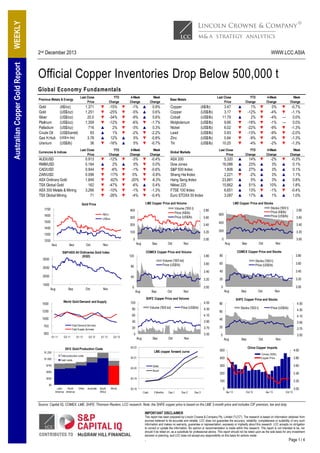
- 1. WEEKLY Australian Copper Gold Report 2nd December 2013 WWW.LCC.ASIA Official Copper Inventories Drop Below 500,000 t Global Economy Fundamentals Last Close Price Precious Metals & Energy Gold Gold Silver Platinum Palladium Crude Oil Gas H.Hub Uranium (A$/oz) (US$/oz) (US$/oz) (US$/oz) (US$/oz) (US$/barrel) 1,371 1,251 20.0 1,359 716 93 3.78 36 (US$/m btu) (US$/lb) YTD Change ▼ ▼ ▼ ▼ ▲ ▲ ▲ ▼ Last Close Price Currencies & Indices AUD/USD RMB/USD CAD/USD ZAR/USD ASX Ordinary Gold TSX Global Gold ASX 300 Metals & Mining TSX Global Mining 0.913 0.164 0.944 0.098 1,849 162 3,266 71 -15% -25% -34% -12% 2% 1% 12% -16% 4-Week Change ▼ ▼ ▼ ▼ ▼ ▼ ▲ ▲ YTD Change ▼ ▲ ▼ ▼ ▼ ▼ ▼ ▼ -12% 2% -6% -17% -62% -47% -10% -26% -1% -5% -9% -6% -3% -2% 5% 5% Week Change ▲ ▲ ▲ ▼ ▲ ▼ ▼ ▼ ▼ ▲ ▼ ▼ ▼ ▼ ▼ ▼ -3% 0% -1% 0% -20% -6% -1% -4% ▼ ▼ ▼ ▼ ▼ ▲ ▼ ▼ 0.9% 0.6% 0.6% -1.7% 0.3% -2.2% -0.8% -0.7% Copper Copper Cobalt Molybdenum Nickel Lead Zinc Tin Week Change 4-Week Change Global Markets -0.4% 0.0% -0.6% -0.8% -6.3% 0.4% -1.3% -0.4% Volume ('000 t) Price (A$/lb) Price (US$/lb) 300 US$/oz 3.60 3.40 Aug Sep Oct 1% -12% 2% -18% -22% -13% -9% -4% ▼ ▼ ▼ ▼ ▼ ▼ ▼ ▼ YTD Change ▲ ▲ ▲ ▼ ▲ ▲ ▲ ▲ 0% -4% -4% -1% -9% -9% -9% -2% Week Change ▼ ▼ — — ▼ ▼ ▼ ▼ 4-Week Change 14% 23% 27% -2% 5% 51% 13% 17% ▼ ▲ ▲ ▲ ▲ ▲ ▼ ▲ -2% 3% 3% 3% 3% 10% -1% 1% -0.7% -1.1% 0.0% 0.0% -1.3% -2.0% -1.3% -1.3% Week Change ▼ ▲ ▲ ▲ ▲ ▲ ▼ ▲ -0.3% 0.1% 0.1% 1.1% 0.8% 1.8% -0.4% 1.0% 3.80 3.60 400 3.20 3.00 3.40 200 0 Aug Nov S&P/ASX All Ordinaries Gold Index (XGD) 4-Week Change LME Copper Price and Stocks Stocks ('000 t) Price (A$/lb) Price (US$/lb) 600 0 1200 ▲ ▼ ▲ ▼ ▼ ▼ ▼ ▼ 5,320 16,086 1,806 2,221 23,881 15,662 6,651 3,087 100 1300 Sep Oct 3.20 3.00 Aug Nov COMEX Copper Price and Volume Sep Oct Nov COMEX Copper Price and Stocks 2500 1500 Aug Sep Oct 0 Nov Aug Oct 3.40 20 3.20 0 100 80 Volume ('000 lot) 80 1250 Price (US$/lb) 4.30 Q1 11 Q3 11 Q1 12 Q3 12 Q1 13 Q3 13 3.90 20 Total Demand (tonnes) Total Supply (tonnes) 3.70 0 3.50 $1,000 Aug Sep Oct Nov 3.90 3.70 3.50 Sep Oct Nov China Copper Imports 4.00 Tonnes ('000t) Copper Price 400 3.80 300 $3.19 3.40 100 Buyer 3.60 200 Seller $3.20 $500 $250 4.10 500 $3.21 $750 4.30 40 Aug LME copper forward curve Cash costs 4.50 Price (US$/lb) 0 $1,250 Total production costs Nov 20 $3.22 2012 Gold Production Costs Oct Stocks ('000 t) 60 4.10 40 750 Sep SHFE Copper Price and Stocks 60 1000 3.60 3.00 Aug Nov 3.80 Stocks ('000 t) Price (US$/lb) SHFE Copper Price and Volume World Gold Demand and Supply 1500 Sep 40 4.50 40 60 3.00 80 2000 3.60 Volume ('000 lot) Price (US$/lb) 80 3.20 120 3.80 3.40 3000 500 3.47 3.17 11.79 9.66 6.02 0.93 0.84 10.25 3.80 200 1400 YTD Change Last Close Price ASX 200 Dow Jones S&P 500 Index Shang Hai Index Hang Seng Index Nikkei 225 FTSE 100 Index Euro STOXX 50 Index 400 A$/oz 1500 (A$/lb) (US$/lb) (US$/lb) (US$/lb) (US$/lb) (US$/lb) (US$/lb) (US$/lb) LME Copper Price and Volume Gold Price 1700 1600 Last Close Price Base Metals 3.20 $0 Latin North America America Other Australia South Africa World 0 $3.18 Cash 3 Months Dec 1 Dec 2 Dec 3 Apr 12 Oct 12 Apr 13 Oct 13 3.00 Source: Capital IQ, COMEX, LME, SHFE, Thomson Reuters, LCC research. Note: the SHFE copper price is based on the LME 3-month price and includes CIF premium, tax and duty IMPORTANT DISCLAIMER This report has been prepared by Lincoln Crowne & Company Pty. Limited ("LCC"). The research is based on information obtained from sources believed to be accurate and reliable. LCC does not guarantee the accuracy, reliability, completeness or suitability o f any such information and makes no warranty, guarantee or representation, expressly or impliedly about this research. LCC accepts no ob ligation to correct or update the information. No opinion or recommendation is made within this research. This report is not intended to be, nor should it be relied on, as a substitute for professional advice. This report should not be relied upon as the sole basis for any investment decision or planning, and LCC does not accept any responsibility on this basis for actions made . Page 1 / 4
- 2. WEEKLY WWW.LCC.ASIA Markets & Majors Emerging Copper Producers Total copper inventories (COMEX, LME plus SHFE) have dropped below 500,000 tonnes last week and are currently standing at about 480,000 tonnes, following a decline of 322,000 tonnes in five months. In comparison, copper surplus is estimated at 182,000 tonnes this year and 328,000 tonnes next year according to a recent Reuters poll. Current official inventories represent less than 9 days of global consumption. Codelco produced 1.18 million tonnes of copper in the Jan-Sep period, a 0.3% decrease year-on-year due to lower ore grades, harder rock and more complicated production in deeper deposits. Codelco expects its full-year output to be in a similar range to last year’s (1.647 mt), when production fell to its lowest level since 2008. Codelco profits before tax dived 61% to $2.67 billion due to lower copper prices, higher sales costs and an unusually high comparison base with last year. The number of resources projects set for construction in Australia has slipped to its lowest in nearly a decade as the end of the resources boom curbs new investment in minerals and oil & gas. Just five projects worth a combined A$1.7 billion were approved for construction in the past six months, official figures showed last week, the lowest by number and value for a six-month period in more than a decade. "Lower commodity prices and rising costs have created a more challenging investment environment and contributed to a decline in the number of projects moving through the investment pipeline," the Bureau of Resources and Energy Economics (BREE) said in its half-yearly report. With regards to the copper and gold sectors, LCC compiled the following. 12 12 Australian Projects As at October 2013 10 10 Gold Copper # Gold # 8 8 6 6 Dargues Reef Hera Tomingley 4 Number of Projects Development Capital ($ billion) Copper 4 Andy Well Tropicana 2 2 0 0 Publicly Announced Feasibility Stage Commi ed Code Company Name Open Price Close Price AVI AZS BTR CDU HAV HCH HIG IRN KGL MMC MNC RXM VRX VXR YTC AVB FND TGS Avalon Minerals Azure Minerals Blackthorn Resources Cudeco Havilah Resources Hot Chili Highlands Pacific Indophil Resources KGL Resources Marengo Mining Metminco Rex Minerals Ventnor Resources Venturex Resources YTC Resources Avanco Resources Finders Resources Tiger Resources 0.020 0.029 0.20 1.98 0.25 0.44 0.068 0.13 0.090 0.018 0.037 0.43 0.16 0.005 0.22 0.062 0.21 0.32 0.016 0.028 0.23 2.00 0.25 0.42 0.066 0.14 0.080 0.019 0.039 0.38 0.15 0.005 0.21 0.064 0.19 0.34 -20% -3% 13% 1% 0% -3% -3% 8% -11% 6% 5% -12% -6% 0% -2% 3% -10% 6% 19 20 37 410 30 146 56 162 11 22 68 72 11 8 56 87 97 263 2.6 1.1 20.6 34.0 4.6 12.8 6.5 217.8 10.6 8.1 9.4 19.9 0.1 3.7 14.7 2.2 10.6 10.6 EV (A$m) 17 19 16 376 25 133 50 (55) 1 35 59 52 11 4 87 85 87 277 Mergers & Acquisitions Teck Resources, Newmont Mining, private equity firm Blackstone and a firm led by the former head of Barrick Gold are working together on a bid for Glencore Xstrata's Las Bambas copper mine in Peru, according to several people familiar with the matter. China's Minmetals has so far been seen as the front-runner for the US$5.9 billion project after Chinalco, the largest aluminium producer in China, dropped out of the race. Chinalco is considering an offer to team up as a minority partner with Minmetals Group, who has offered Glencore roughly US$5 billion for the copper mine. Las Bambas requires an estimated US$5.9 billion investment to be fully developed, but it is already 43% completed and production at the mine is due to start in 2015. The project is expected to produce more than 400,000 tonnes of copper per year once in production, as well as significant amounts of silver and gold. The next round of bids for Las Bambas is due this month, according to several sources. Latin Resources (ASX: LRS) has sold 70% of its Ilo Norte copper gold project to Compañia Minera Zahena (CMZ) for a total consideration of US$3.65 million cash and exploration work commitments totalling US$4 million plus the immediate execution of a 4800m diamond drilling program valued at US$1.35 million. Copper Producers 10 Code Company Name ABY AOH DML HGO OZL PEM PNA SFR SRQ TGS Aditya Birla Minerals Altona Mining Discovery Metals Hillgrove Resources OZ Minerals Perilya PanAust Sandfire Resources Straits Resources Tiger Resources As at April 2013 10 Copper Gold Copper # Open Price Close Price Weekly Market 52 Week Change Cap (A$m) Range Cash EV EV/ (A$m) (A$m) EBITDA Gold # 8 Andy Well Dargues Reef Hera Tomingley Tropicana KalNorth † Meekatharra† Mt Carlton Murchison 4 6 4 Rocklands Cloncurry (Xstrata) 2 Number of Projects 8 2 ▼ ▼ ▲ ▲ — ▼ ▼ ▲ ▼ ▲ ▲ ▼ ▼ — ▼ ▲ ▼ ▲ Cash (A$m) Source: Capital IQ, ASX announcements, LCC research. A$/US$ exchange rate of 0.90 12 Australian Projects 6 Weekly Market 52 Week Change Cap (A$m) Range Completed 12 Development Capital ($ billion) Australian Copper Gold Report 2nd December 2013 0.34 - ▼ -100% 0.15 0.15 — 0% 0.068 0.064 ▼ -6% 0.086 0.088 ▲ 2% 3.32 3.07 ▼ -8% 0.34 0.35 ▲ 1% 1.59 1.52 ▼ -4% 6.06 5.77 ▼ -5% 0.009 0.008 ▼ -11% 0.32 0.34 ▲ 6% 107 77 36 104 930 265 906 898 9 263 102 26 23 17 433 92 96 101 29 11 5 74 184 136 498 382 993 1,067 102 277 0.1x 5.2x NM 3.8x 3.9x 6.0x 3.3x 5.6x NM 4.5x Source: Capital IQ, ASX announcements, LCC research. Assumption: A$/US$ of 0.90 0 0 Publicly Announced Feasibility Stage Commi ed Completed Source: BREE amended, LCC research IMPORTANT DISCLAIMER This report has been prepared by Lincoln Crowne & Company Pty. Limited ("LCC"). The research is based on information obtained from sources believed to be accurate and reliable. LCC does not guarantee the accuracy, reliability, completeness or suitability o f any such information and makes no warranty, guarantee or representation, expressly or impliedly about this research. LCC accepts no ob ligation to correct or update the information. No opinion or recommendation is made within this research. This report is not intended to be, nor should it be relied on, as a substitute for professional advice. This report should not be relied upon as the sole basis for any investment decision or planning, and LCC does not accept any responsibility on this basis for actions made . Page 2 / 4
- 3. WEEKLY Australian Copper Gold Report 2nd December 2013 WWW.LCC.ASIA Emerging Gold Producers Code Company Name Open Price Close Price Weekly Change Market Cap (A$m) 52 Week Range Cash EV (A$m) (A$m) ABU ALK AZM BAB CHZ CVG CAS GCY GRY IGO IDC IAU KGD MSR MLX MYG OBS PAN ABM Resources Alkane Resources Azumah Resources Bullabulling Gold Chesser Resources Convergent Minerals Crusader Resources Gascoyne Resources Gryphon Minerals Independence Group Indochine Mining Intrepid Mines Kula Gold Manas Resources Metals X Mutiny Gold Orbis Gold Panoramic Resources 0.024 0.37 0.025 0.043 0.13 0.015 0.32 0.16 0.13 3.29 0.057 0.28 0.10 0.031 0.17 0.035 0.30 0.24 0.025 0.35 0.029 0.042 0.13 0.013 0.29 0.16 0.13 2.95 0.052 0.27 0.10 0.031 0.18 0.034 0.25 0.24 4% -7% 16% -2% -4% -13% -9% 0% 0% -10% -9% -4% 4% 0% 9% -3% -17% 0% 82 129 10 14 27 4 37 25 52 688 54 147 13 9 298 18 55 71 2.8 72.7 3.1 5.3 2.2 0.5 3.0 2.1 46.8 43.8 0.4 92.0 1.7 3.0 59.7 2.0 8.2 45.0 79 56 7 9 25 4 39 23 5 710 54 55 11 6 238 22 53 26 PIR PVM PXG RED RNI ROL SIH SXG SUM YTC Papillon Resources PMI Gold Phoenix Gold Red 5 Resource & Investment Robust Resources Sihayo Gold Southern Cross Goldfields Sumatra Copper & Gold YTC Resources 1.10 0.26 0.17 0.069 0.056 0.36 0.033 0.013 0.10 0.22 0.95 0.28 0.17 0.085 0.051 0.36 0.030 0.015 0.08 0.21 -14% 8% 0% 23% -9% 0% -9% 15% -24% -5% 321 116 40 65 15 37 27 13 31 56 46.1 100.5 10.7 4.5 3.9 7.1 0.1 5.1 9.4 14.7 275 15 29 60 24 36 27 15 22 87 Source: Capital IQ, LCC research. Assumption: A$/US$ of 0.90 and A$/C$ of 1.00 ASX-listed Company News OZ Minerals (ASX: OZL) increased the mineral resources for the Carrapateena project to 800 mt (+5%) at 0.8% copper and 0.3 g/t gold for 6.3 mt copper (+7%) and 8.4 moz of gold (+14%). The deposit also contains some silver and uranium. OZL confirmed that Carrapateena is Australia’s largest undeveloped copper project. The deposit starts at 470m below surface. Tiger Resources (ASX: TGS) announced a maiden inferred mineral resource at the Judeira deposit, which is within the existing Kipoi copper project mining lease area in the Democratic Republic of Congo. The inferred resource estimate amounts 6.1mt at 1.2% Cu containing 71,000 tonnes. This material can potentially be processed at the Kipoi Stage 2 solvent-extraction and electro-winning (SX-EW) plant, 6 km from Judeira. Emmerson Resources (ASX: ERM) has added 99,000 oz gold (170,000 t at 17.4 g/t) from Chariot taking the total mineral resource to 6.79 mt at 3.6 g/t gold equivalent for 900,000 gold equivalent (246,000 oz gold and 122,100 t copper). Resource & Investment (ASX: RNI) has updated its ore reserves at the Grosvenor gold project in WA to 8.79 mt at a feed grade of 1.85 g/t for 523,000 oz gold. Unity Mining (ASX: UML) announced a temporary halt to development of its Dargues gold project in NSW pending completion of technical optimisation studies and funding discussions. At Dargues, construction of the 3.2 km access road and infrastructure earthworks have been completed, with final excavation and ground support of the box cut to be completed before year end in readiness for commencement of underground mining. The mandate with the Commonwealth Bank of Australia to provide project finance remains in place and formal credit approval is expected in early 2014. Gold Producers Code Company Name Open Price Close Price AQG AGD BDR BEZ CTO CRK DRM DRA EVN EVR FML GDO KCN KRM LSA MML MLX MOY MLI NCM NGF NST OGC PNA PGI PRU PPM RMS RRL RSG SAR SBM SLR TBR TGZ TRY UML VGO Alacer Gold Austral Gold Beadell Resources Besra Gold Citigold Corporation Crocodile Gold Corp Doray Minerals Dragon Mining Evolution Mining Endeavour Mining Corp Focus Minerals Gold One International Kingsgate Consolidated Kingsrose Mining Lachlan Star Medusa Mining Metals X Millennium Minerals Mintails Newcrest Mining Norton Gold Fields Northern Star Resources OceanaGold Corporation PanAust PanTerra Gold Perseus Mining Primero Mining Corp Ramelius Resources Regis Resources Resolute Mining Saracen Mineral Holdings St Barbara Silver Lake Resources Tribune Resources Teranga Gold Corp Troy Resources Unity Mining Vantage Goldfields 2.12 0.12 0.83 0.026 0.042 0.12 0.63 0.18 0.65 0.62 0.012 0.14 1.21 0.38 1.69 0.17 0.20 0.08 8.47 0.13 0.68 1.73 1.59 0.047 0.30 5.60 0.11 3.08 0.51 0.22 0.29 0.57 2.89 0.56 1.10 0.050 0.045 2.08 0.12 0.76 0.024 0.044 0.11 0.64 0.19 0.61 0.56 0.012 0.17 1.04 0.39 0.20 1.69 0.18 0.18 0.053 7.69 0.13 0.68 1.80 1.52 0.045 0.28 5.65 0.10 3.00 0.50 0.20 0.28 0.47 2.43 0.46 1.00 0.050 0.045 Weekly Change ▼ — ▼ ▼ ▲ ▼ ▲ ▲ ▼ ▼ — ▲ ▼ ▲ — — ▲ ▼ ▼ ▼ — — ▲ ▼ ▼ ▼ ▲ ▼ ▼ ▼ ▼ ▼ ▼ ▼ ▼ ▼ — — -2% 0% -8% -8% 5% -9% 1% 6% -6% -9% 0% 21% -14% 4% 0% 0% 9% -10% -29% -9% 0% 0% 4% -4% -4% -5% 1% -9% -3% -2% -7% -2% -18% -16% -18% -10% 0% 0% Market Cap (A$m) 611 20 601 13 60 43 90 17 429 236 110 242 158 131 29 351 298 39 8 5,888 121 291 538 906 35 128 641 36 1,494 320 119 137 203 122 154 167 35 11 52 Week Range Cash (A$m) EV EV/ (A$m) EBITDA 247 364 13 69 35 667 2 69 1 58 28 21 18 127 4 13 4 552 119 416 90 36 32 452 44 308 8 123 3 52 7 352 60 238 10 71 0 10 69 10,029 42 194 48 255 16 781 96 993 6 79 27 101 126 550 33 7 93 1,401 59 355 25 116 106 362 26 198 8 134 36 198 27 146 20 15 1 10 1.6x 7.3x 64.2x 19.6x NM 0.2x NM 50.9x 2.7x NM NM 6.0x 2.9x NM NM 4.9x 25.8x 2.5x NM 8.8x 7.4x 3.4x 3.3x 3.3x NM 2.2x NM 0.2x 5.9x 1.8x 2.1x NM NM 1.9x NM 2.3x 1.1x 3.5x Source: Capital IQ, LCC research. Assumption: A$/US$ exchange rate of 0.90. June quarter data in italics, September quarter data in regular font Newcrest Mining (ASX: NCM) shares have fallen below the mark they crashed to when the company announced it would need to take up to A$6 billion in asset write-downs and is now trading at a 10-year low. The stock closed on Friday at A$8.47, valuing Newcrest at just A$5.9 billion. In November 2010, just after the A$10 billion acquisition of Lihir Gold had been completed, the company was worth more than A$30 billion. IMPORTANT DISCLAIMER This report has been prepared by Lincoln Crowne & Company Pty. Limited ("LCC"). The research is based on information obtained from sources believed to be accurate and reliable. LCC does not guarantee the accuracy, reliability, completeness or suitability o f any such information and makes no warranty, guarantee or representation, expressly or impliedly about this research. LCC accepts no ob ligation to correct or update the information. No opinion or recommendation is made within this research. This report is not intended to be, nor should it be relied on, as a substitute for professional advice. This report should not be relied upon as the sole basis for any investment decision or planning, and LCC does not accept any responsibility on this basis for actions made . Page 3 / 4
- 4. WEEKLY WWW.LCC.ASIA Australian Gold Producers Cost Curve as at 30 September 2013 600 2000 Production Price Average AISC / C3 costs C1 costs 500 Third Quartile C1 < US$1041/oz 1750 Second Quartile C1 < US$848/oz 1500 1250 First Quartile C1 < US$612/oz Mines closed 300 1000 750 200 500 100 FML KRM MLI PGI MLX NCM - Bonikro PRU RMS LSA NCM - Hidden SLR TBR SBM GDO 712 KCN VGO NEM - Boddington BEZ DRA UML NGF CRK RSG ABX - Plutonic MOY NCM - Telfer 779 EVR NCM - Lihir TGZ GFI - St Ives TRY EVN RRL NCM - Gosowong 696 PNA Kalgoorlie SAR ABX - Kanowna NST ABX - Yilgarn S CTO GFI - Agnew AGD BDR DRM AQG ABX - Cowal MML NCM - Cadia 0 PPM 617 250 OGC Annualised Gold Production (koz) 400 C1 Cost US$/oz Australian Copper Gold Report 2nd December 2013 0 IMPORTANT DISCLAIMER This report has been prepared by Lincoln Crowne & Company Pty. Limited ("LCC"). The research is based on information obtained from sources believed to be accurate and reliable. LCC does not guarantee the accuracy, reliability, completeness or suitability o f any such information and makes no warranty, guarantee or representation, expressly or impliedly about this research. LCC accepts no ob ligation to correct or update the information. No opinion or recommendation is made within this research. This report is not intended to be, nor should it be relied on, as a substitute for professional advice. This report should not be relied upon as the sole basis for any investment decision or planning, and LCC does not accept any responsibility on this basis for actions made . Page 4 / 4