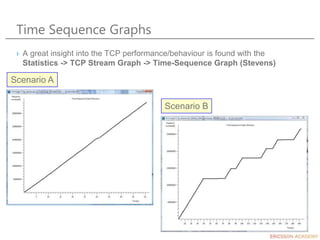
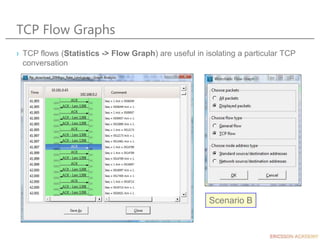
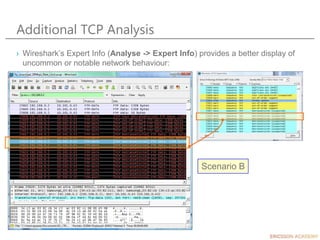
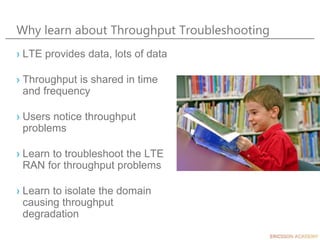
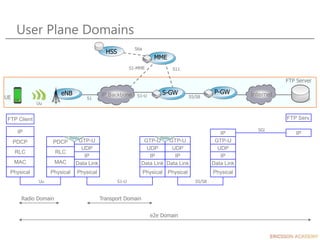
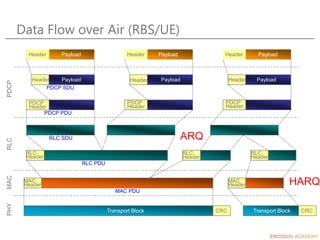
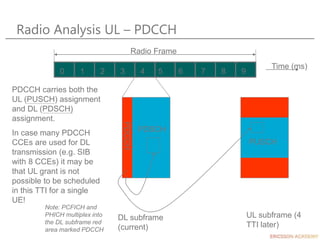
This document provides an overview of techniques for troubleshooting LTE throughput problems. It discusses isolating throughput issues to the radio, transport, or end-to-end domains. The agenda includes initial checks of network changes, UE capabilities, and RBS parameters. Radio analysis examines the baseband scheduler traces and signal traces between blocks to identify issues. Transport analysis evaluates network infrastructure. End-to-end analysis looks at the entire path from UE to application server. The goal is to pinpoint the root cause of throughput degradation within each domain using theory, traces, and examples.


![cfrPusch { cfrInfo { ri = 2, cfrLength = 22, cfrFormat = 4, cfrValid = 1, cfrExpected = 1,
cfrCrcFlag = 1 }, cfr[] = [61440, 0, 0, 0] as hex: [f0 00 00 00 00 00 00 00] }
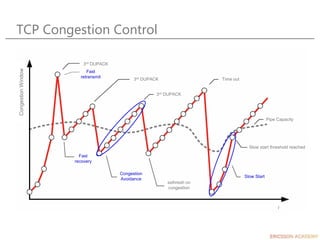
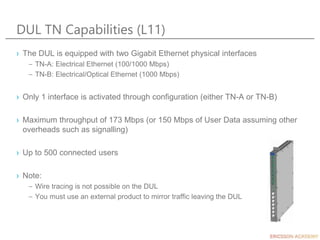
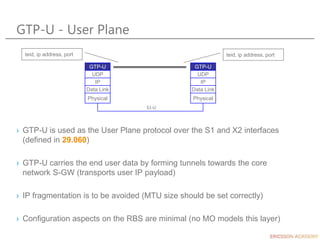
Radio Analysis DL – CQI/RI and TM
LPP_UP_ULMACPE_CI_UL_L1_MEAS2_DL_IND UpUlMacPeCiUlL1Meas2DlIndS {
cfrPucch { cfrInfo { ri = 0, cfrLength = 4, cfrFormat = 0, cfrValid = 1, cfrExpected = 1,
cfrCrcFlag = 1 }, cfr[] = [0, 0] as hex: [00 00 00 00] }
cfrFormat=0 is a WCQI report only (ignore RI)
Valid report if cfrValid=1,cfrExpected=1,cfrCrcFlag=1
mtd peek -ta ulMacPeBl -signal LPP_UP_ULMACPE_CI_UL_L1_MEAS2_DL_IND -dir OUTGOING
cfrFormat=4 is a SCQI + RI report
WCQI is first half octet (f => 15). Octets thereafter are
subband CQI reports for each RBG.
A number of subband CQIs follow (see next slide)
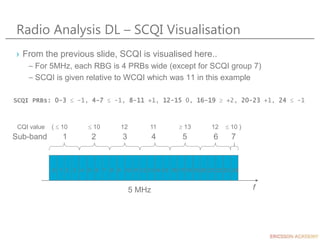
cfrPusch { cfrInfo { ri = 2, cfrLength = 18, cfrFormat = 4, cfrValid = 1, cfrExpected = 1,
cfrCrcFlag = 1 }, cfr[] = [48969, 49152, 0, 0] as hex: [bf 49 c0 00 00 00 00 00] }
Rank Indicator = 2 (indicates UE
can decode both antenna streams)
WCQI = 11. 5MHz bandwidth means 4PRBs subbands.
SCQI = F49C = 11 11 01 00 10 01 11 00
SCQI PRBs: 0-3 -1, 4-7 -1, 8-11 +1, 12-15 0, 16-19 +2, 20-23 +1, 24 -1](https://image.slidesharecdn.com/dokumen-221208115802-7eece1ab/85/dokumen-tips_ericsson-lte-throughput-troubleshooting-techniques_SUPERRRRRRR-ppt-33-320.jpg)
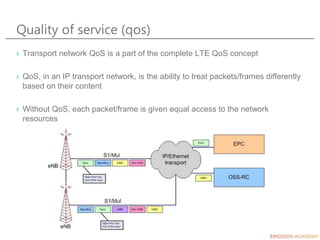
![Radio analysis DL – CQI/RI and TM
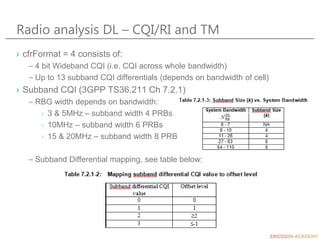
› Transmission Mode and MCS can be traced out with the following:
ULMA4/UpcDlMacCeFt_DL_SCHEDULER LEVEL2 cellId=12 : Selected SE and HARQ: rnti=61
bbUeRef=201327456 HARQ idx=1 tbs={7992 0} mcs={18 0} noOfSBs={4294443008 0} rv={0 1} ndi={0 0}
rmGbits={21600 0}"
MCS for each codeword. In this case, tm2 so only one MCS listed.
lhsh gcpu01024 te e trace4 UpcDlMacCeFt_DL_SCHEDULER
LPP_UP_DLMACPE_CI_DL_UE_ALLOC_IND (330) UpDlMacPeCiDlUeAllocIndS {
sfn = 280
subframeNr = 7
l1Control {
transmissionMode = 2
prbResourceIndicatorType = 0
prbList[] = [4294443008, 0, 12, 0]dec
[ff f8 00 00 00 00 00 00 00 00 00 0c 00 00 00 00]hex
commonTb { newDataFlag = 1, tbSizeInBytes = 999, l1Tb { rvIndex = 0, modType = 2
(UPDLMACPEMode64Qam), nrOfRateMatchedBits = 21600, rmSoftBits = 1237248 } }
PRB list in RBGs, for 5MHz RBG
size is 2. fff8 corresponds to 25
PRBs (last PRB is 1 less).
MCS is a combination of tbSize and modType.
999 bytes = 7992 bits then put into TS36.213 Table 7.1.7.2.1-1 for
NPRB=25. That gives ITBS of 16.
Convert ITBS to MCS using Table 7.1.7.1-1.
mtd peek -ta dlMacPeBl -signal LPP_UP_DLMACPE_CI_DL_UE_ALLOC_IND -dir INCOMING
-filter {(U16SIG)8,NEQ,(U16)0x00}](https://image.slidesharecdn.com/dokumen-221208115802-7eece1ab/85/dokumen-tips_ericsson-lte-throughput-troubleshooting-techniques_SUPERRRRRRR-ppt-37-320.jpg)
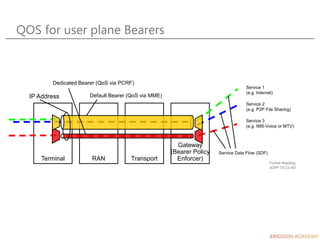
![Radio analysis DL – CQI/RI and TM
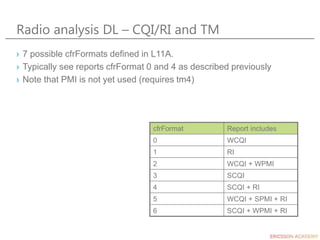
› Example of switching transmission modes based upon RI
(bfn:3352, sfn:280, sf:5.47, bf:128) ULMA4/UpcDlMacCeFt_DL_SCHEDULER LEVEL2 cellId=12 :
Selected SE and HARQ: rnti=61 bbUeRef=201327456 HARQ idx=1 tbs={7992 0} mcs={18 0}
noOfSBs={4294443008 0} rv={0 1} ndi={0 0} rmGbits={21600 0}"
TM=2 transmission with MCS 18
cfrPusch { cfrInfo { ri = 2, cfrLength = 18, cfrFormat = 4, cfrValid = 1, cfrExpected = 1,
cfrCrcFlag = 1 }, cfr[] = [48969, 49152, 0, 0] as hex: [bf 49 c0 00 00 00 00 00] }
Rank Indicator = 2 received from UE. eNB will now
switch to tm3 (OLSM MIMO) transmission
WCQI 11 + SCQI.
bfn:3352, sfn:280, sf:6.47, bf:131) ULMA4/UpcDlMacCeFt_DL_SCHEDULER LEVEL2 cellId=12 :
Selected SE and HARQ: rnti=61 bbUeRef=201327456 HARQ idx=0 tbs={5736 5736} mcs={13 13}
noOfSBs={4294443008 0} rv={0 0} ndi={0 1} rmGbits={14400 14400}"
25 PRBs as according to previous example
TM=3 with MCS=13. TBS = 5736 => 11448 over NPRB=50](https://image.slidesharecdn.com/dokumen-221208115802-7eece1ab/85/dokumen-tips_ericsson-lte-throughput-troubleshooting-techniques_SUPERRRRRRR-ppt-39-320.jpg)
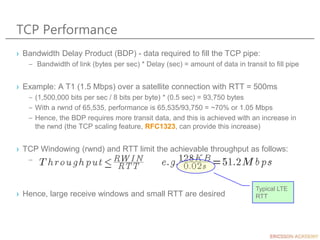
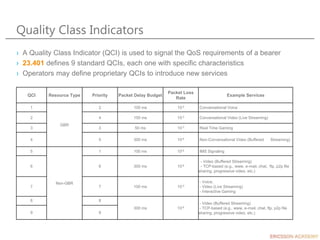
![Radio Analysis Dl – HARQ DL Grant
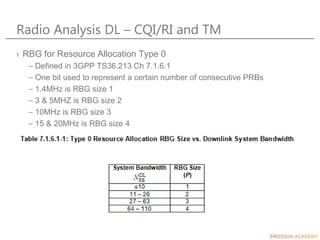
LPP_UP_DLMACPE_CI_DL_UE_ALLOC_IND (330) UpDlMacPeCiDlUeAllocIndS {
sfn = 280
subframeNr = 8
ueAlloc[0] {
l1Control {
rnti = 61
transmissionMode = 3
prbResourceIndicatorType = 0
prbList[] = [4294443008, 0, 12, 0]dec
[ff f8 00 00 00 00 00 00 00 00 00 0c 00 00 00 00]hex
swapFlag = 0
}
nrOfTb = 2
tbAlloc[0] {
tbIndex = 0
commonTb { newDataFlag = 1, tbSizeInBytes = 717, l1Tb { rvIndex = 0,
modType = 1 (UPDLMACPEMode16Qam), nrOfRateMatchedBits = 14400, rmSoftBits =
1237248 } }
macTb { dlHarqProcessId = 0, nrOfMacCtrlElem = 0 }
rlcTb { nrOfBearer = 1, bearerAlloc[0] { bbBearerRef = 201327458, lcid = 3,
rbScheduledSizeInBytes = 717 } }
}
tbAlloc[1] {
...
SFN/subframe where DL PDSCH will occur.
PDCCH DL Grant sent at same sfn/subframe.
RNTI, TM, used PRBs (same for both code words)
If re-transmission, this indicates if CW0 and CW1 swapped layers
newDataFlag indicates if it is new data or not
HARQ redundancy version. rv0 used for initial transmission, rv2,
rv3, rv1 used for re-transmission.
HARQ process number. 8 HARQ processes
exist in FDD LTE L11A.
CW1 defined here.](https://image.slidesharecdn.com/dokumen-221208115802-7eece1ab/85/dokumen-tips_ericsson-lte-throughput-troubleshooting-techniques_SUPERRRRRRR-ppt-47-320.jpg)
![Radio Analysis Dl – HARQ FEEDBACK
(NACK/NACK)
LPP_UP_ULMACPE_CI_UL_L1_MEAS2_DL_IND (431) UpUlMacPeCiUlL1Meas2DlIndS {
sigNo = 23070220
header {
cellId = 12
sfn = 281
subFrameNo = 2
}
nrOfPuschReports = 0
nrOfPucchReports = 1
totalNrOfReports = 1
reportList[0] {
pucchReport {
meas2DlUlReportType = 1 (ElibBbBaseCommonMeas2DlPucchReport)
bbUeRef = 201327456
isDtx { isDtx = 0 }
dlHarqInfo { dlHarqValid = 1, detectedHarqIndication = 0, dlHarqProcessId
= 0, nrOfTb = 2, swapFlag = 0 }
rxPower { prbListStart = 0, prbListEnd = 0, rxPowerReport = -1150, sinr =
0 }
timingAdvanceError { timingAdvanceError = 1 }
cfrPucch { cfrInfo { ri = 0, cfrLength = 0, cfrFormat = 0, cfrValid = 0,
cfrExpected = 0, cfrCrcFlag = 0 }, cfr[] = [0, 0] as hex: [00 00 00 00] }
}
}
}
SFN/subframe +4 from DL grant (i.e. where the
HARQ ACK/NACK is received from UE).
HARQ NACK received for DL HARQ Process 0 on both code
words.
DetectedHarqIndication: 0 => NACK/NACK, 1 => NACK/ACK,
2 => ACK/NACK, 3 => ACK/ACK, 4 => DTX (nothing received)](https://image.slidesharecdn.com/dokumen-221208115802-7eece1ab/85/dokumen-tips_ericsson-lte-throughput-troubleshooting-techniques_SUPERRRRRRR-ppt-48-320.jpg)
![Radio Analysis Dl – HARQ ReTX
LPP_UP_DLMACPE_CI_DL_UE_ALLOC_IND (330) UpDlMacPeCiDlUeAllocIndS {
sfn = 281
subframeNr = 6
ueAlloc[0] {
l1Control {
rnti = 61
transmissionMode = 3
prbResourceIndicatorType = 0
prbList[] = [4294443008, 0, 12, 0]dec
[ff f8 00 00 00 00 00 00 00 00 00 0c 00 00 00 00]hex
swapFlag = 0
}
nrOfTb = 2
tbAlloc[0] {
tbIndex = 0
commonTb { newDataFlag = 0, tbSizeInBytes = 717, l1Tb { rvIndex = 2,
modType = 1 (UPDLMACPEMode16Qam), nrOfRateMatchedBits = 14400, rmSoftBits =
1237248 } }
macTb { dlHarqProcessId = 0, nrOfMacCtrlElem = 0 }
rlcTb { nrOfBearer = 0 }
} tbAlloc[1] {
tbIndex = 1
commonTb { newDataFlag = 0, tbSizeInBytes = 717, l1Tb { rvIndex = 2,
modType = 1 (UPDLMACPEMode16Qam), nrOfRateMatchedBits = 14400, rmSoftBits =
1237248 } }
SFN/subframe where DL PDSCH will occur.
PDCCH DL Grant sent at same sfn/subframe.
RNTI, TM, used PRBs (same for both code words)
Same as previous transmission
newDataFlag=0 means it’s a retransmission
HARQ redundancy version. rv2 is used for first retransmission
HARQ process number (same as before)
CW1 defined here.](https://image.slidesharecdn.com/dokumen-221208115802-7eece1ab/85/dokumen-tips_ericsson-lte-throughput-troubleshooting-techniques_SUPERRRRRRR-ppt-49-320.jpg)
![Radio Analysis Dl – HARQ FEEDBACK (ACK/ACK)
LPP_UP_ULMACPE_CI_UL_L1_MEAS2_DL_IND (431) UpUlMacPeCiUlL1Meas2DlIndS {
sigNo = 23070220
header {
cellId = 12
sfn = 282
subFrameNo = 0
}
nrOfPuschReports = 0
nrOfPucchReports = 1
totalNrOfReports = 1
reportList[0] {
pucchReport {
meas2DlUlReportType = 1 (ElibBbBaseCommonMeas2DlPucchReport)
bbUeRef = 201327456
isDtx { isDtx = 0 }
dlHarqInfo { dlHarqValid = 1, detectedHarqIndication = 3, dlHarqProcessId
= 0, nrOfTb = 2, swapFlag = 0 }
rxPower { prbListStart = 0, prbListEnd = 0, rxPowerReport = -1152, sinr =
0 }
timingAdvanceError { timingAdvanceError = 0 }
cfrPucch { cfrInfo { ri = 0, cfrLength = 0, cfrFormat = 0, cfrValid = 0,
cfrExpected = 0, cfrCrcFlag = 0 }, cfr[] = [0, 0] as hex: [00 00 00 00] }
}
}
}
SFN/subframe +4 from DL grant (i.e. where the
HARQ ACK/NACK is received from UE).
HARQ ACK/ACK received for DL HARQ Process 0 on both
code words.
DetectedHarqIndication: 0 => NACK/NACK, 1 => NACK/ACK,
2 => ACK/NACK, 3 => ACK/ACK, 4 => DTX (nothing received)](https://image.slidesharecdn.com/dokumen-221208115802-7eece1ab/85/dokumen-tips_ericsson-lte-throughput-troubleshooting-techniques_SUPERRRRRRR-ppt-50-320.jpg)

![macCtrlElementList[0] {
type = 6 (UpUpCommonMacCommonMacCtrlElemShortBsr)
powerHeadroomReport { type = 6 (UpUpCommonMacCommonMacCtrlElemShortBsr), powerHeadroom
= 127 }
cRnti { type = 6 (UpUpCommonMacCommonMacCtrlElemShortBsr), crnti = 8362387 }
truncatedBSR { type = 6 (UpUpCommonMacCommonMacCtrlElemShortBsr), bufferSize = 127 }
shortBSR { type = 6 (UpUpCommonMacCommonMacCtrlElemShortBsr), bufferSize = 127 }
longBSR { type = 6 (UpUpCommonMacCommonMacCtrlElemShortBsr), bufferSizeNr1Nr2 = 127,
bufferSizeNr3Nr4 = 39315 }
}
Radio Analysis Ul – BSR
› Buffer Status Report (BSR) is used to inform the eNB of the current
data waiting for transmission in the UE (3GPP TS36.213 Ch. 6.1.3.1)
› Values ranges from 0 up to >15000 bytes using 64 index values.
– e.g. index 0 for BS=0, index 1 for 0 < BS <= 10 and so forth.
› Can be traced out through
LPP_UP_ULMACPE_CI_UL_MAC_CTRL_INFO_IND. Expect to see high
values for maximum UL throughput. Low values indicate UE/laptop problem.
Type of MAC report, this case short BSR (6)
LSB 6 bits are the BSR index (this case >150000 bytes)
MSB 2 bits is the LCID](https://image.slidesharecdn.com/dokumen-221208115802-7eece1ab/85/dokumen-tips_ericsson-lte-throughput-troubleshooting-techniques_SUPERRRRRRR-ppt-55-320.jpg)
![Radio Analysis UL – PHR
macCtrlElementList[0] {
type = 3 (UpUpCommonMacCommonMacCtrlElemPowerHr)
powerHeadroomReport { type = 3 (UpUpCommonMacCommonMacCtrlElemPowerHr), powerHeadroom =
55 }
cRnti { type = 3 (UpUpCommonMacCommonMacCtrlElemPowerHr), crnti = 3637377 }
truncatedBSR { type = 3 (UpUpCommonMacCommonMacCtrlElemPowerHr), bufferSize = 55 }
shortBSR { type = 3 (UpUpCommonMacCommonMacCtrlElemPowerHr), bufferSize = 55 }
longBSR { type = 3 (UpUpCommonMacCommonMacCtrlElemPowerHr), bufferSizeNr1Nr2 = 55,
bufferSizeNr3Nr4 = 32897 }
}
Type of MAC report, this case PHR (3)
PHR value of 55 which corresponds to 32 <= PH < 33. In this case there is no power
limitation on the UE side.
PH Index values <= 23 indicates the UE has reached maximum transmission power
Negative values indicate the UE was power limited
See 3GPP TS36.133 Ch 9.1.8.4 for index mapping](https://image.slidesharecdn.com/dokumen-221208115802-7eece1ab/85/dokumen-tips_ericsson-lte-throughput-troubleshooting-techniques_SUPERRRRRRR-ppt-57-320.jpg)
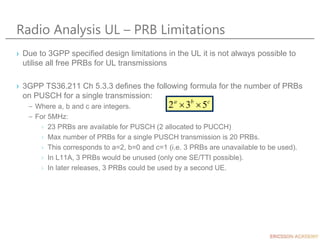
![Radio Analysis UL – Link Adaptation
LPP_UP_ULCELLPE_CI_CELL_STATUS_REPORT_IND UpUlCellPeCiCellStatusReportIndS {
sfn = 456
subFrameNo = 3
interferencePower = -1170
Cell interference level x 10 (i.e. -117.0 dBm)
High values here (>-104)
LPP_UP_ULMACPE_CI_UL_L1_MEAS2_UL_IND (432) UpUlMacPeCiUlL1Meas2UlIndS {
sfn = 264
subFrameNo = 8
nrOfPuschReports = 1
rxPower { prbListStart=1, prbListEnd=48, rxPowerReport=-956, sinr=821854514 }
rxPwr = -95.6dBm over those PRBs (pZeroNominalPusch= -96dBm)
= ~22.9dB
)
2
(sinr
log
10
=
sinr[dB] -22
10
LPP_UP_ULMACPE_CI_UL_MAC_CTRL_INFO_IND (433) UpUlMacPeCiUlMacCtrlInfoIndS {
sfn = 264
subFrameNo = 8
harqInfo = 1 (UpUpCommonMacCommonMacCtrlElemHarqFeedbackAck)
macCtrlElementList[0] {
type = 3 (UpUpCommonMacCommonMacCtrlElemPowerHr)
powerHeadroomReport { type = 3 (UpUpCommonMacCommonMacCtrlElemPowerHr),
powerHeadroom = 55 }
HARQ ACK / PHR](https://image.slidesharecdn.com/dokumen-221208115802-7eece1ab/85/dokumen-tips_ericsson-lte-throughput-troubleshooting-techniques_SUPERRRRRRR-ppt-61-320.jpg)

![LTE RAN QoS Configuration
› LTE RAN complies with 3GPP TS 23.203 and IEEE 802.1p:
› Using these MOs we are able to map out the quality of service properties
defined in the RBS
===============================================================
MO dscp priority qci
===============================================================
QciTable=default,QciProfilePredefined=qci1 46 2 1
QciTable=default,QciProfilePredefined=qci7 20 7 7
QciTable=default,QciProfilePredefined=qci9 12 9 9
QciTable=default,QciProfilePredefined=qci5 40 1 5
QciTable=default,QciProfilePredefined=qci3 34 3 3
QciTable=default,QciProfilePredefined=default 0 10 0
QciTable=default,QciProfilePredefined=qci8 10 8 8
QciTable=default,QciProfilePredefined=qci6 28 6 6
QciTable=default,QciProfilePredefined=qci2 36 4 2
QciTable=default,QciProfilePredefined=qci4 26 5 4
===============================================================
====================================================
MO Attribute Value
====================================================
Subrack=1,Slot=1,PlugInUnit=1,ExchangeTerminalIp=1,Gig
aBitEthernet=1 dscpPbitMap t[64] =
>>> Struct[0] has 2 members:
>>> 1.dscp = 0
>>> 2.pbit = 0
... truncated ...
>>> Struct[46] has 2 members:
>>> 1.dscp = 46
>>> 2.pbit = 6
>>> Struct[47] has 2 members:
>>> 1.dscp = 47
>>> 2.pbit = 0
Transport Network Configuration (39/1553-HSC 105 50/1)](https://image.slidesharecdn.com/dokumen-221208115802-7eece1ab/85/dokumen-tips_ericsson-lte-throughput-troubleshooting-techniques_SUPERRRRRRR-ppt-93-320.jpg)
![RBS Counters via COLI
$ nssinfo tupm
****** NSS TUM2 tu_pm related data ******
PMfroId : 1
PMfroType : 66817
granularityPeriod : 900
suspectFlag : 0
par_pmMDVCounter : 186
par_pmHDVB1Pct : 0
par_pmHDVB10Pct : 1
par_pmHDVB50Pct : 5
****** END ******
$ sctphost_stat -assoc -all
sctphost_stat - START.
|-------------------------------------------------------|
|----------------------- SCTP HOST ---------------------|
|RpuId: 17
|SctpInstId: 0
|Base State: BASE_RUN
|Host State: A|C|R|X|IA
|Ext. client: CONNECTED
|Alarm Timer: NOT RUNNING
|---------------- SCTP ASSOCIATION 96 -----------------|
|-------------------------------------------------------|
|----------------Statistic (assoc level)----------------|
| [ID 7]: SCTP_STAT_SENT_CHUNKS, Count: 1|
| [ID 8]: SCTP_STAT_REC_CHUNKS, Count: 1|
| [ID 9]: SCTP_STAT_OUT_OF_ORDER_SC, Count: 0|
| [ID 10]: SCTP_STAT_OUT_OF_ORDER_RC, Count: 0|
| [ID 12]: SCTP_STAT_RETRANS_CHUNKS, Count: 0|
| [ID 13]: SCTP_STAT_SENT_CC, Count: 16264|
| [ID 14]: SCTP_STAT_REC_CC, Count: 16264|
| [ID 15]: SCTP_STAT_FRAG_USER_MSG, Count: 0|
| [ID 16]: SCTP_STAT_REAS_USER_MSG, Count: 0|
| [ID 17]: SCTP_STAT_SENT_PACKAGES, Count: 16265|
| [ID 18]: SCTP_STAT_REC_PACKAGES, Count: 16265|
<truncated>
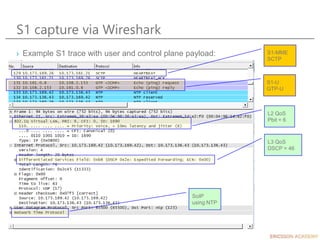
› RBS COLI counters show detailed
performance issues
– S1AP/X2AP (SCTP MO)
– sctphost_stat -assoc -all
› SoIP (Synchronization MO)
– nssinfo tupm](https://image.slidesharecdn.com/dokumen-221208115802-7eece1ab/85/dokumen-tips_ericsson-lte-throughput-troubleshooting-techniques_SUPERRRRRRR-ppt-98-320.jpg)