Download to read offline

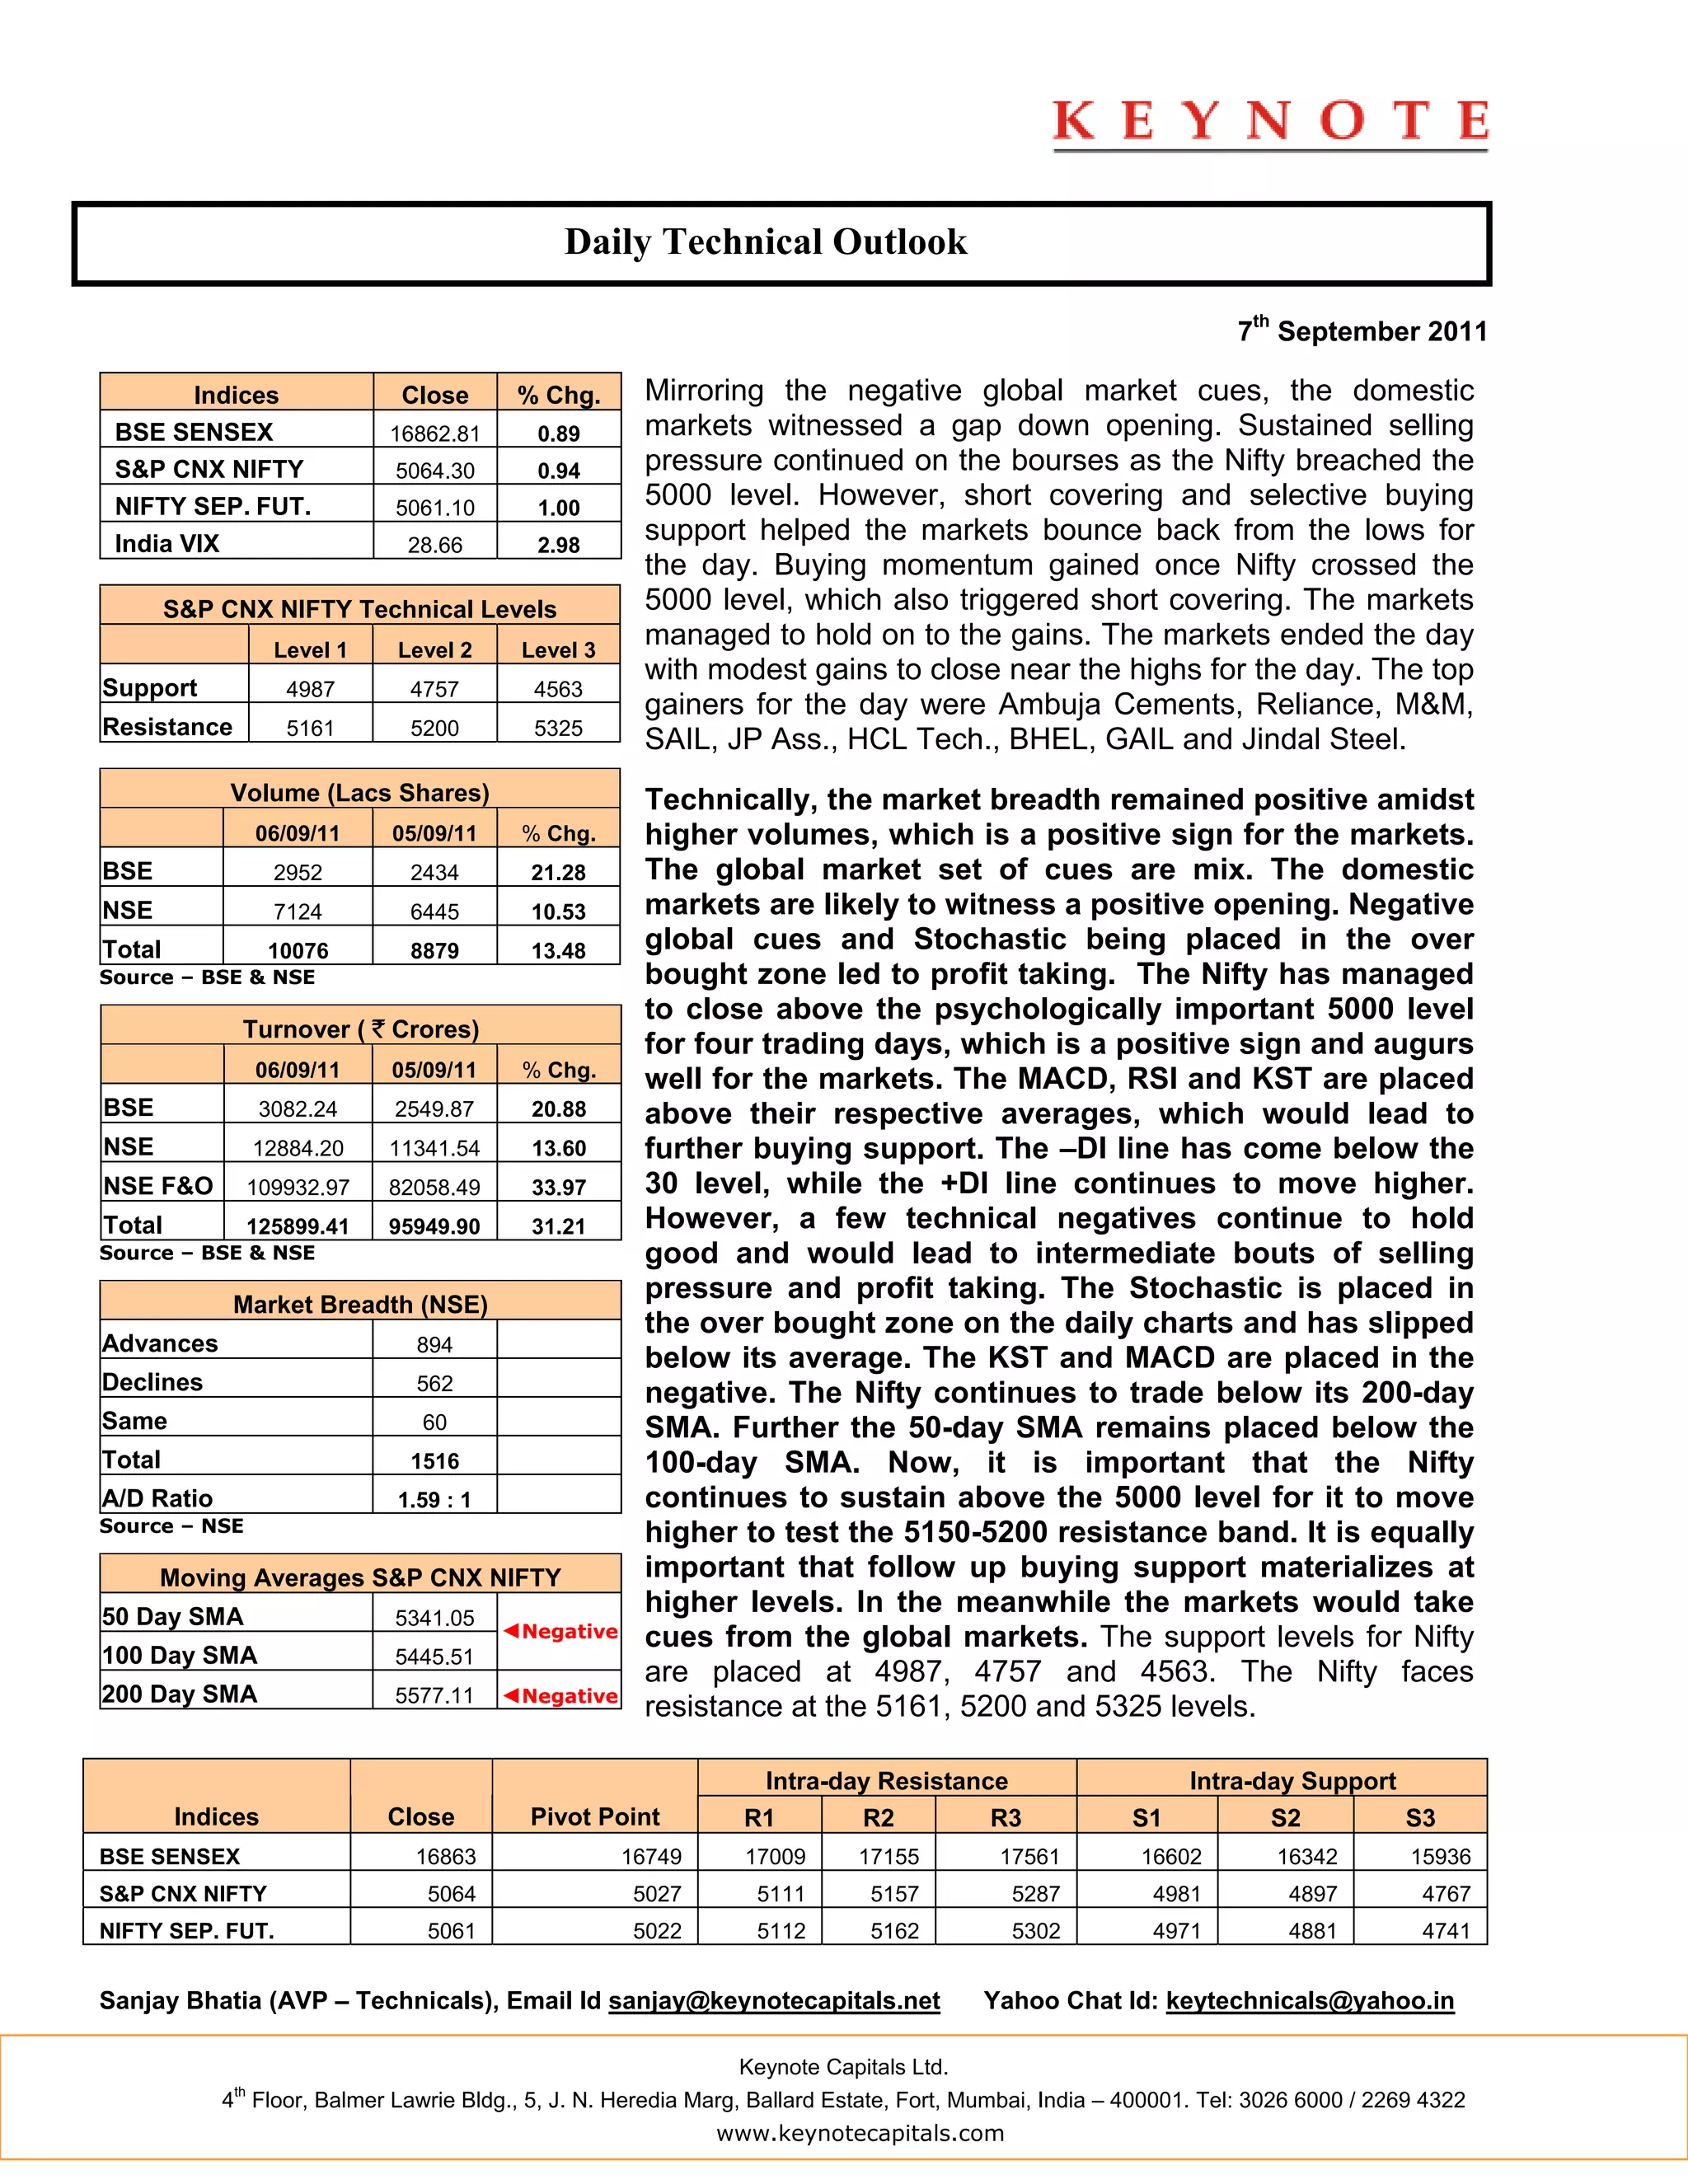
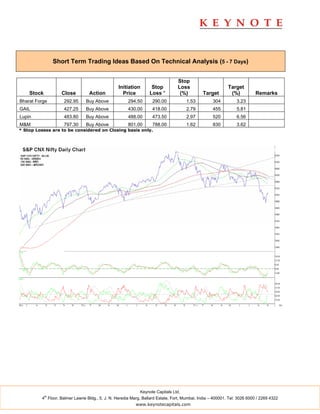

The domestic stock markets opened lower mirroring negative global cues but recovered from lows due to short covering and selective buying support. The Nifty breached but then closed above the psychologically important 5000 level for the fourth day, which is seen as a positive sign. Market breadth was positive amidst higher volumes. Technical indicators point to further buying support but some negatives could lead to intermittent selling pressure. Key support and resistance levels for the Nifty are noted. Short term trading ideas based on technical analysis are also provided.


